
Bedroom count
Property type
Last updated on July 12, 2026
Average rent in
San Jose, CA
Average rent in
Last updated on July 12, 2026
Bedroom count
Property type
Key takeaways for renters
Where San Jose rent stands today
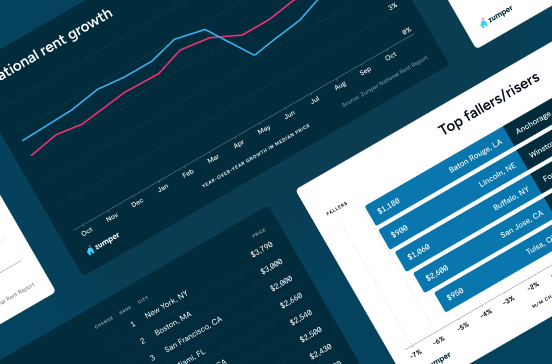
San Jose, CA rent rose 11.3% year over year, with a current median of $3,357/month. Renters today are paying $331 more per month on average than last year, with rent reaching the city's peak this month in July 2026.
Vs. national rents
San Jose runs roughly 1.7× the $1,950/month national median, placing it among the pricier coastal metros for renters. The market offers 379 total rentals, reflecting a relatively tight inventory.
Rent ranges by bedroom
Studios in San Jose rent for about $2,029/month, 1-bedrooms for $2,631/month, and 2-bedrooms for $3,500/month, with 3-bedrooms at $4,398/month and 4+ bedrooms at $5,500/month. Apartments make up 53.9% of rentals, houses 35.4%, with houses renting at a median of $4,398/month and apartments at $3,213/month.
Neighborhood spotlight
Crossgate rents fell 70.1% year over year to $3,369/month across 13 rentals. This steep local decline contrasts with the citywide 11.3% rent increase and marks a significant hyperlocal shift in San Jose's rental market.
Median rent
Median rent in San Jose
$3,357/mo
vs previous year
The average rent in San Jose is $3,357 per month as of July 2026. This is 72% above the national average rent, or $1,407 more per month.
average price per square foot
Total rentals
Available rentals in San Jose
379
for rent on Zumper.com as of July 2026
Rent price distribution
Share of San Jose rentals at each price point
Rent trends in San Jose, CA
Average rent prices in San Jose have increased by 3% over the last month and have increased by 11% since last year.
Rent trends
Rent prices on this page are calculated on a rolling 30-day basis and updated daily.
Compare rent prices in
San Jose, CA
Rent prices in San Jose vary by bedroom size, rental type, and neighborhood. The average rent for an apartment in San Jose is $3,213, whereas a house costs $4,397. 1-bedroom apartments in San Jose run $2,908 on average, while 2-bedroom apartments are $3,607.
Listings | ||||
|---|---|---|---|---|
Studio | $2,029 |  2% |  1% | |
1 bedroom | $2,631 | 4% | 5% | |
2 bedroom | $3,500 | 4% | 9% | |
3 bedroom | $4,397 | 1% | 7% | |
4 bedroom | $5,500 | 7% | 17% |
Listings | ||
|---|---|---|
Blackford | $3,309 | |
Blossom Valley | $3,817 | |
Branham Kirk | $4,399 | |
Calvert | $3,910 | |
Canoas Garden | $2,695 | |
Countrybrook Lagoon | $3,507 | |
Del Marietta Southwest | $3,263 | |
Downtown San Jose | $2,904 | |
Garden Alameda | $3,777 | |
Mckay Ringwood | $3,380 |
Listings | ||||
|---|---|---|---|---|
Apartments | $3,213 | 3% | No Change | |
Condos | $2,695 | 4% | No Change | |
Houses | $4,397 | 1% | No Change | |
Rooms | $1,200 | 1% | 4% |
Studio
Average rent
$2,029
Last 30 days
2%
Last year
1%
1 bedroom
Average rent
$2,631
Last 30 days
4%
Last year
5%
2 bedroom
Average rent
$3,500
Last 30 days
4%
Last year
9%
3 bedroom
Average rent
$4,397
Last 30 days
1%
Last year
7%
4 bedroom
Average rent
$5,500
Last 30 days
7%
Last year
17%
Downtown San Jose
Average rent
$2,904
Garden Alameda
Average rent
$3,777
Blossom Valley
Average rent
$3,817
Del Marietta Southwest
Average rent
$3,263
Countrybrook Lagoon
Average rent
$3,507
Blackford
Average rent
$3,309
Mckay Ringwood
Average rent
$3,380
Canoas Garden
Average rent
$2,695
Calvert
Average rent
$3,910
Branham Kirk
Average rent
$4,399
Apartments
Average rent
$3,213
Last 30 days
3%
Condos
Average rent
$2,695
Last 30 days
4%
Houses
Average rent
$4,397
Last 30 days
1%
Rooms
Average rent
$1,200
Last 30 days
1%
Last year
4%
The table above reflects average rent prices in San Jose, CA, broken down by the number of bedrooms, neighborhoods, and property types. The availability of data for each category is dependent on market inventory and will adjust depending on your selected filters.
How does rent in San Jose, CA compare to other cities?
Compare median rent prices in San Jose and Campbell by all bedroom counts and property types.
San Jose
higher than the national median
higher than the national median
Takeaway
The median rent for all rentals in San Jose, CA is 3% higher than the median rent in Campbell, CA.
Average rent in nearby cities
Explore rent trends in neighboring markets
$3,260
$4,495
$3,049
$4,633
$3,647
$2,897
$4,120
$4,565
$3,528
$5,495
$3,795
$2,945
Cost of living in San Jose, CA
Explore the cost of essential expenses, and then use our rent calculator to find out how much rent you can afford.
Expenses accrued by most renters | Average cost compared to national average |
|---|---|
| Goods & Services | 21% higher |
| Groceries | 11% higher |
| Health | 10% higher |
| Housing | 228% higher |
| Transportation | 37% higher |
| Utilities | 41% higher |
Discover rentals in San Jose, CA

5d+ ago
Commodore house for rent in San Jose
2145 Commodore Dr, San Jose, CA 95133
1 bed
1 bath
$500
House for rent
Available Feb 6

5d+ ago
Downtown San Jose apartment for rent in San Jose
380 N 13th St Rm 6 #6, San Jose, CA 95112
1 bed
1 bath
$900
Apartment for rent
Available Feb 3

5d+ ago
524 S 9th St, San Jose, CA 95112
Studio–2 beds
1 bath
$975–$2,000
Apartment for rent

5d+ ago
1058 Roewill Dr, San Jose, CA 95117
Studio
1 bath
$1,000
Apartment for rent


5d+ ago
House for rent in San Jose
3410 Pepper Tree Ln, San Jose, CA 95127
3 beds
1.5 baths
$12,800
House for rent
Available Apr 17

5d+ ago
Crossgate house for rent in San Jose
6429 Mcabee Rd, San Jose, CA 95120
4 beds
2.5 baths
$12,800
House for rent
Available Jan 24

5d+ ago
Broadway-Palmhaven house for rent in San Jose
3 beds
3 baths
$7,895
$7,695
Price drop
House for rent

19m ago
355 Santana Row, San Jose, CA 95128
1–4 beds
1–3 baths
$3,340–$6,661
The price shown reflects a 12-month lease and includes base rent plus all required monthly fees provided by the property.Apartment for rent


23h ago
Verified
2130 Southwest Expy, San Jose, CA 95126
Studio–2 beds
1 bath
$2,884–$3,522
Apartment for rent


23h ago
Verified
2130 Southwest Expy, San Jose, CA 95126
Studio–2 beds
1 bath
$2,884–$3,522
Apartment for rent
7h ago
Verified
250 Palm Valley Blvd, San Jose, CA 95123
1–3 beds
1–2 baths
$2,877–$4,527
Apartment for rent

16h ago
Verified
355 Sunol St, San Jose, CA 95126
Studio–1 bed
1 bath
$2,749–$3,059
Price drop
Apartment for rent


4d ago
Verified
6670 Emergent Way, San Jose, CA 95119
1 bed
1 bath
$3,480–$4,087
Price drop
Apartment for rent
Available Jul 12
Stay up to date with rental market insights

Are you interested in licensing our current and historical rental real estate data, or do you have custom data requests? Contact datalicensing@zumper.com.
Frequently asked questions for San Jose, CA
Quick answers to common questions about the San Jose rental market.
How much is rent in San Jose?
The average rent in San Jose is $3,357 per month as of July 11, 2026.
Is rent up or down in San Jose?
Average rent prices in San Jose have increased by 3% over the last month and have increased by 11% since last year.
How does San Jose rent compare to the national average?
Rent in San Jose is 72% above the national average, which means renters are paying approximately $1,407 more per month.
Which neighborhoods are most affordable in San Jose?
The most affordable neighborhoods in San Jose are Canoas Garden ($2,695/mo), Downtown San Jose ($2,904/mo), and Del Marietta Southwest ($3,263/mo).
What salary do I need to afford rent in San Jose?
To comfortably afford rent in San Jose, you'd need to earn approximately $134,000/year, based on spending no more than 30% of your income on rent.
When is the best time of year to rent in San Jose?
San Jose's 2025 rental market shows 1-bedroom apartments averaging around $2,700 per month, while 2-bedroom units rent for around $3,400 monthly. These figures reflect the city's position as a major tech hub in Silicon Valley, where housing costs align with the area's high-paying technology sector.
Methodology
Rent prices are based on Zumper's rental listings from the past 30 days. Median rent is calculated across all available listings and property types on the platform. If you filter the page by bedroom count or property type, the pricing throughout the page will update automatically to reflect that segment of the rental market.
Household and population data come from the U.S. Census Bureau. Cost-of-living data is sourced from the Council for Community and Economic Research's Cost of Living Index (COLI).