
Notable Trends
- The spring thaw is here: the median national one-bedroom rent rose 0.7% month-over-month to $1,519, and two-bedrooms rose 0.4% to $1,903, a sign that spring leasing season is finally pulling prices up the way it historically has, after two unusually muted years.
- New York CIty hits a new ceiling: NYC one-bedroom rent reached an all-time high, climbing 3.1% month-over-month to $4,680, the most expensive one-bedroom figure in Zumper’s decade-plus of data.
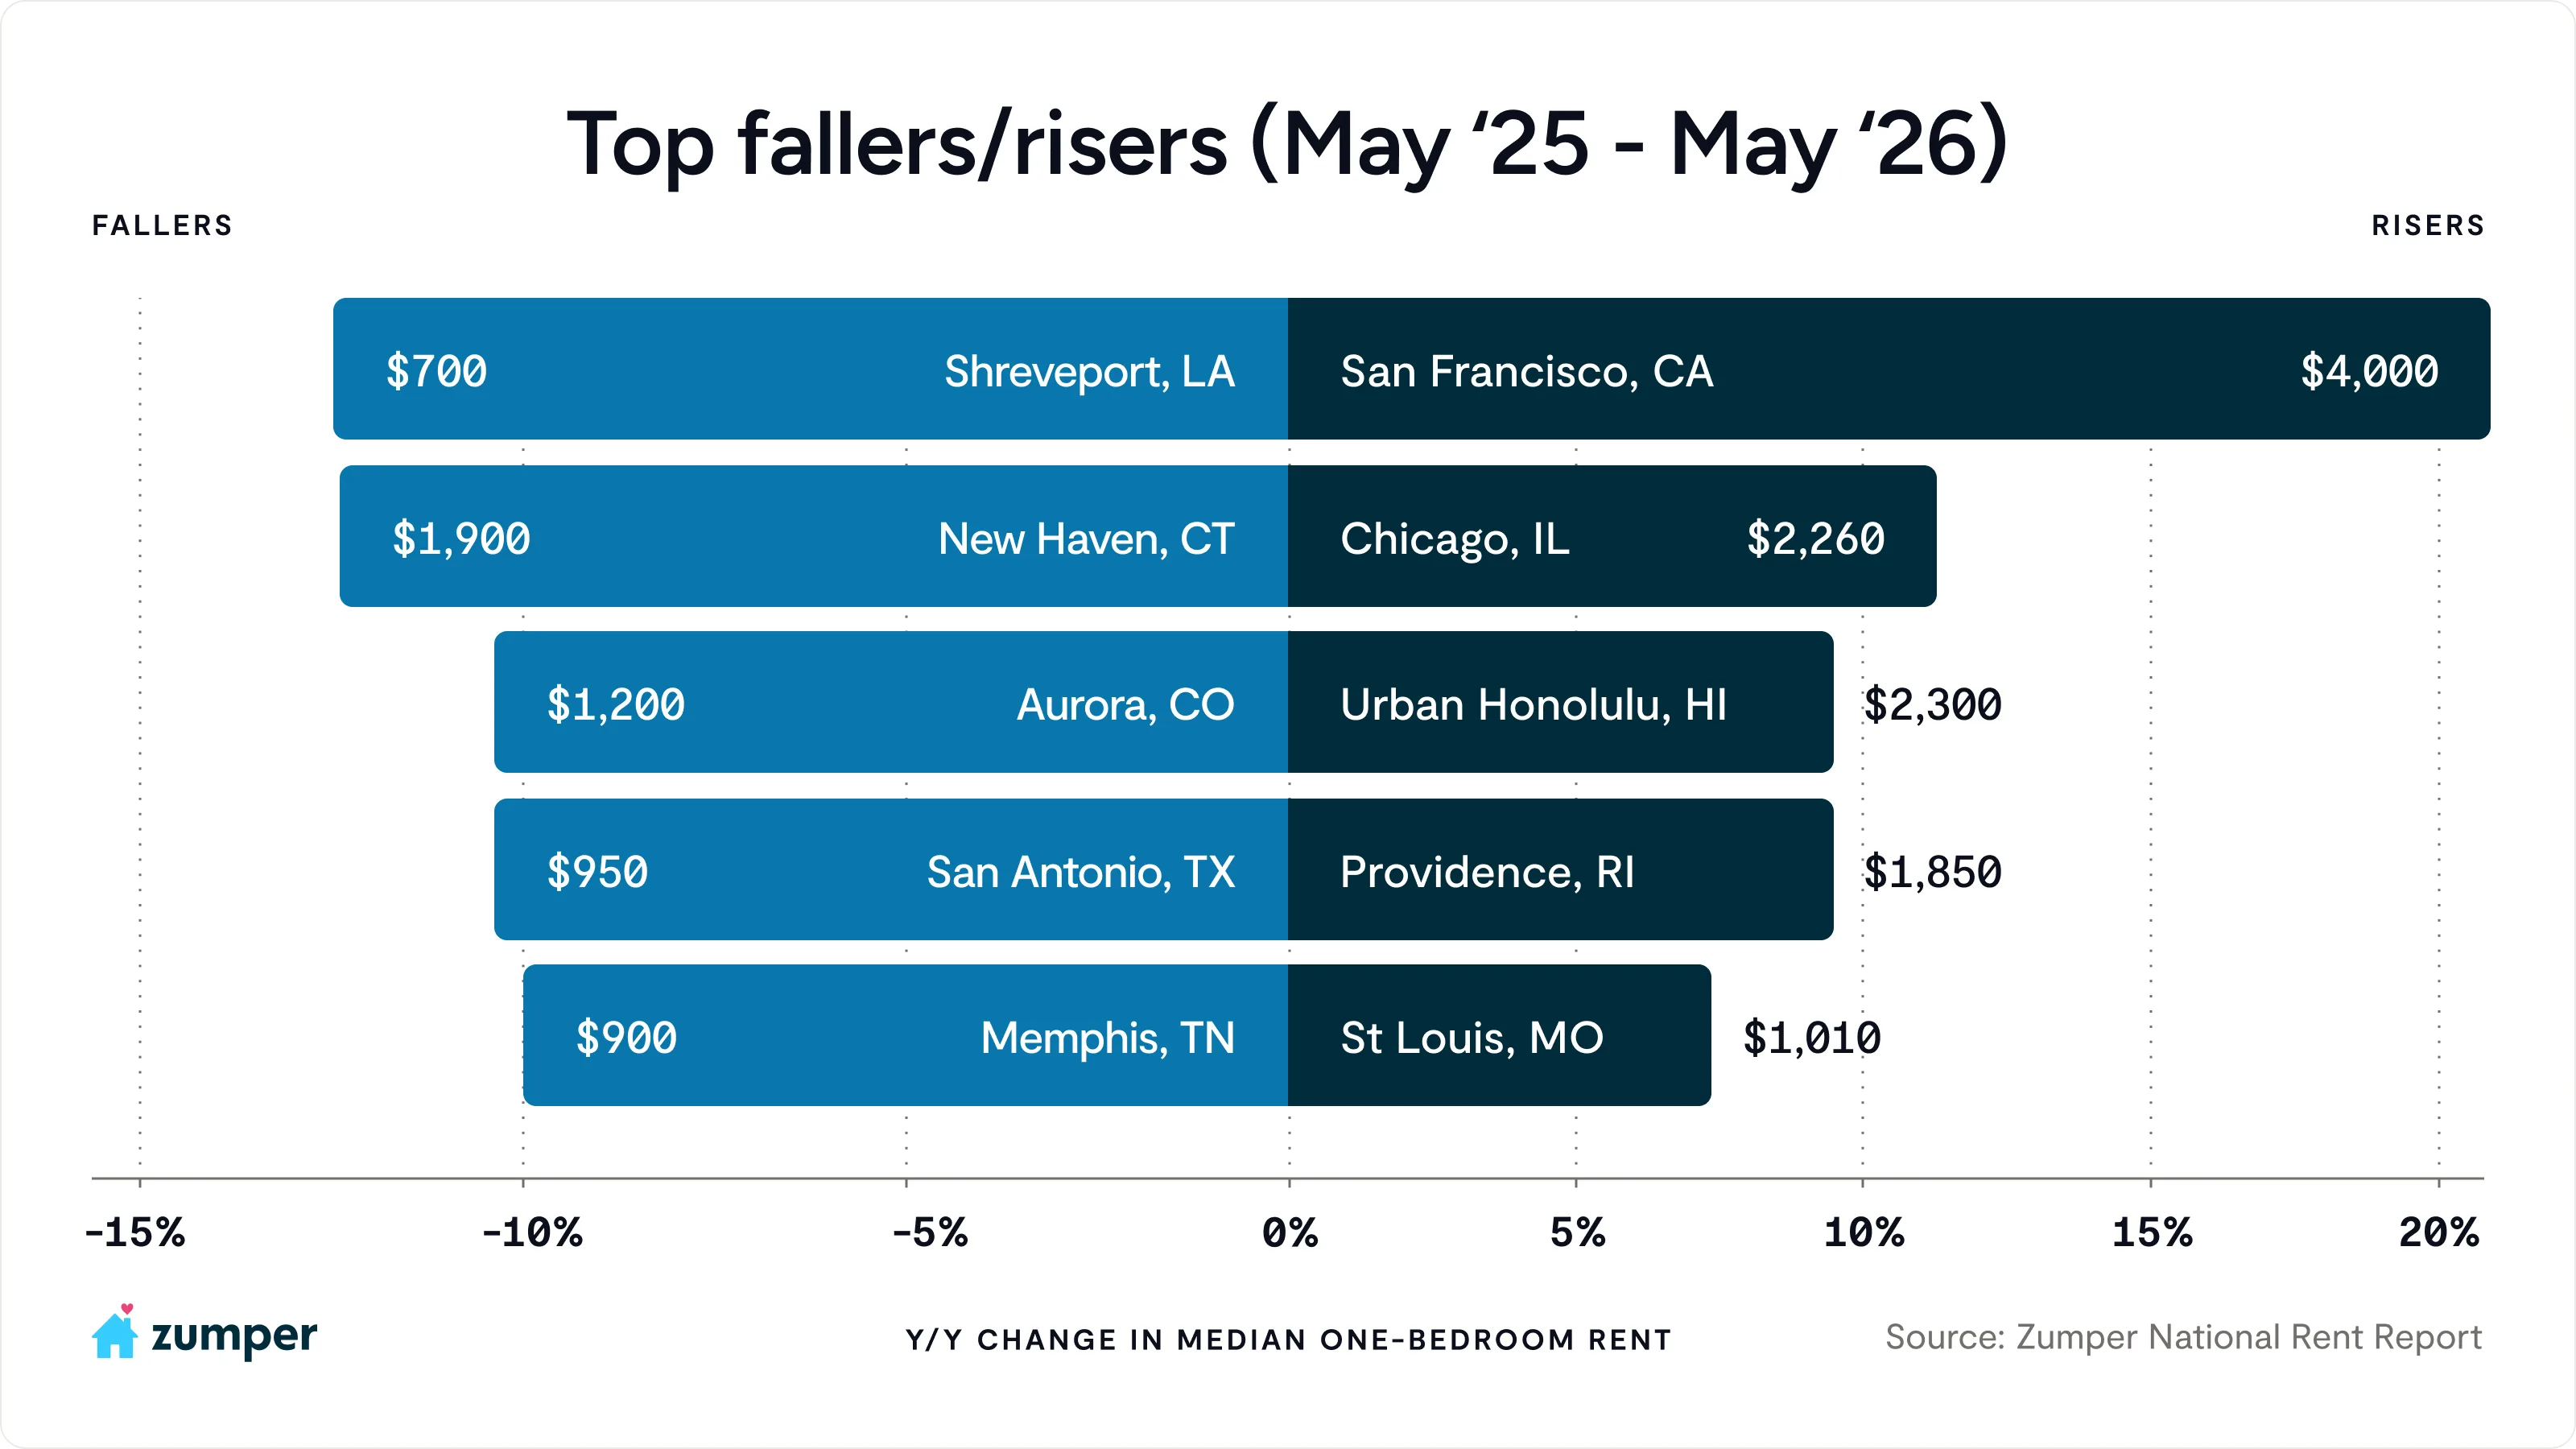
- San Francisco keeps breaking its own records: one-bedroom rent crossed $4,000 for the first time in city history, and SF now leads the nation in annual rent growth at over 21%.
- Texas keeps softening: nearly every Texas market in our report posted declining annual one-bedroom rent, led by San Antonio at -10.4%.
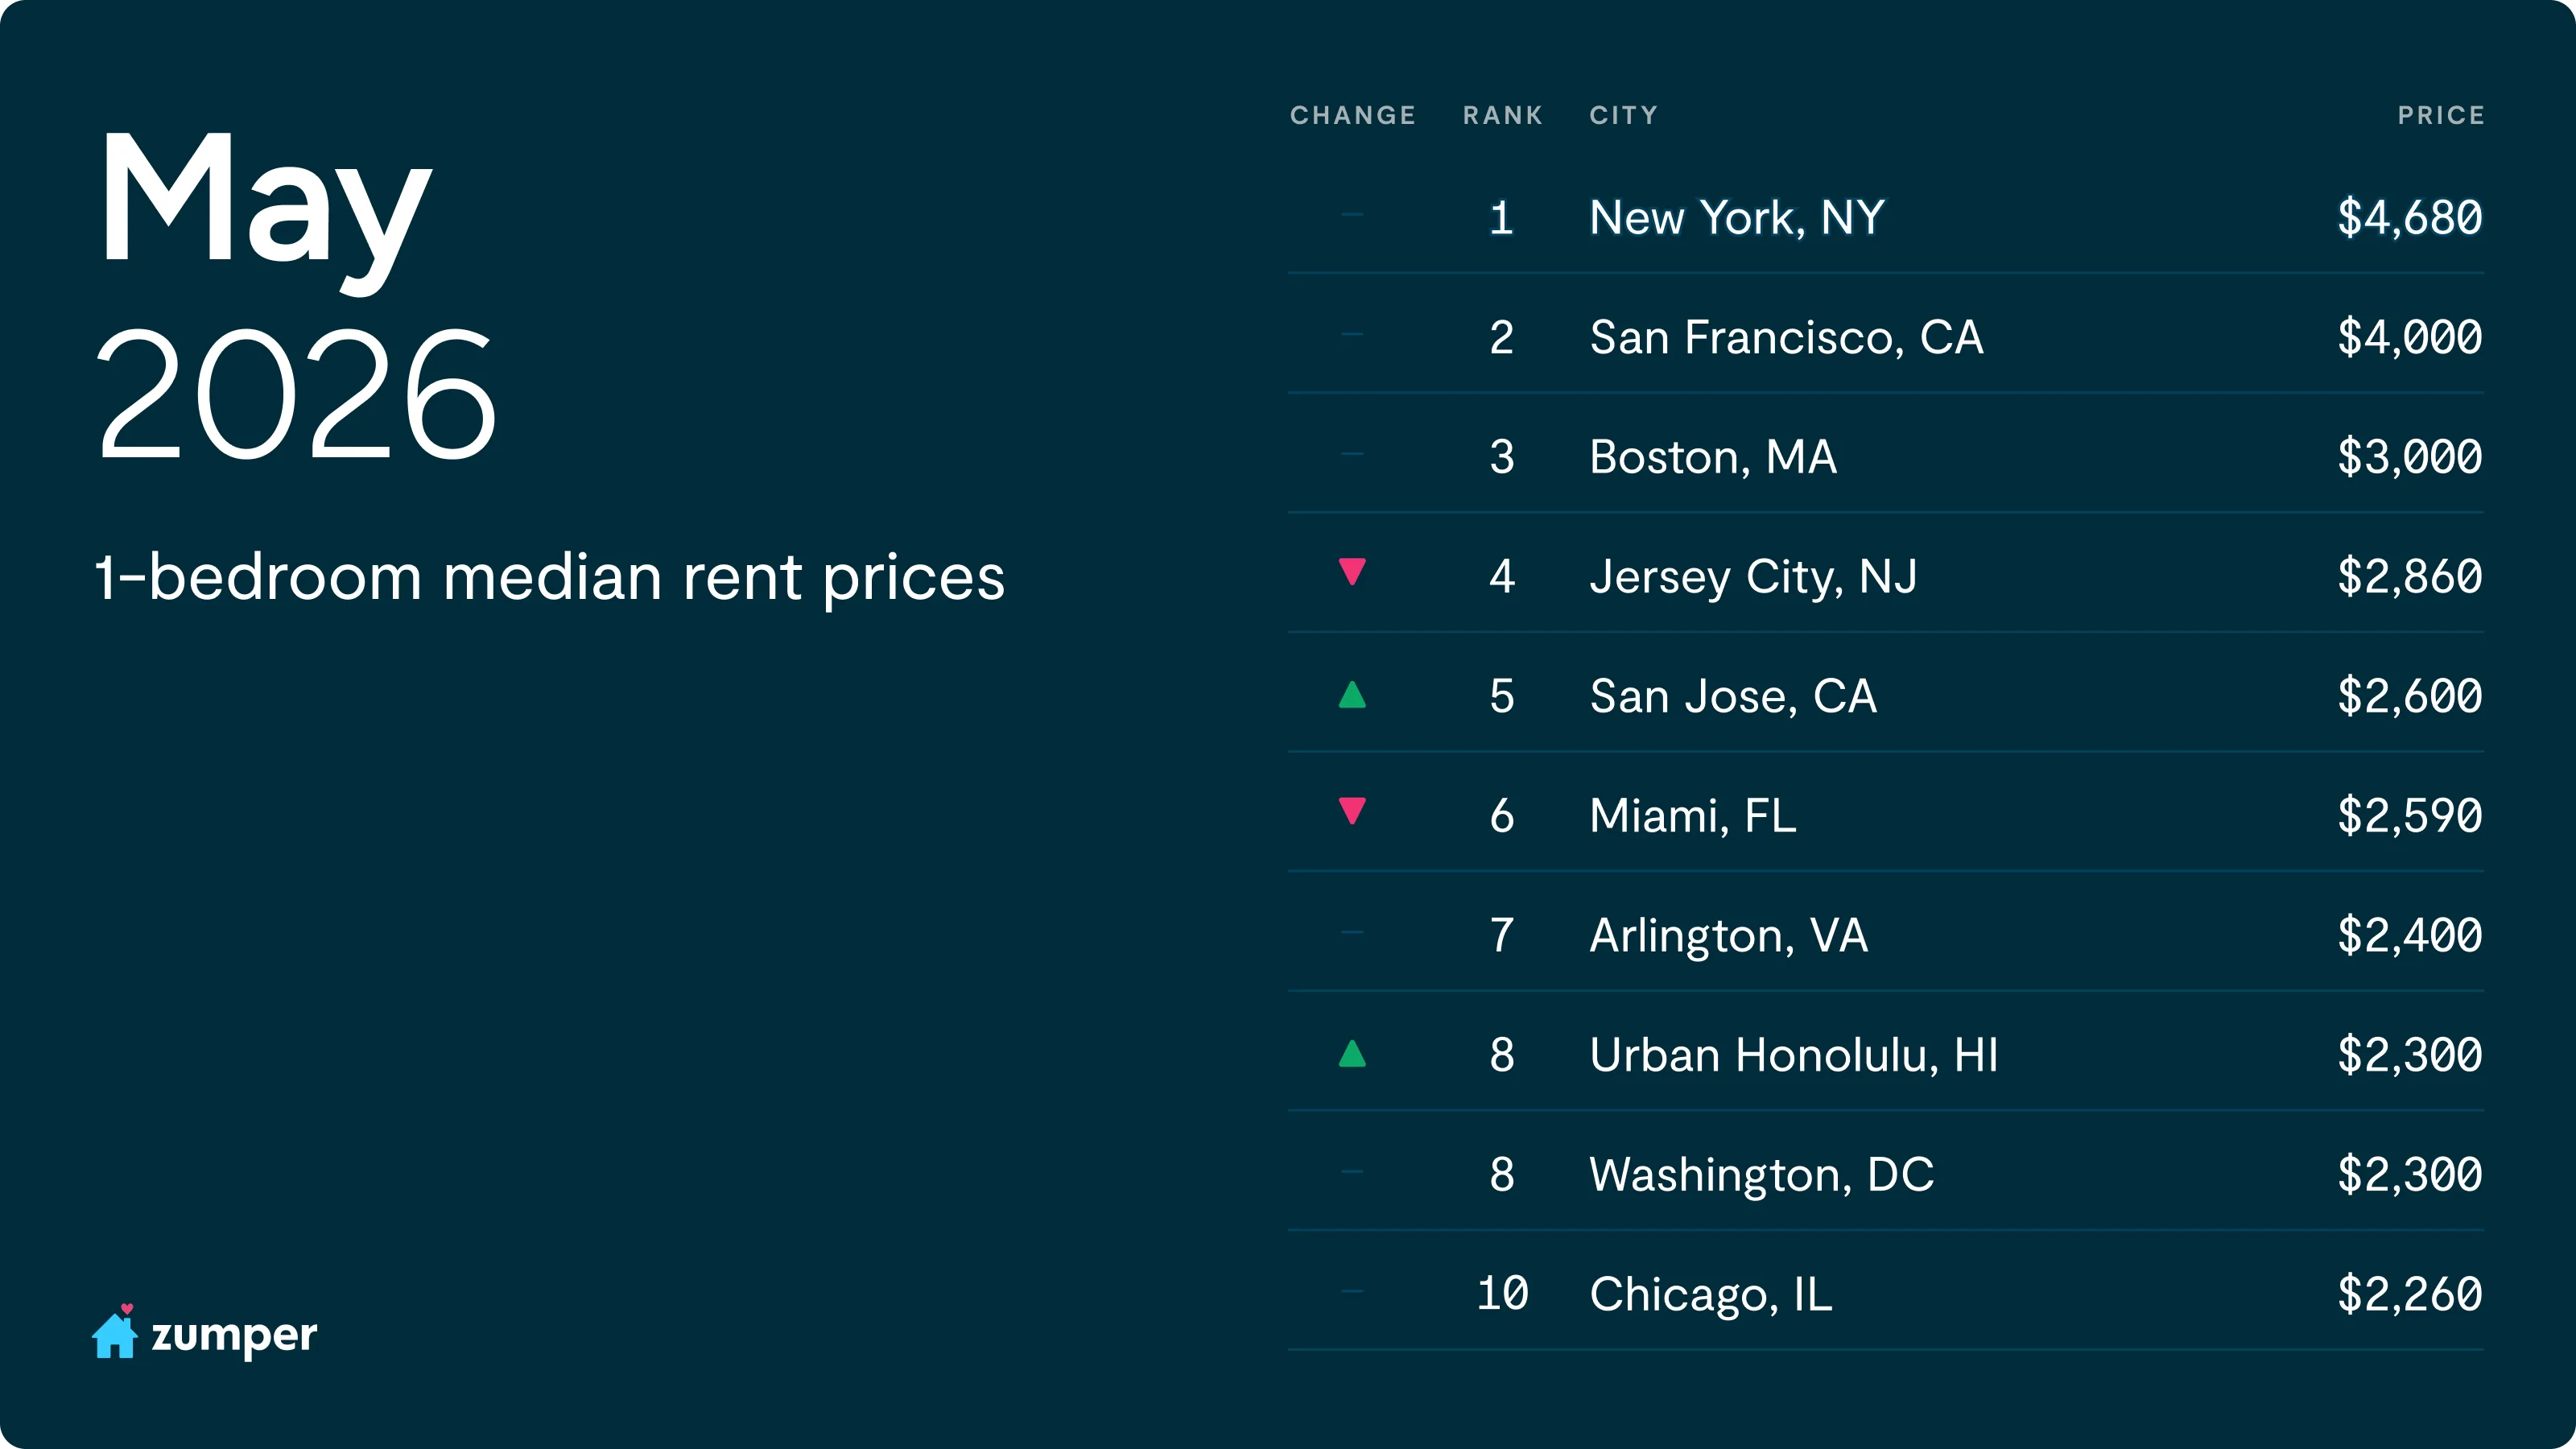
The two cities at the top of the market are pulling away from the rest. New York and San Francisco are now tied at $5,500 on two-bedrooms and on one-bedrooms, NYC’s $4,680 and SF’s $4,000 sit more than $1,600 above third-place Boston ($3,000). The gap between the top two and everyone else is staggeringly wide.
Just below them, San Jose climbed a spot into the top 5, bumping Miami down to sixth. At tenth, Chicago turned in the month’s quiet standout, with one-bedroom rent up 11.3% annually, the steepest growth of any market in the top 10 except San Francisco.
National rents pull even with a year ago
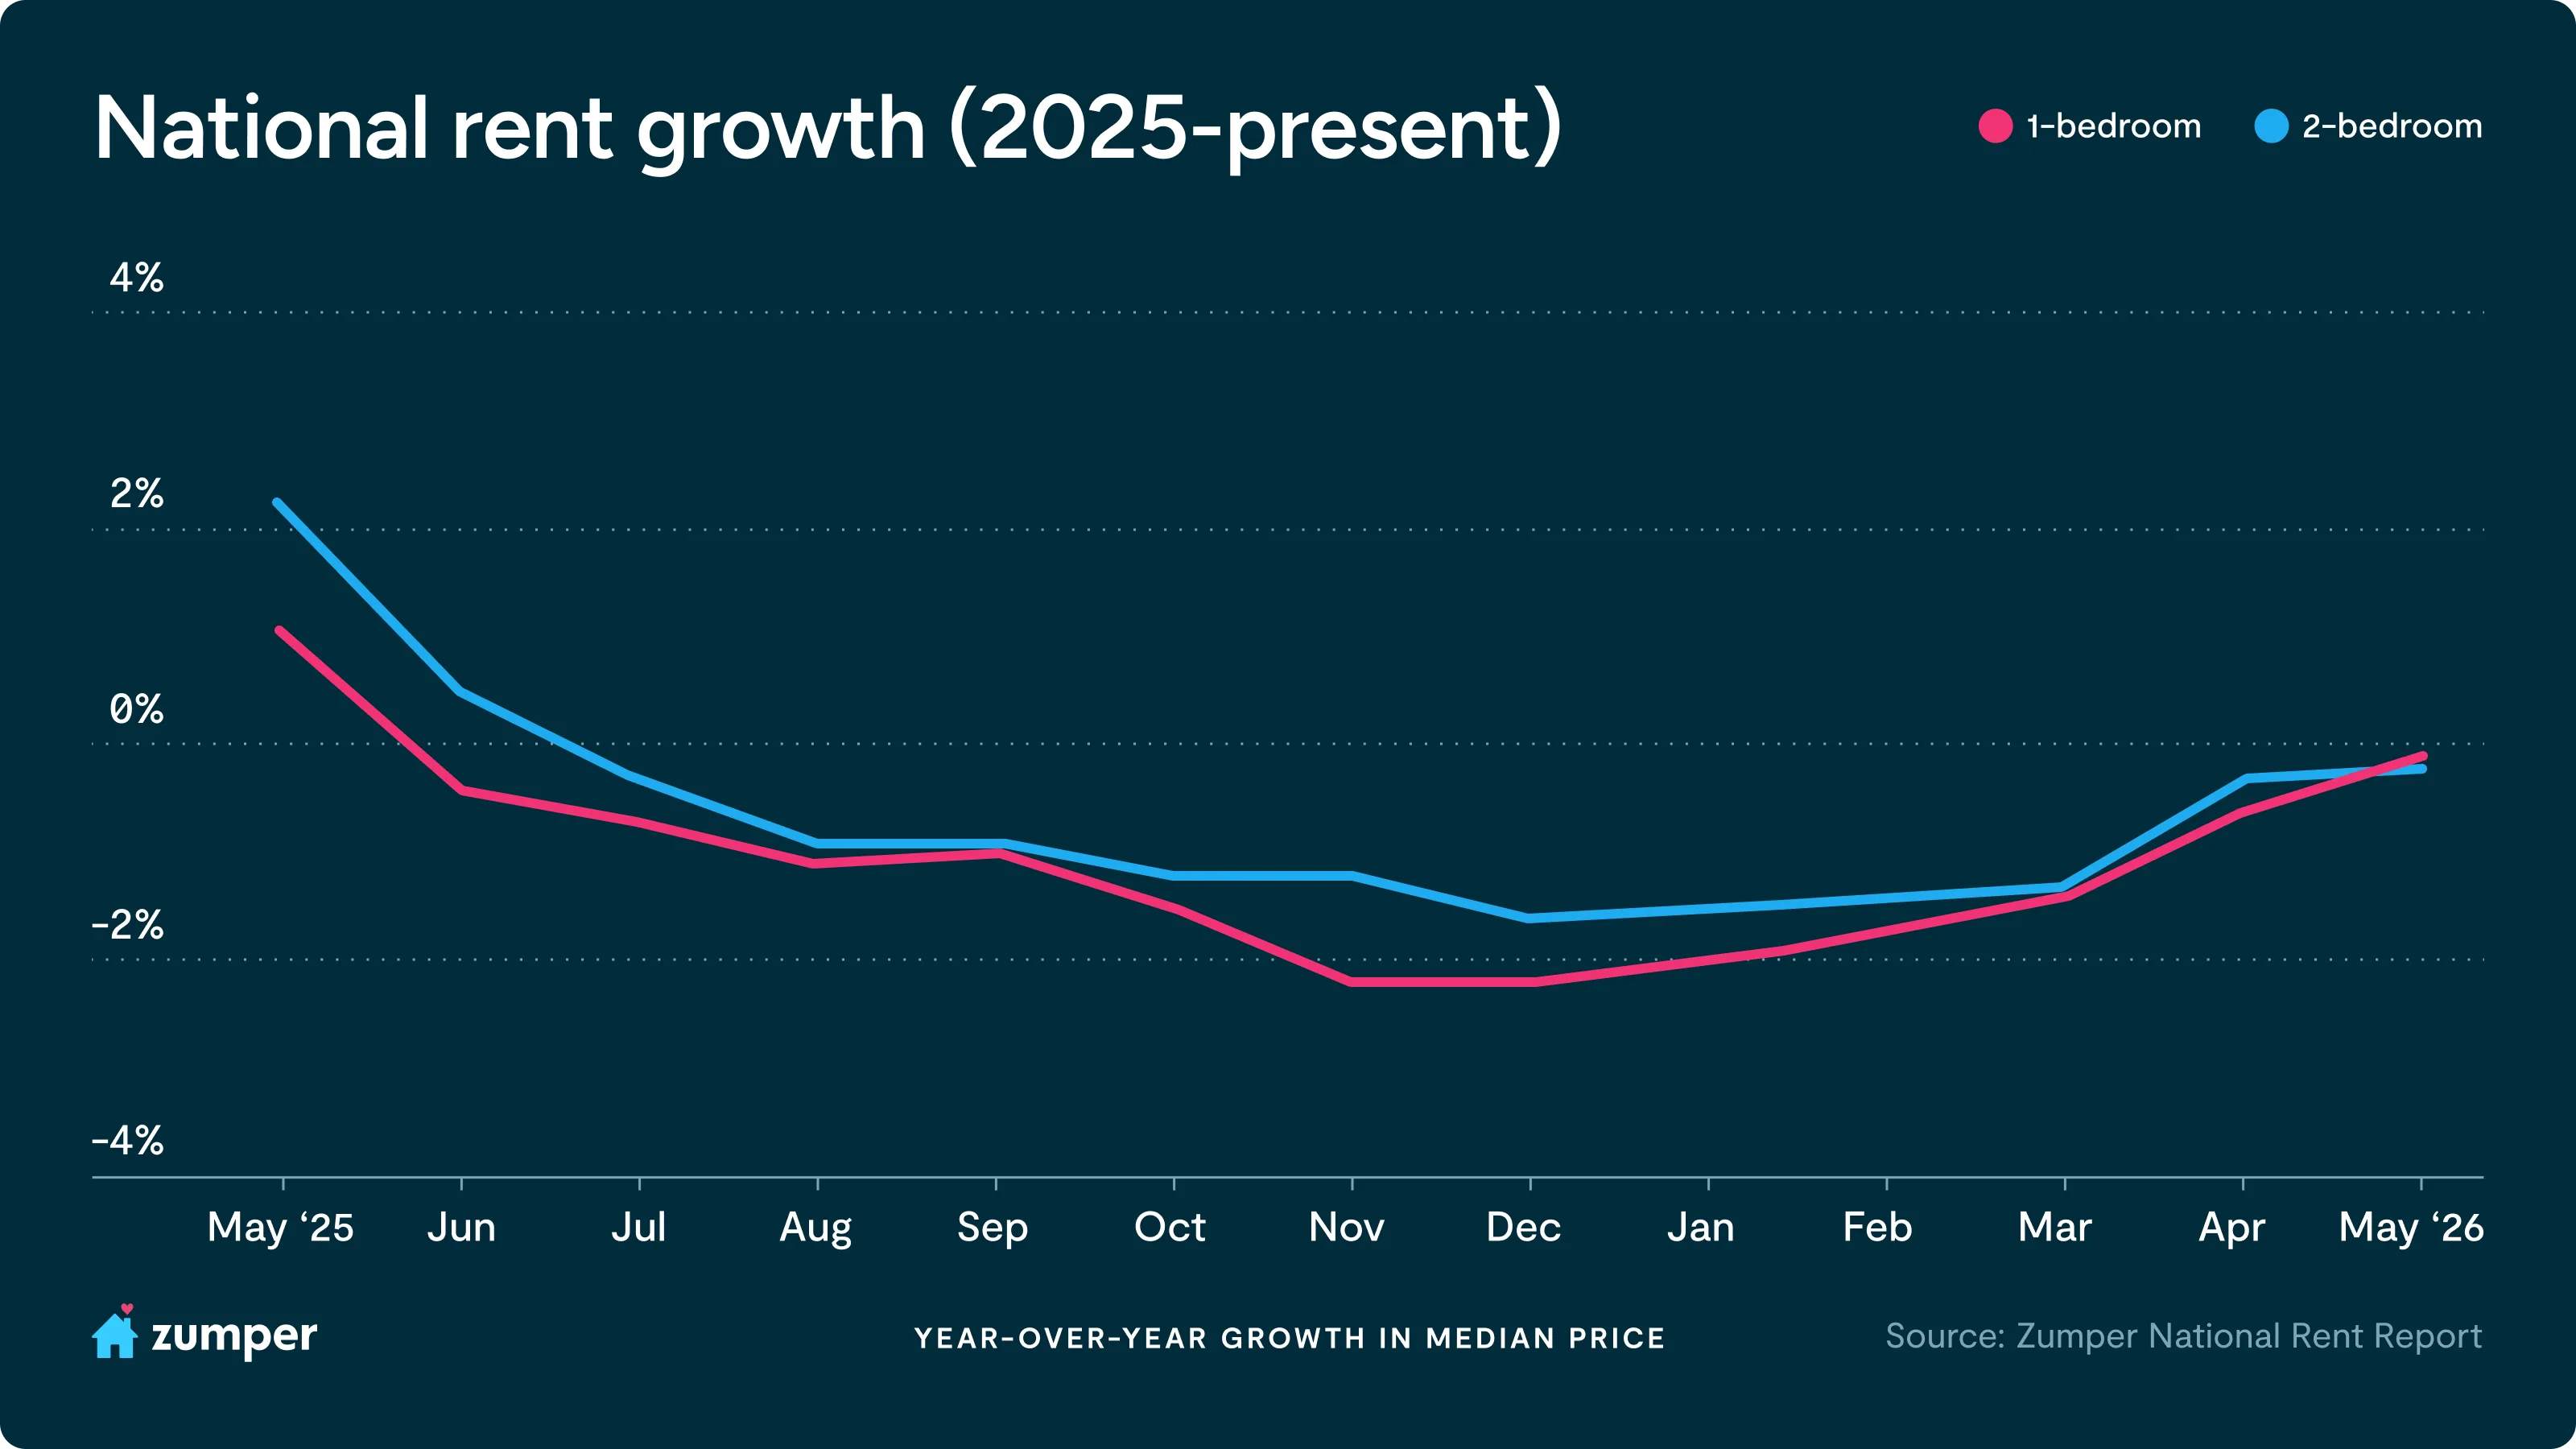
The Zumper National Rent Index showed that the median one-bedroom rent rose 0.7% month-over-month to $1,519, while two-bedroom rent increased 0.4% to $1,903. On an annual basis, one and two-bedroom rents are down just 0.1% and 0.2%, respectively.
May marks the fifth consecutive month of decelerating annual declines. The recovery has been steady, and it’s picking up speed. Annual one-bedroom declines have narrowed every month since bottoming out at -2.2% last November, moving to -2% in January, -1.7% in February, -1.5% in March, and -0.6% in April before reaching essentially flat in May. Two-bedroom rents have followed the same path. The April-to-May move is the most telling of the streak: one-bedroom rent went from down 0.6% annually to down just 0.1% in a single month. National rents are now essentially the same price as they were a year ago.
The month-over-month picture points the same direction. The 0.7% jump in one-bedroom rent is the strongest single-month gain since spring 2025, a sign that the spring leasing season is pulling prices up the way it historically has, after two years of unusually muted seasonal demand. Even so, the median one-bedroom rent of $1,519 remains below where it sat a year ago and shy of its early-2025 peak, so renters aren’t yet feeling a true reversal.
“National averages are masking two very different housing markets right now,” explains Shawn Mullahy, CEO of Zumper. “In supply-constrained coastal cities, pricing power has returned quickly. Across much of the Sun Belt, operators are still working through the inventory wave delivered over the last several years. Demand is there, but supply still needs time to normalize.”
The latest CPI data tells the same story with a lag: the shelter index rose 3.3% annually last month, still the single largest driver of overall inflation even as market rents have flattened. That gap is exactly why Zumper’s real-time rent data offers an early signal into where the CPI may be headed. For a deeper look, read our full analysis: https://www.zumper.com/blog/zumper-consumer-price-index/
NYC rent hits all-time high
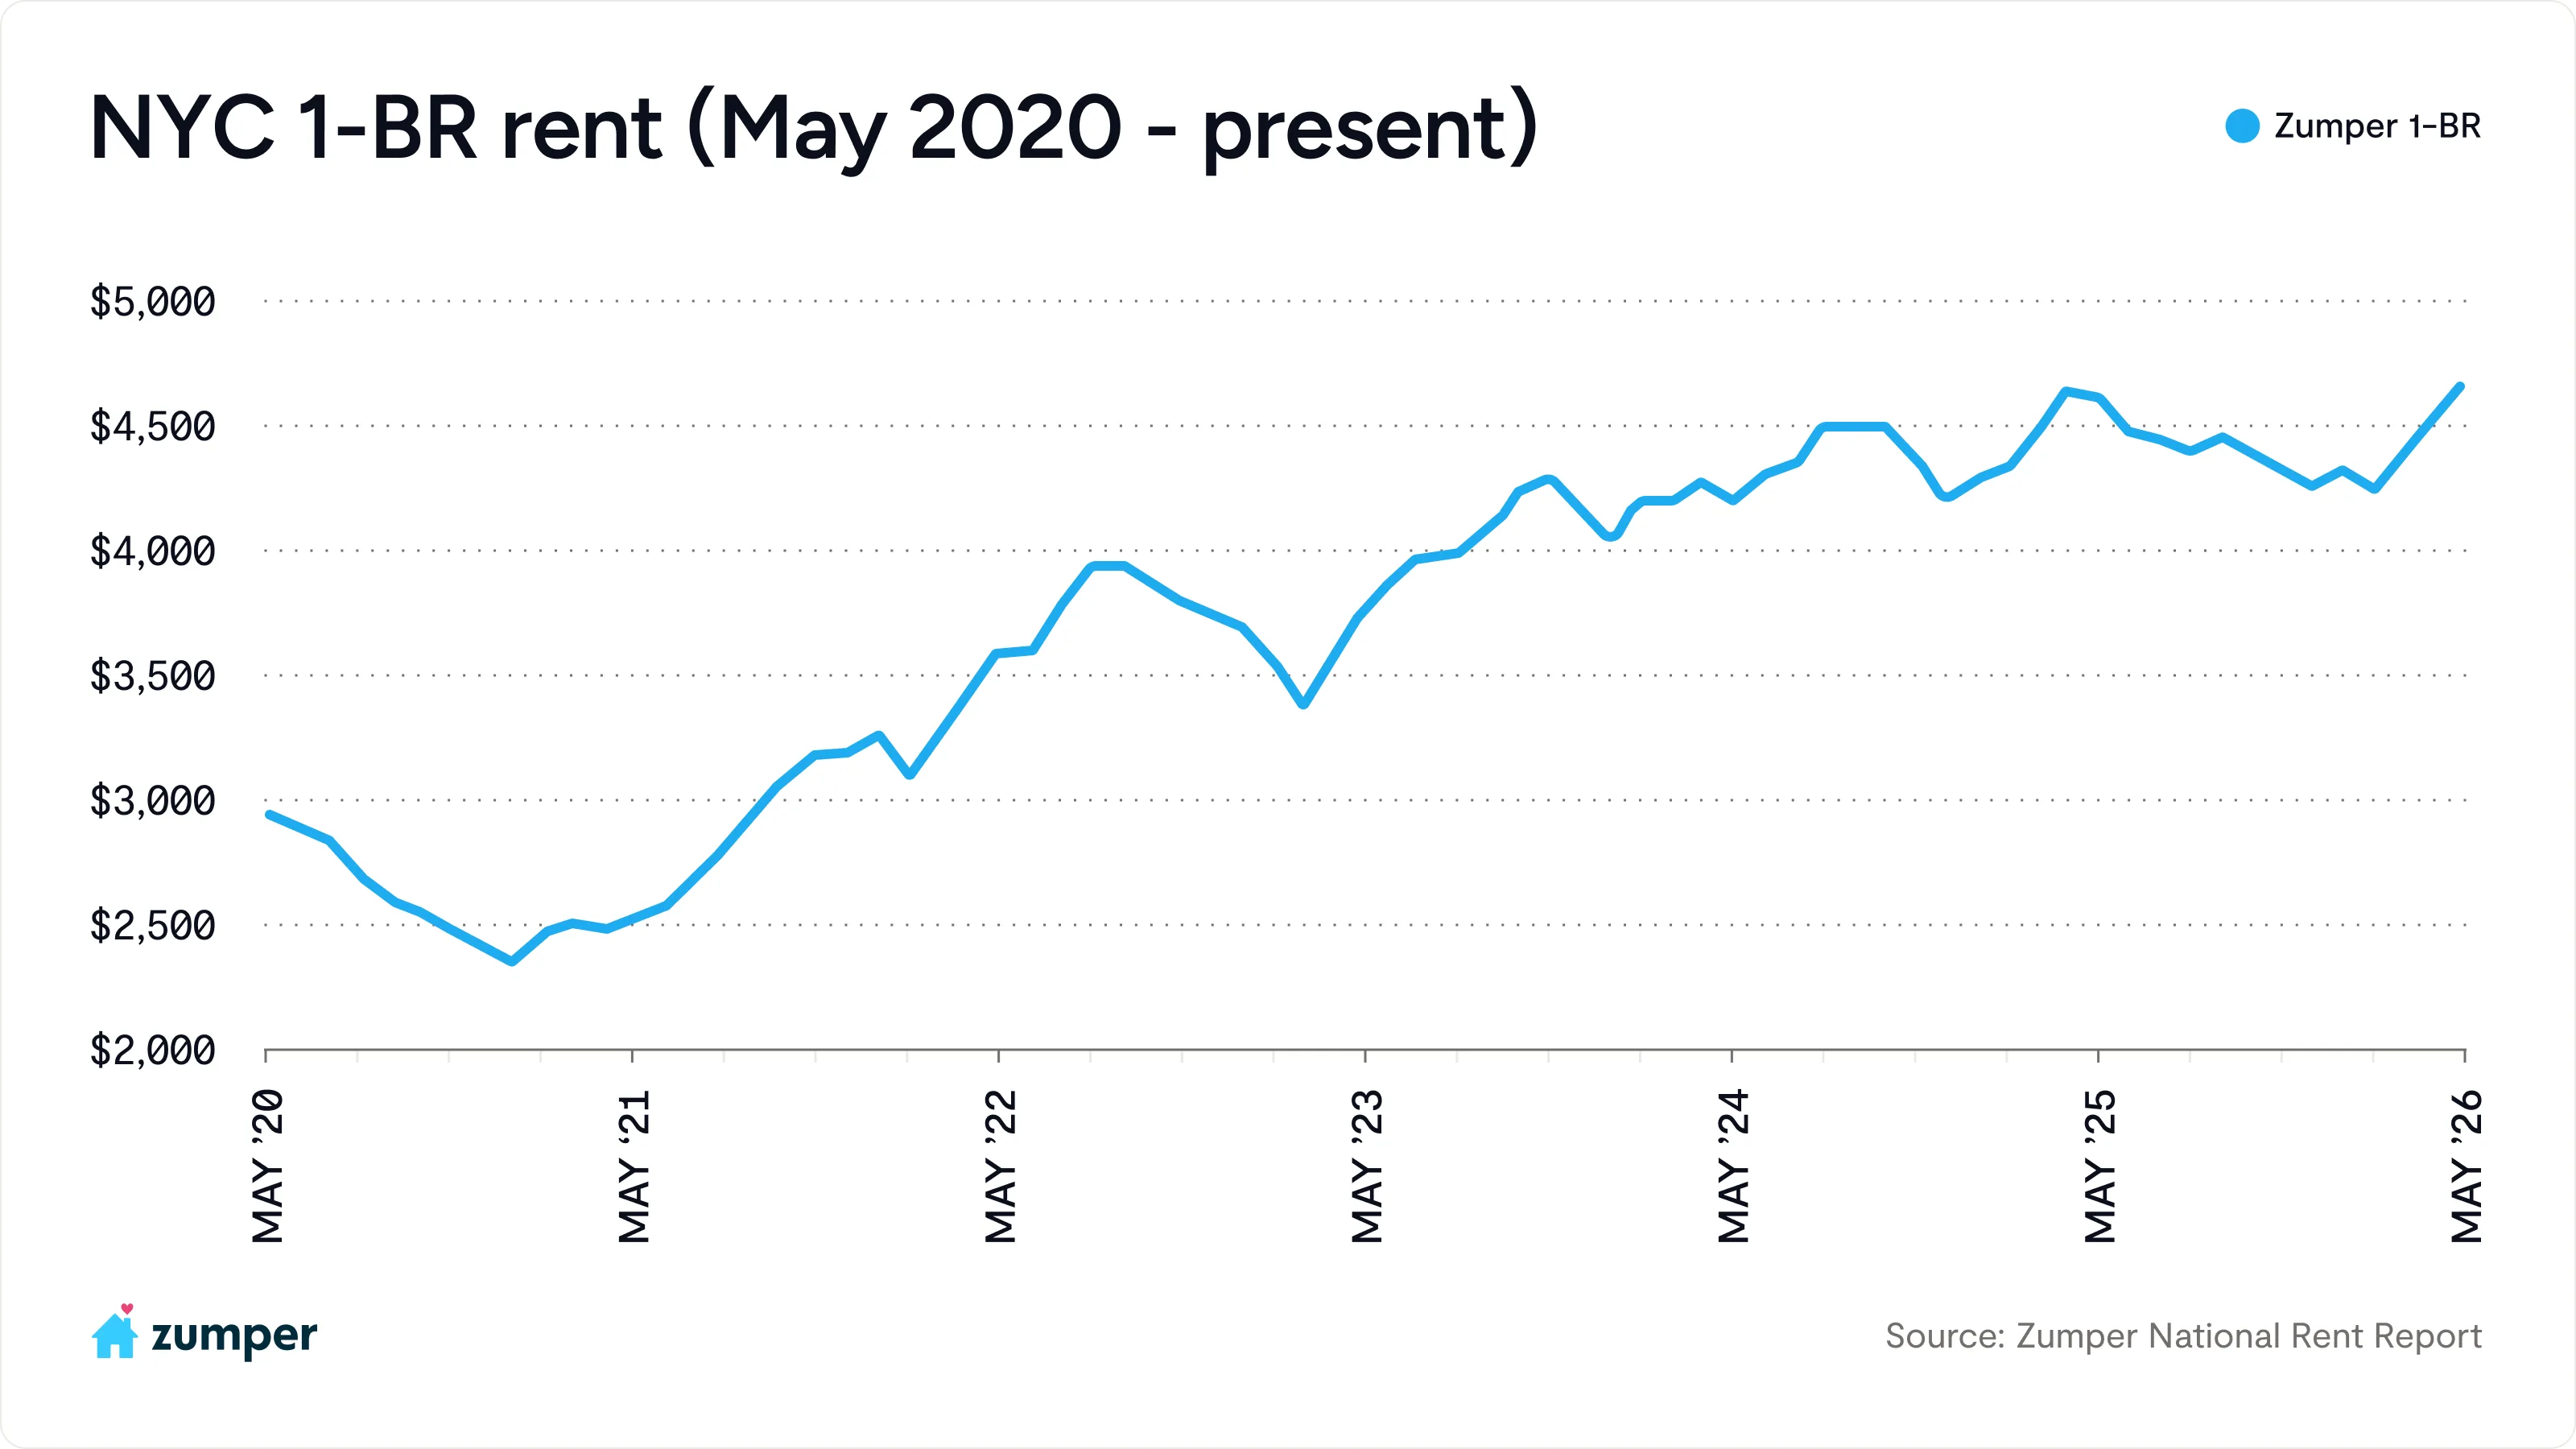
New York City one-bedroom rent reached an all-time high this May, climbing 3.1% month-over-month to $4,680, the most expensive one-bedroom figure in Zumper’s decade-plus of data.
The driver is a supply story that has been building for years. Manhattan has largely sat out of the city’s rental construction boom, with developers favoring condos over rental buildings, and inventory has fallen for one of the longest stretches on record. Manhattan vacancy is currently anchored below 2%, and available units are leasing at their fastest pace in months. Other boroughs are feeling intense demand as well, albeit to a lesser extent.
That squeeze has produced a striking side effect: New Yorkers simply aren’t moving. Nearly 90% of New York City renters stayed in the same unit they occupied a year earlier, which is far above the national average. With asking rents at record highs, the gap between what a sitting tenant pays and what the open market charges has rarely been wider, turning a move across town into a major financial decision. For anyone searching in this market, leverage comes from being ready to move fast on the right unit the moment it appears.
SF one-bedrooms reach $4,000 for the first time ever
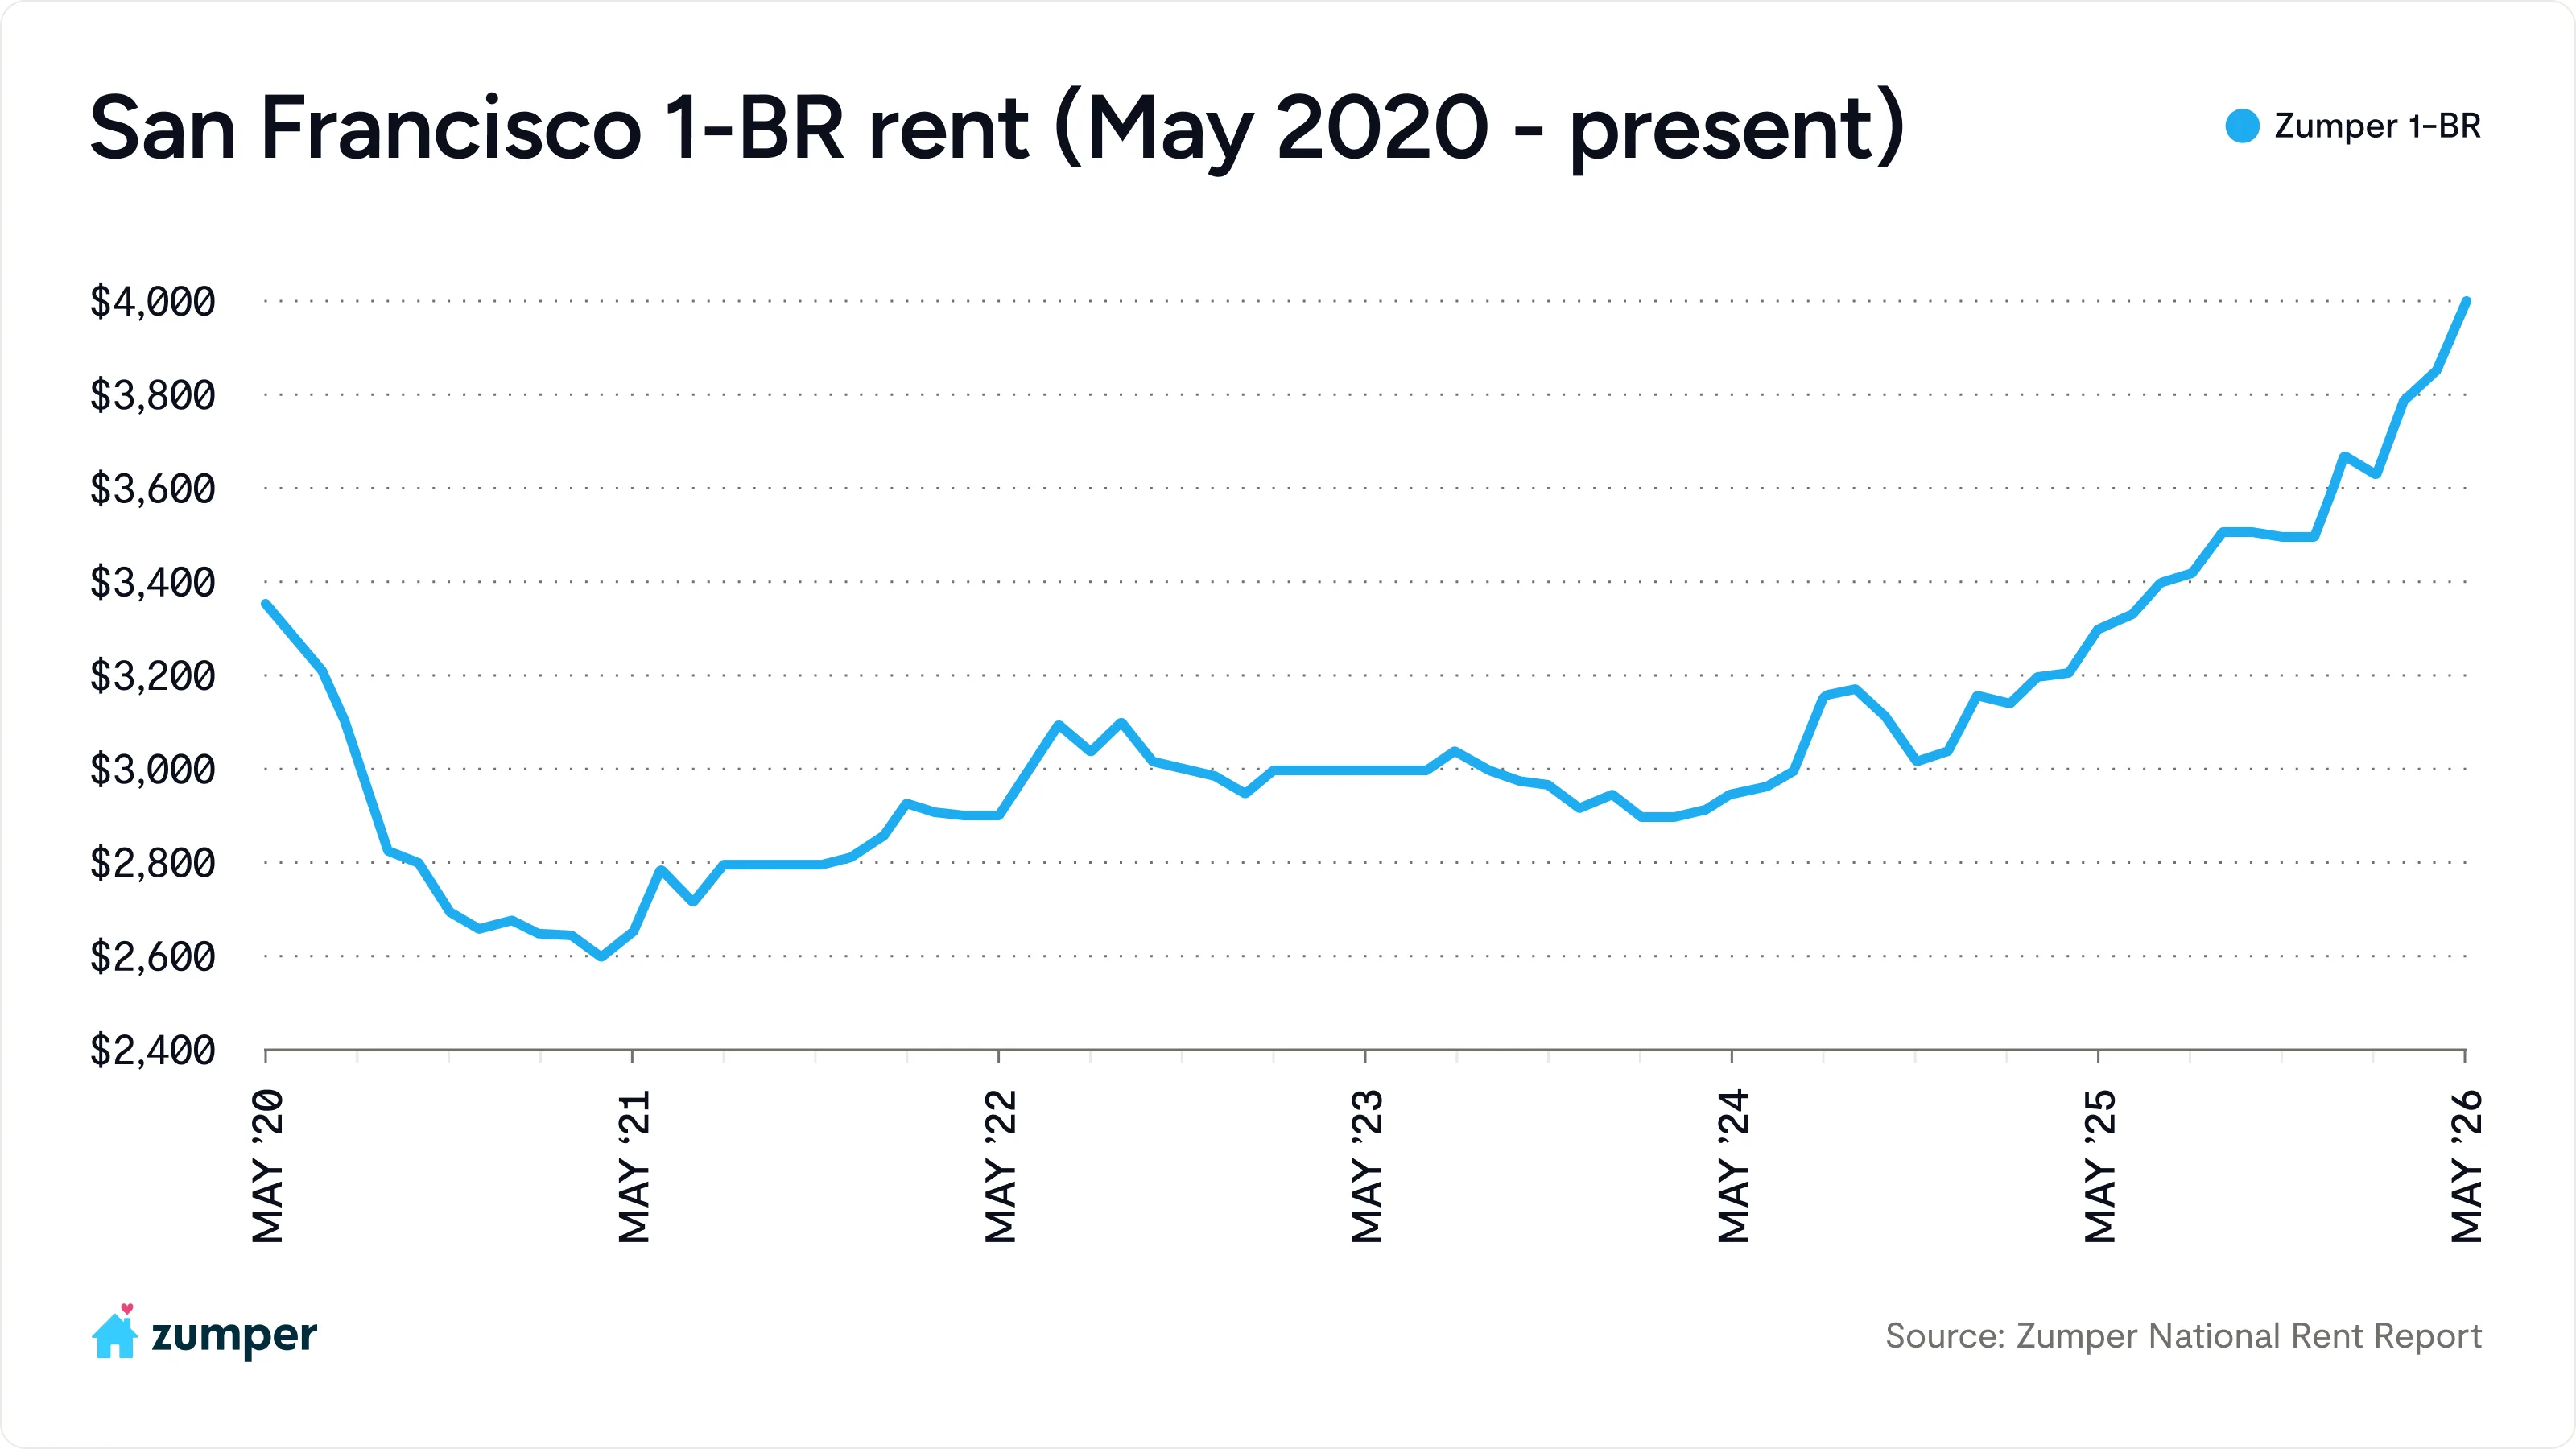
San Francisco keeps breaking its own records. One-bedroom rent crossed $4,000 for the first time in city history this month, and two-bedrooms reached $5,500, pulling even with New York City at the very top of the U.S. market. The city also leads the nation in annual rent growth for both bedroom types, up more than 21% year-over-year on one and two-beds alike. No other major market in the report comes close.
The surge has real fundamentals behind it. The rent acceleration tracks with what’s been visible on the ground for months: aggressive AI hiring across the city, persistently tight housing supply, and a return-to-office push that has refilled a downtown that sat half-empty for years. Broader economic signals point in the same direction with unemployment dipping, office vacancy receding, and job postings climbing. Demand in the city looks as strong as it has since before the pandemic.
Nearly all Texas cities had declining annual rent
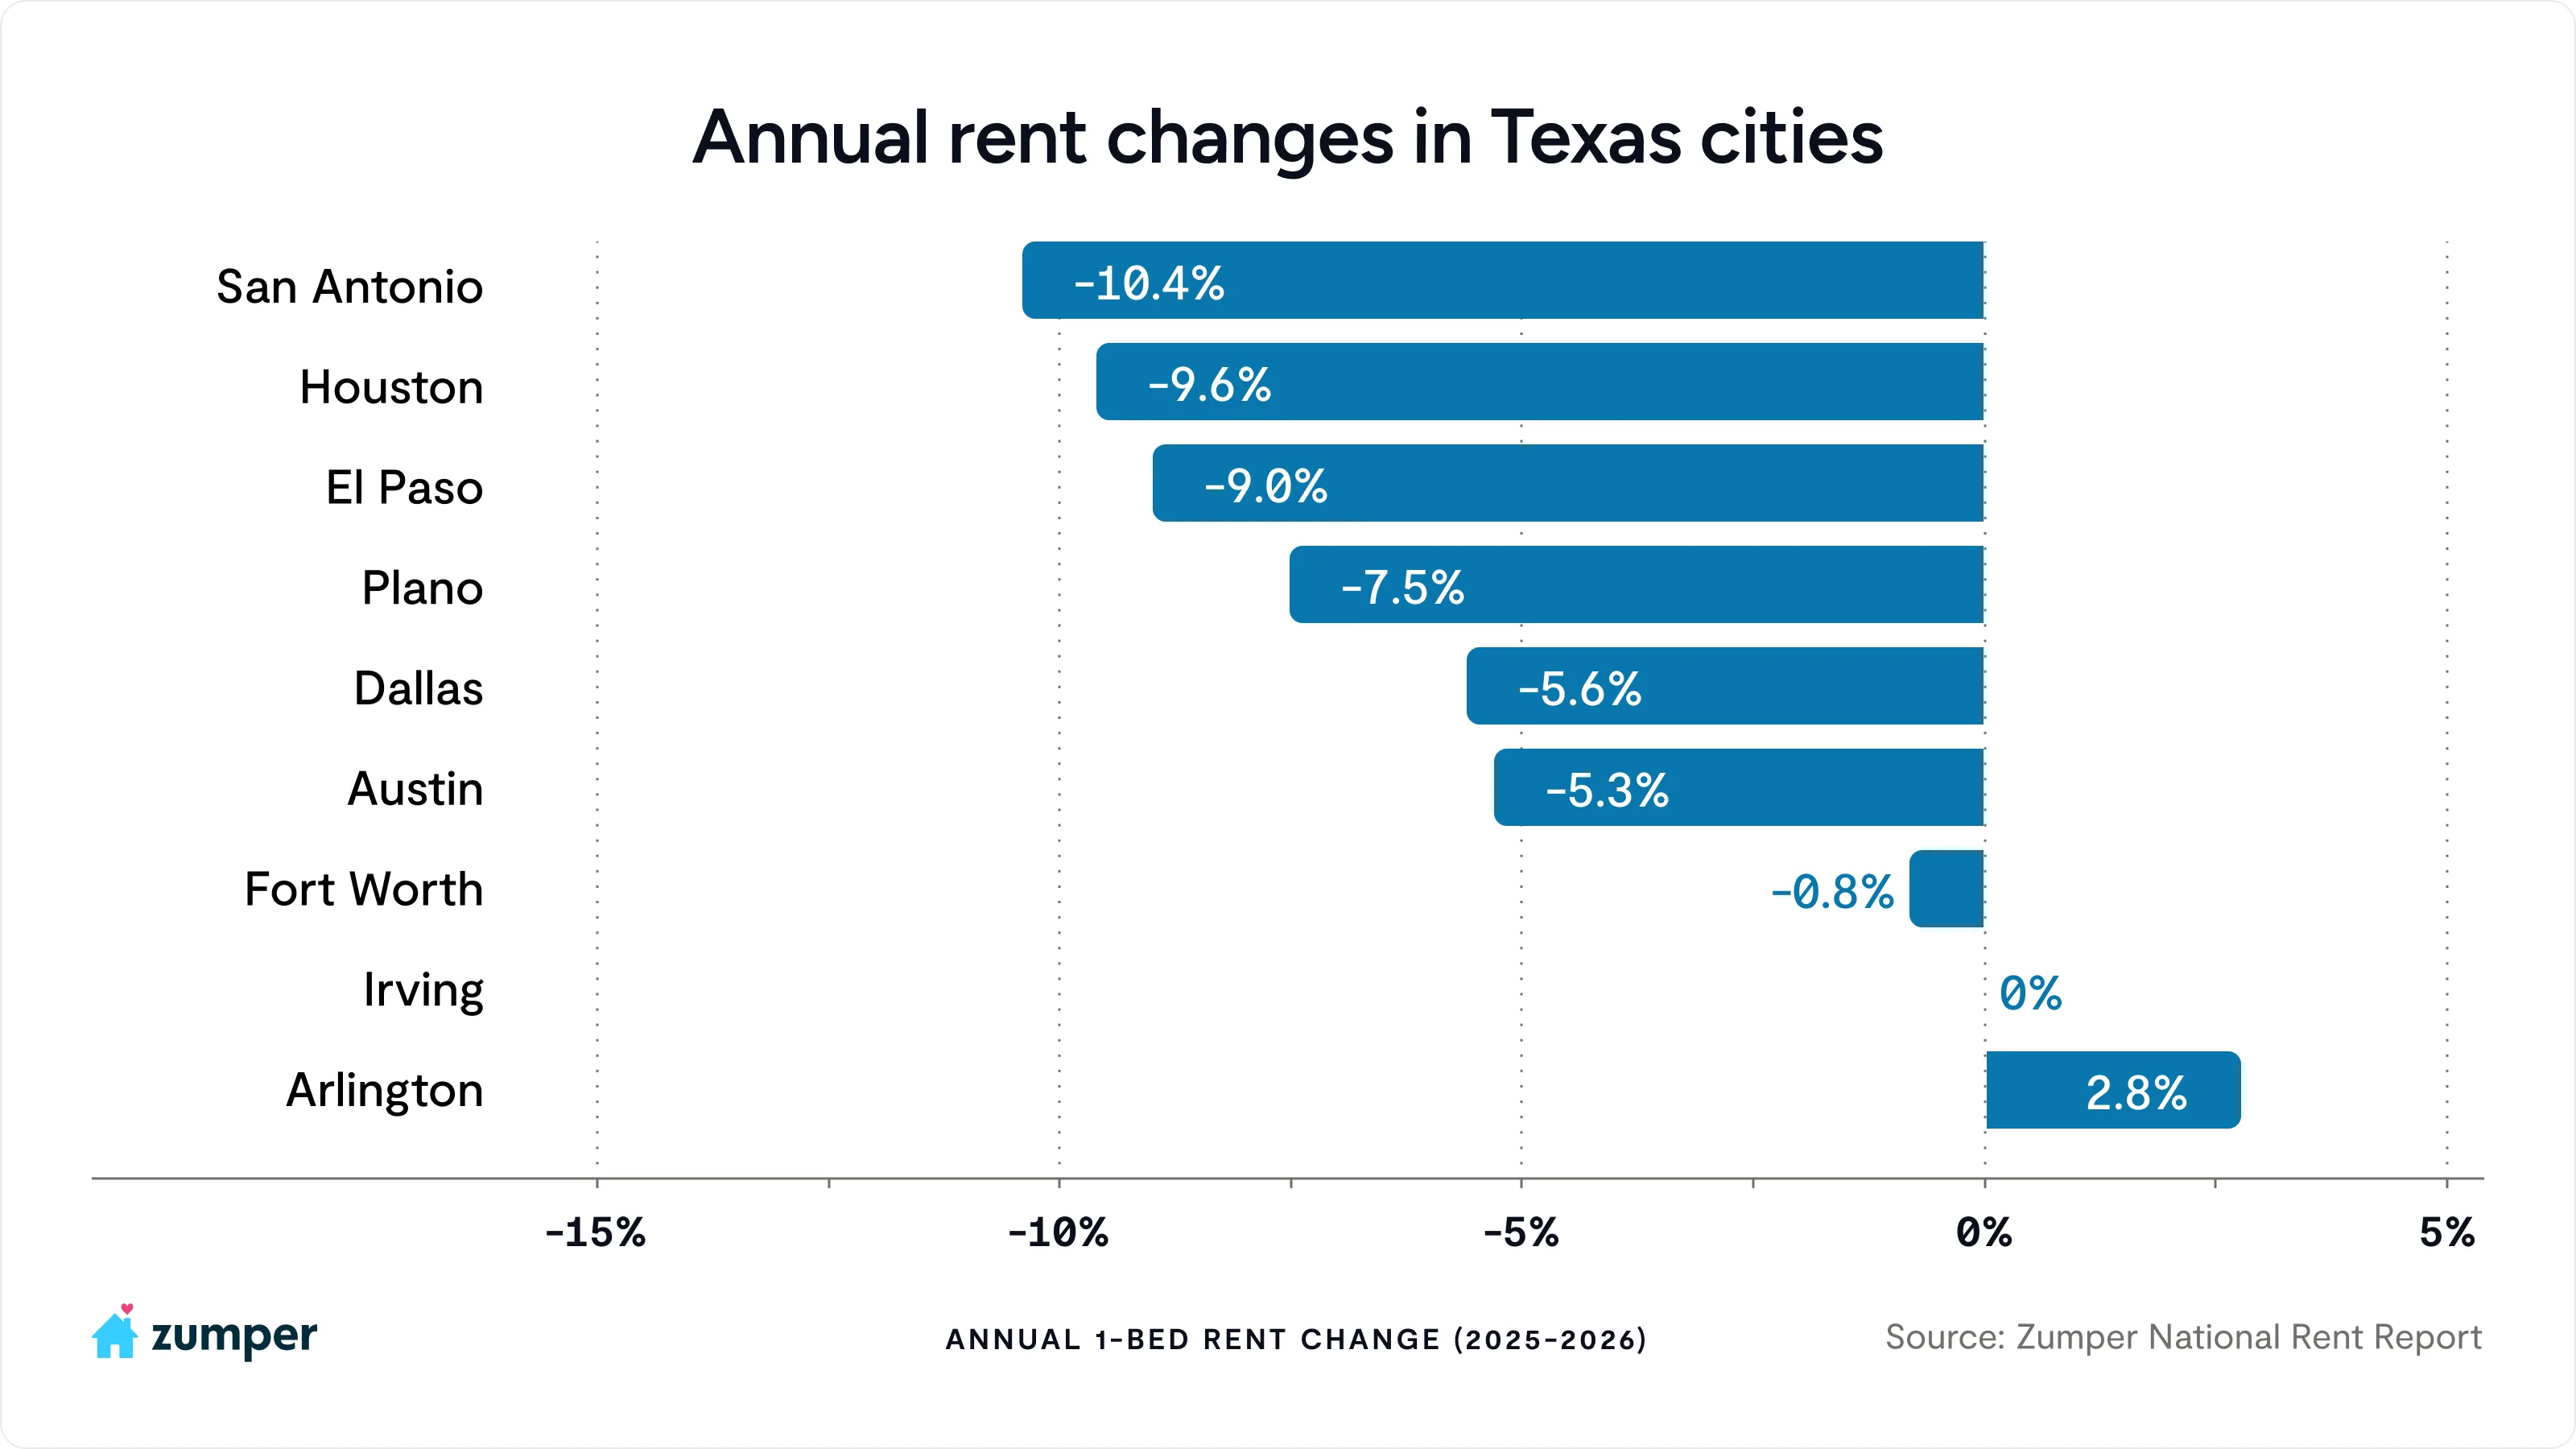
Between New York and San Francisco sits Texas, still one of the clearest soft-landing stories in the country. Nearly every Texas market in our report posted declining annual one-bedroom rent in May, with only Arlington holding positive year-over-year territory.
San Antonio leads the declines at -10.4% annually, the steepest drop of any Texas market in our top 100 cities. Houston isn’t far behind at -9.6%, while Dallas fell 5.6%. Even Austin, the long-running poster child for the Sun Belt supply story, continues to soften, with one-bedroom rent down 5.3% year-over-year.
The concessions tell the same story. Of the 10 metros offering the most concessions nationwide, four are in Texas. The Austin metro led the country, with more than a third of units dangling incentives to fill space, followed by San Antonio, Houston, and Dallas. But here’s the tension: four of the 10 metros with the largest population gains were also in Texas. The same markets cutting rent to compete are the ones people keep moving to.
So while Texas absorbed a significant share of the 2023-2025 supply wave, inventory still has to lease up before landlords regain pricing power, and the steady inflow of new residents says the demand is there. It’s just a question of when supply stops outrunning it.
Words by