Canada’s rental market firmed modestly in September as the national one-bedroom index edged up with its largest monthly gain of 2026. The move nudged the annual decline for one-bedrooms to its narrowest in twenty months, but it was neither broad nor obviously durable. Beneath the headline were much more volatile local markets.
Movement in the top 10 cities
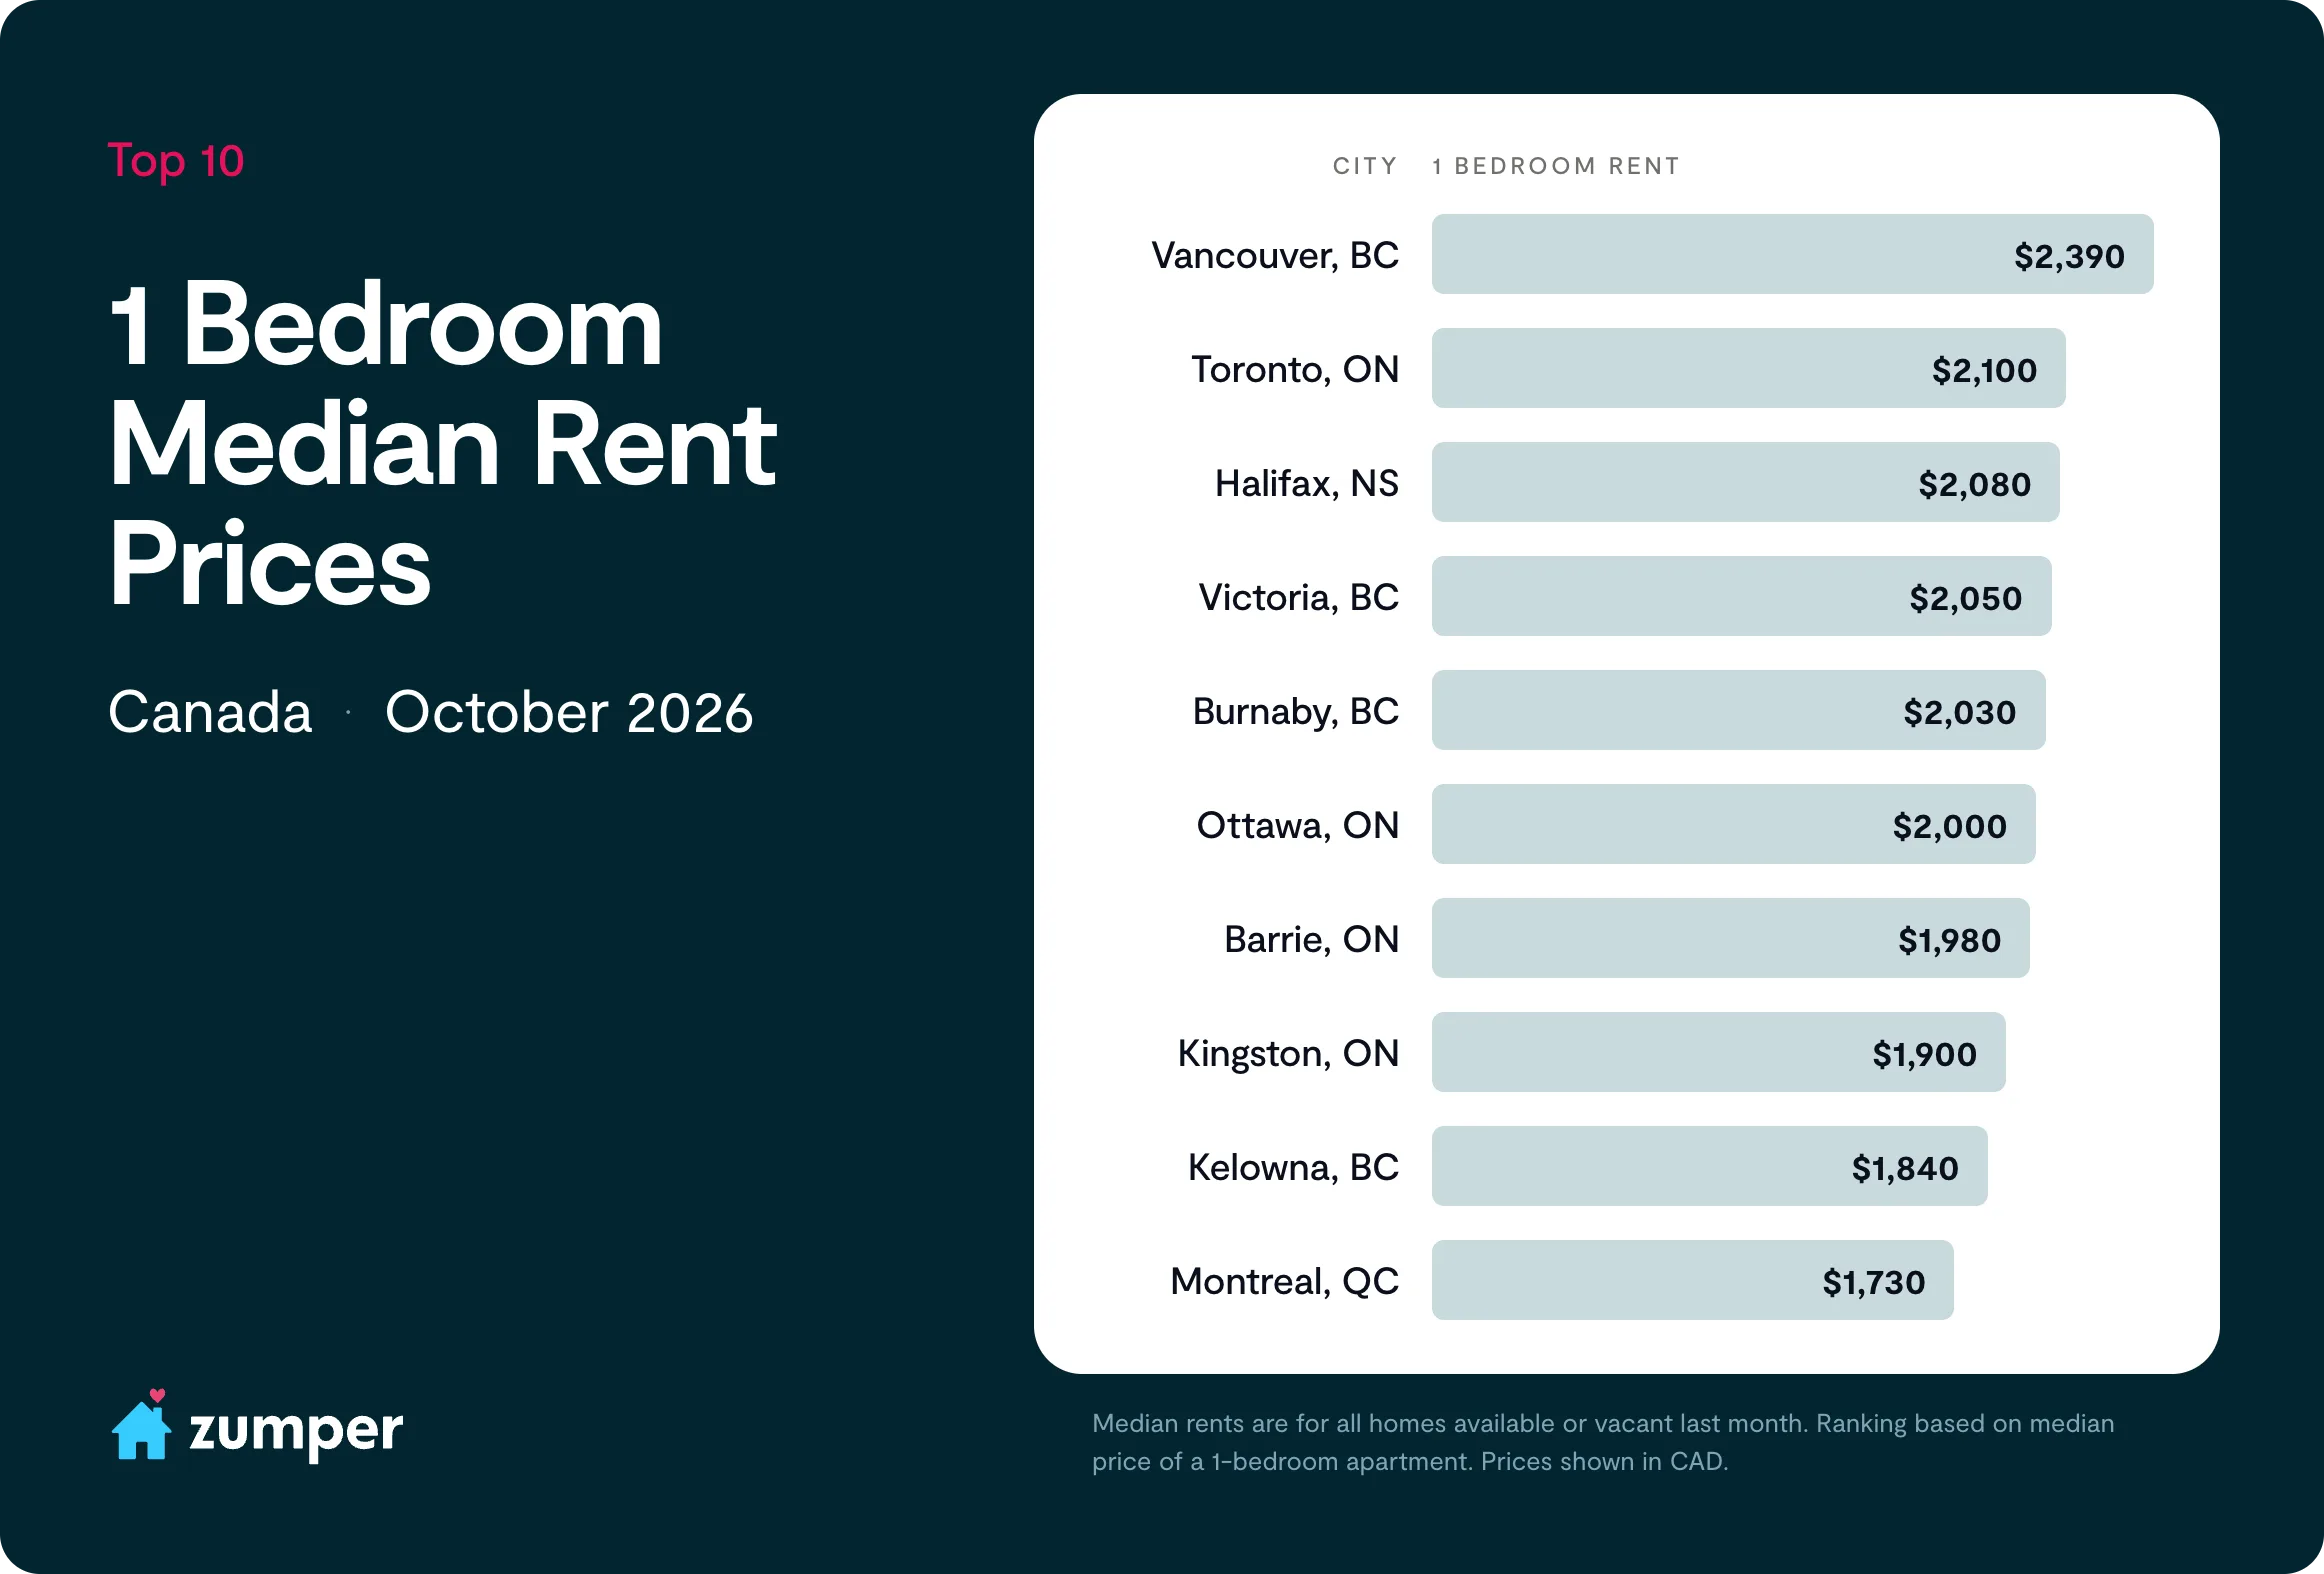
The top of the table reshuffled around a single drop. Vancouver held #1 at $2,390 despite a flat month, but most of the movement below it traced back to Burnaby’s steep decline.
Toronto climbs back to #2. A rank gain despite a 0.5% monthly dip to $2,100. Toronto rose because the markets around it fell faster.
Halifax and Victoria climb to #3 and #4. Halifax eased 1% to $2,080 but gained a spot, while Victoria jumped 3% to $2,050, one of the strongest monthly gains among the top markets.
Burnaby collapses to #5. Burnaby fell three spots after a 4.7% monthly drop to $2,030, the steepest decline in the top 10.
Montréal slips to #10. Québec’s largest market fell two spots on a 3.4% monthly decline to $1,730, its annual growth flattening to zero.
National Rent Index: One-Bedrooms Edge Up but Stay Below Last Year
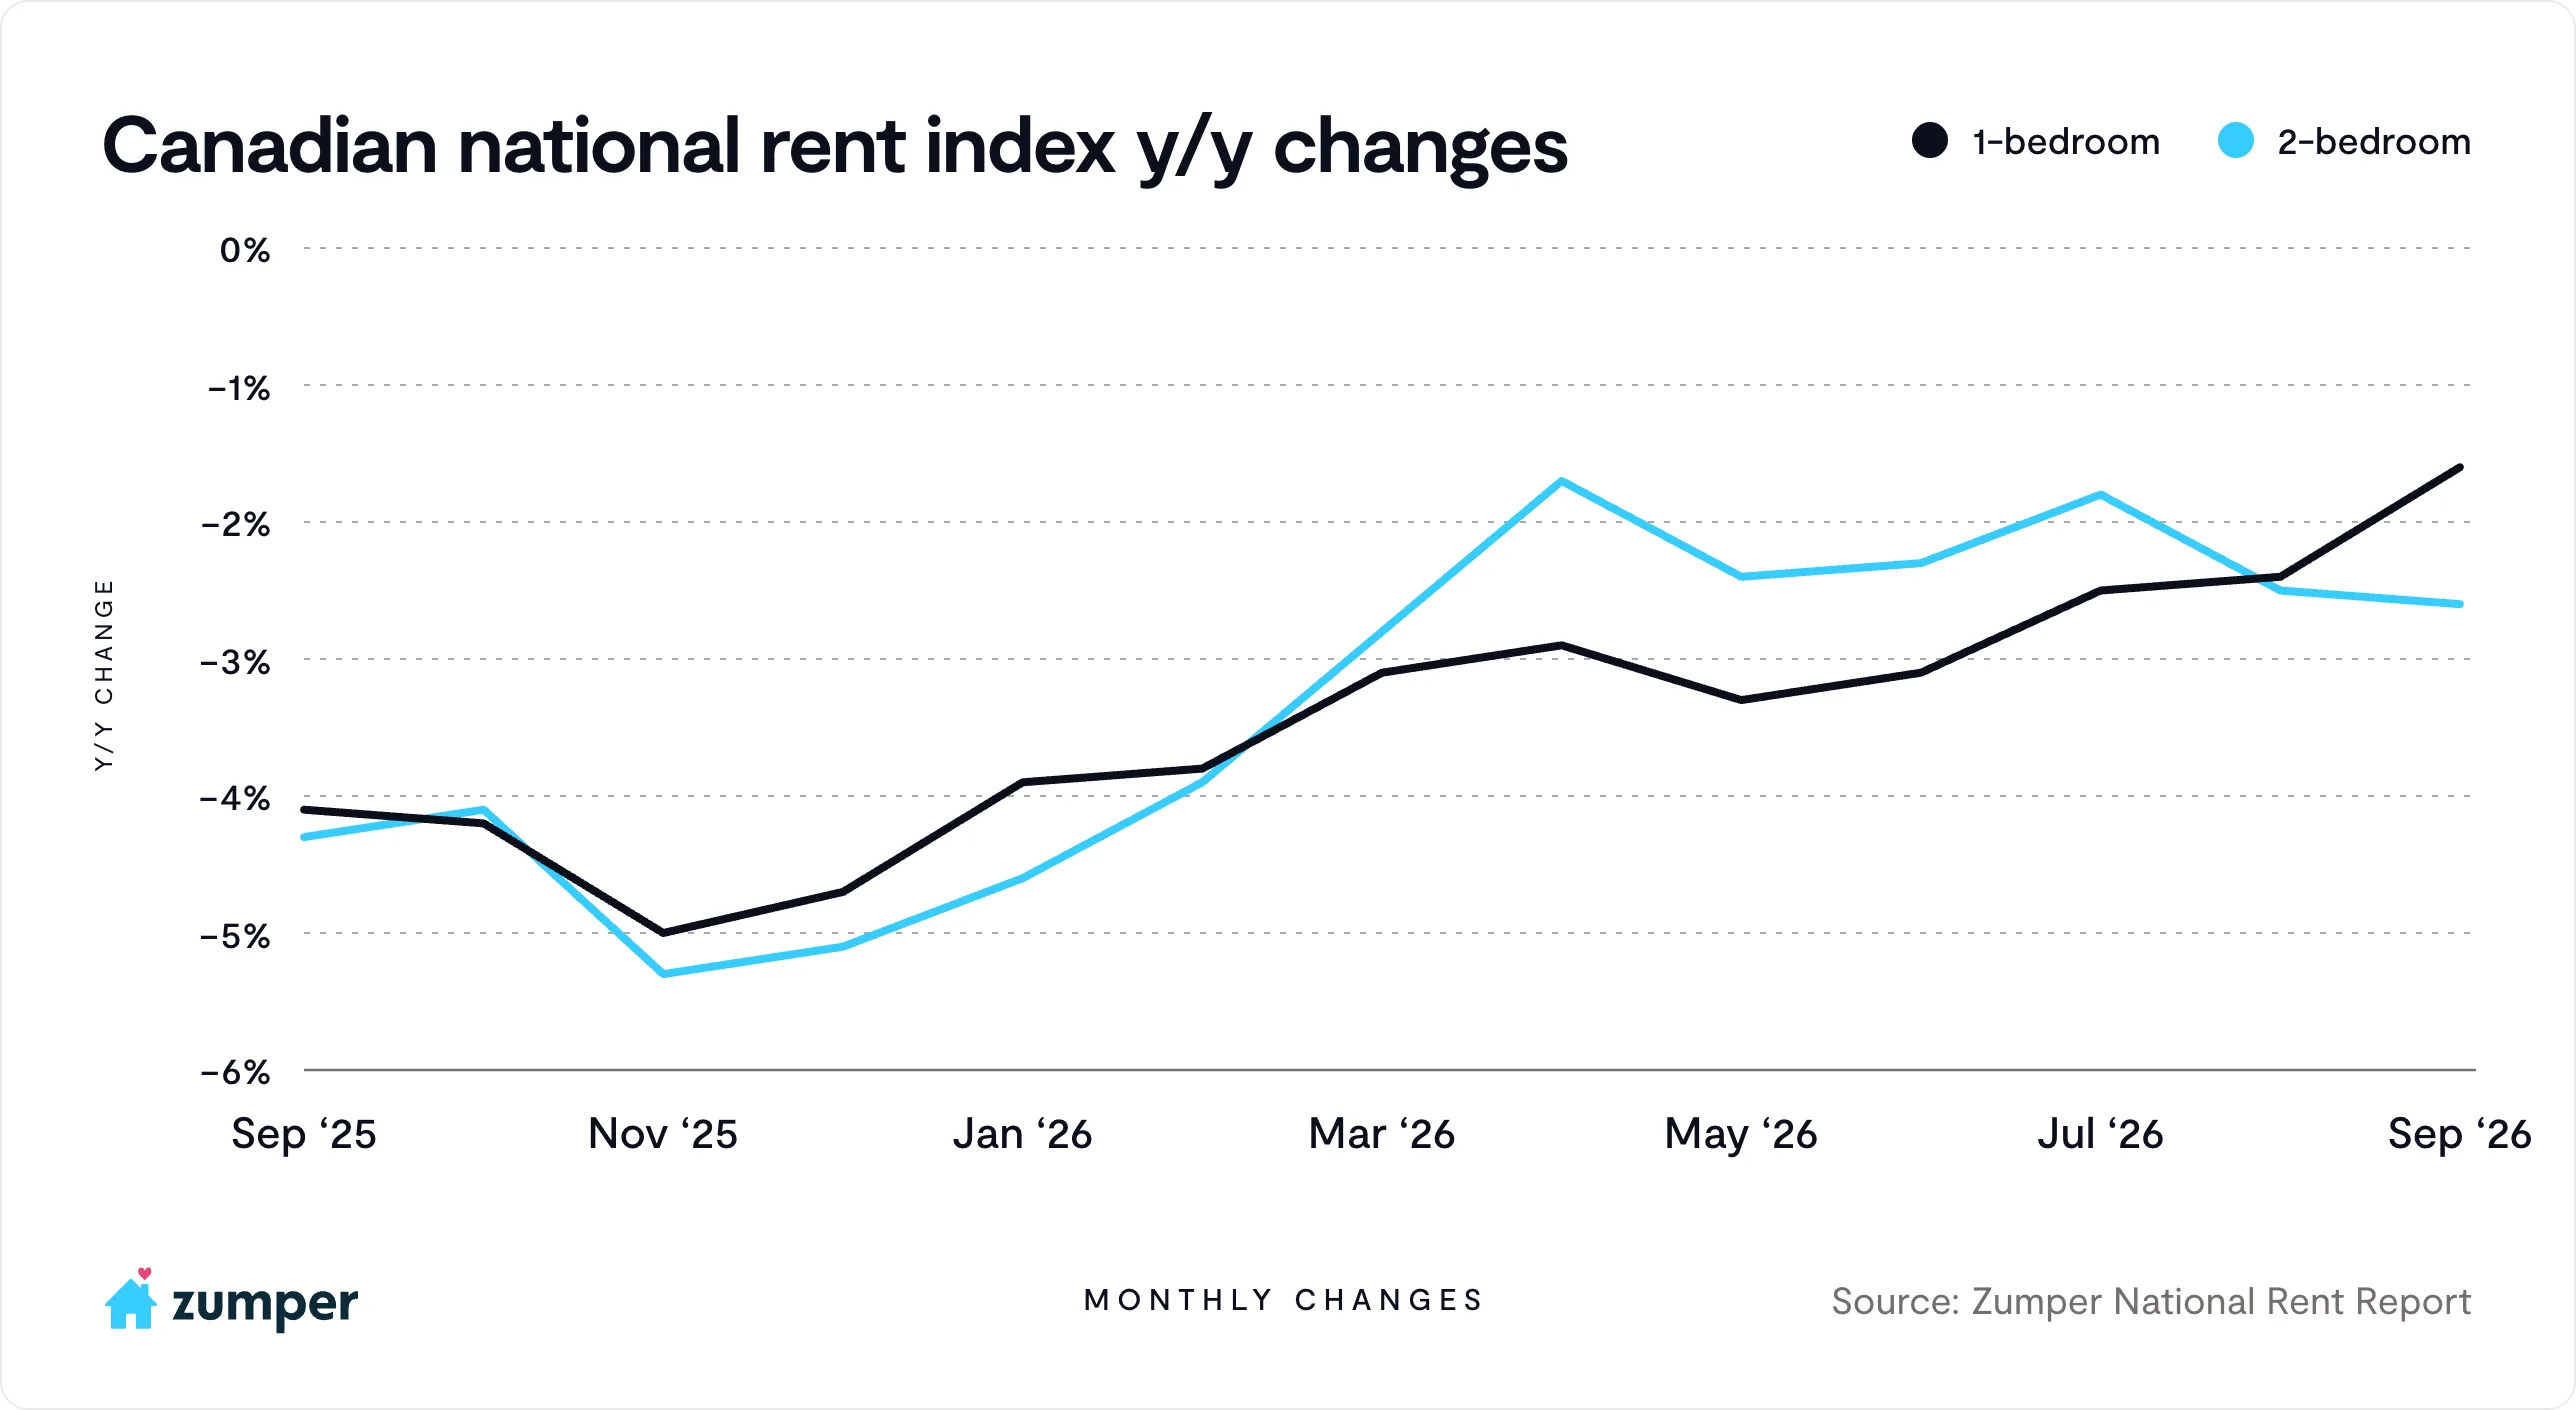
Zumper’s Canadian National Rent Index shows one-bedrooms increased 0.9% month-over-month to $1,791, while two-bedrooms slipped 0.1% to $2,199. On an annual basis, one-bedrooms remain down 1.6%, the smallest decline since January 2025, but still negative, while two-bedrooms are down 2.6%.
September’s one-bedroom uptick is likely a modest seasonal move riding on a few outperforming markets, and not the start of a durable reacceleration. Statistics Canada reports that national population growth slowed to just 0.5% in the year to July 2026, which was the weakest July-to-July pace in over a century, as the number of non-permanent residents fell by about 155,000. The Parliamentary Budget Officer expects population growth to stay essentially flat through 2026. On the supply side the pressure runs the other way: CMHC’s latest data shows the national purpose-built vacancy rate rose to 3.1% in 2025, with record rental completions still entering the market. Softening demand and rising supply are a combination that typically caps rent growth.
For renters, this continues to be good news. Both one and two-bedrooms are still cheaper than a year ago in most tracked markets, vacancies sit at multi-year highs, and incentives are still common. As we head into the cooler months, demand usually fades so the handful of markets driving September’s one-bedroom gain may falter against that weaker structural backdrop.
Biggest Movers: Strongest Annual Rent Growth
Barrie, ON +13.1%
Ottawa, ON +0.5%
Kingston, ON +0.5%
Annual rent growth has collapsed into a two-tier picture with Barrie on one side, and everyone else on the other. Barrie’s 13.1% increase now stands in a category of its own, more than twelve points above of the next-strongest market. Behind it, Ottawa and Kingston are tied for second at a mere 0.5% increase. That only three markets in the country are meaningfully positive, and two of them by the slimmest of margins, highlights how narrow September’s strength really was.
Biggest Declines: Largest Annual Rent Drops
Burnaby, BC -12.1%
Québec City, QC -11.6%
Hamilton, ON -7.1%
Burnaby’s -12.1% is the steepest annual decline in the country, falling even more so from -7.4% a month ago as Greater Vancouver’s supply wave hits its most exposed submarket hardest. Québec City is close behind at -11.6%. Hamilton is a distant third at -7.1%, but its month-over-month drop of 4.8% monthly was among the largest anywhere.
Regional Snapshot
British Columbia: B.C. was mostly in the negatives. Vancouver’s annual decline widened to -5.2% and Burnaby’s dropped to -12.1%, the worst in the country, both consistent with CMHC’s finding that Metro Vancouver’s vacancy rate has climbed to its highest level since 1988 amid record completions and softer immigration-driven demand. Meanwhile, Victoria (-1%) and Kelowna (-1.1%) were both slightly down and Abbotsford held flat. The province’s supply overhang remains the dominant force, but it is concentrated in metro Vancouver’s area.
Ontario: Barrie (+13.1%) had a strong month, Ottawa (+0.5%) turned positive, and Kingston (+0.5%), London (-0.6%), Kitchener (-2.9%), and Windsor (-1.4%) were all fairly flat to modestly declining. Pulling the other way, Hamilton (-7.1%), Oshawa (-5.7%), St. Catharines (-4.5%) saw rents decline more significantly. Toronto (-4.5%) was little changed from the previous months.
Québec: Québec’s long run of growth seems to be over. Montréal decelerated all the way to flat after leading the country for much of the year, while Québec City (-11.6%) sank to near the bottom of the national table. The province that set the pace this spring now sits at both the middle and the back of the pack.
Prairies: In Alberta, Calgary (-6.4%) and Edmonton (-5.8%) remain weak on an annual basis. Saskatoon was flat, while Regina (-4.5%) and Winnipeg (-3.3%) softened.
Atlantic Canada: Halifax finally budged after a summer of flat readings, slipping 1% annually. It remains one of the most stable markets in the country.
FAQ
What does this report measure?
Zumper’s Canadian National Rent Report tracks the median asking rents for one and two-bedroom units listed across Canada each month.
Why don’t these numbers match my rent, or figures from CMHC or Statistics Canada?
They measure different things. Zumper captures asking rents on new listings, or what you’d pay moving today, so they tend to run higher and move faster. CMHC and Statistics Canada tend to measure the entire occupied rental stock, including long-term tenants paying below-market rent, so their figures come in lower and lag the market. Both are useful but they just answer different questions.
Rents rose this month but the report says they’re still down, which is it?
Both are true. One-bedroom rents edged up 0.9% from August month-over-month but remain 1.6% below where they were a year ago.
How are the cities ranked?
By median one-bedroom asking rent, from highest to lowest.
Why do some smaller cities swing so sharply from month to month?
Smaller markets have fewer active listings, so their monthly numbers are more volatile than those of large markets like Toronto or Vancouver.
How often is the report published?
Monthly, covering major rental markets across the country.
Full Data
| 1 Bedroom | 1 Bedroom | 1 Bedroom | 2 Bedrooms | 2 Bedrooms | 2 Bedrooms | |||
|---|---|---|---|---|---|---|---|---|
| Ranking | Ranking Change | City | Price | M/M% | Y/Y% | Price | M/M% | Y/Y% |
| 1 | 0 | Vancouver, BC | $2,390 | 0.00% | -5.20% | $3,300 | 0.00% | -2.90% |
| 2 | 1 | Toronto, ON | $2,100 | -0.50% | -4.50% | $2,730 | -1.10% | -2.20% |
| 3 | 1 | Halifax, NS | $2,080 | -1.00% | -1.00% | $2,460 | -0.80% | -5.40% |
| 4 | 1 | Victoria, BC | $2,050 | 3.00% | -1.00% | $2,690 | 1.10% | 1.50% |
| 5 | -3 | Burnaby, BC | $2,030 | -4.70% | -12.10% | $2,650 | -2.60% | -8.60% |
| 6 | 0 | Ottawa, ON | $2,000 | 2.00% | 0.50% | $2,400 | 0.00% | -3.20% |
| 7 | 0 | Barrie, ON | $1,980 | 5.90% | 13.10% | $2,130 | 6.00% | 6.50% |
| 8 | 0 | Kingston, ON | $1,900 | 6.10% | 0.50% | $2,330 | 5.90% | 11.00% |
| 9 | 1 | Kelowna, BC | $1,840 | 4.50% | -1.10% | $2,280 | 2.70% | -4.20% |
| 10 | -2 | Montreal, QC | $1,730 | -3.40% | 0.00% | $2,160 | -1.80% | -4.40% |
| 11 | 2 | Kitchener, ON | $1,700 | 3.00% | -2.90% | $1,980 | 0.50% | -5.30% |
| 12 | 1 | Abbotsford, BC | $1,650 | 0.00% | 0.00% | $2,090 | 2.00% | -3.70% |
| 12 | 0 | London, ON | $1,650 | -0.60% | -0.60% | $2,100 | 0.50% | 4.50% |
| 12 | -1 | Oshawa, ON | $1,650 | -2.40% | -5.70% | $2,000 | 1.00% | 0.00% |
| 15 | 1 | Calgary, AB | $1,600 | 0.00% | -6.40% | $1,900 | -1.00% | -9.10% |
| 16 | -3 | Hamilton, ON | $1,570 | -4.80% | -7.10% | $2,020 | -4.70% | 2.00% |
| 17 | 0 | St.Catharines, ON | $1,480 | -1.30% | -4.50% | $1,830 | 0.50% | -1.10% |
| 18 | 0 | Winnipeg, MB | $1,450 | -1.40% | -3.30% | $1,720 | -1.10% | -9.00% |
| 19 | 0 | Windsor, ON | $1,430 | 3.60% | -1.40% | $1,730 | 6.10% | 5.50% |
| 20 | 3 | Edmonton, AB | $1,300 | 3.20% | -5.80% | $1,610 | -1.20% | -6.40% |
| 20 | 1 | Saskatoon, SK | $1,300 | 2.40% | 0.00% | $1,570 | 4.70% | 4.00% |
| 22 | -2 | Quebec, QC | $1,290 | 0.00% | -11.60% | $1,610 | 1.90% | -9.00% |
| 23 | -2 | Regina, SK | $1,280 | 0.80% | -4.50% | $1,530 | 0.70% | -4.40% |
Methodology
The Zumper Canadian Rent Report analyzes rental data from 50k+ active listings across the country. Listings are then aggregated on a monthly basis to calculate median asking rents for the top 23 most populous metro areas, providing a comprehensive view of the current state of the market. The report is based on all data available in the month prior to publication. Any data that is reported does not include short term listings. View our full methodology here.
To keep up to date with the latest rent trends or company news, like or follow Zumper on Facebook, Bluesky, X, and Instagram. In the market for a new place? Search apartments for rent on Zumper.
Related content