
Bedroom count
Property type
Last updated on June 17, 2026
Average rent in
Mission, San Francisco, CA
Average rent in
Last updated on June 17, 2026
Bedroom count
Property type
Median rent
Median rent in Mission
$3,747/mo
vs previous year
The average rent in Mission is $3,747 per month as of June 2026. This is 92% above the national average rent, or $1,797 more per month.
average price per square foot
Total rentals
Available rentals in Mission
27
for rent on Zumper.com as of June 2026
Rent price distribution
Share of Mission rentals at each price point
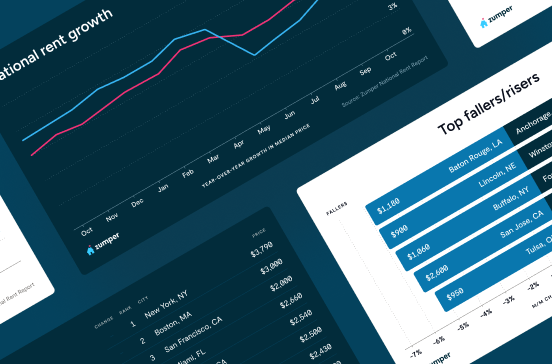
Rent trends in Mission, San Francisco, CA
Average rent prices in Mission have increased by 11% over the last month and have increased by 9% since last year.
Rent trends
Rent prices on this page are calculated on a rolling 30-day basis and updated daily.
Compare rent prices in
Mission, San Francisco, CA
Rent prices in Mission vary by bedroom size, rental type, and neighborhood. The average rent for an apartment in Mission is $3,467, whereas a house costs $7,750. 1-bedroom apartments in Mission run $3,440 on average, while 2-bedroom apartments are $4,900.
Listings | ||||
|---|---|---|---|---|
Studio | $2,495 |  1% | No Change | |
1 bedroom | $3,367 | 14% | 2% | |
2 bedroom | $5,417 | 1% | 37% | |
3 bedroom | $7,225 | 32% | 55% | |
4 bedroom | $12,000 | 32% | 86% |
Listings | ||
|---|---|---|
Downtown | $2,295 | |
Lower Haight | $3,695 | |
Noe Valley | $4,747 | |
Soma | $4,866 | |
South Beach | $4,915 | |
Tenderloin | $1,875 |
Listings | ||||
|---|---|---|---|---|
Apartments | $3,467 |  5% | No Change | |
Condos | $5,150 | 11% | No Change | |
Houses | $7,750 | 43% | No Change |
Studio
Average rent
$2,495
Last 30 days
1%
Last year
No Change
1 bedroom
Average rent
$3,367
Last 30 days
14%
Last year
2%
2 bedroom
Average rent
$5,417
Last 30 days
1%
Last year
37%
3 bedroom
Average rent
$7,225
Last 30 days
32%
Last year
55%
4 bedroom
Average rent
$12,000
Last 30 days
32%
Last year
86%
Downtown
Average rent
$2,295
Lower Haight
Average rent
$3,695
Noe Valley
Average rent
$4,747
Soma
Average rent
$4,866
South Beach
Average rent
$4,915
Tenderloin
Average rent
$1,875
Apartments
Average rent
$3,467
Last 30 days
5%
Condos
Average rent
$5,150
Last 30 days
11%
Houses
Average rent
$7,750
Last 30 days
43%
The table above reflects average rent prices in Mission, San Francisco, CA, broken down by the number of bedrooms, neighborhoods, and property types. The availability of data for each category is dependent on market inventory and will adjust depending on your selected filters.
How does rent in Mission, San Francisco, CA compare to other neighborhoods?
Compare median rent prices in Mission and Downtown by all bedroom counts and property types.
Mission
higher than the national median
higher than the national median
Takeaway
The median rent for all rentals in Mission, San Francisco, CA is 63% higher than the median rent in Downtown, San Francisco, CA.
Average rent in nearby neighborhoods
Explore rent trends in neighboring markets
Discover rentals in Mission, San Francisco, CA

5d+ ago
Mission apartment for rent in San Francisco
Studio
1 bath
$1,749
Apartment for rent
Available May 11

2d ago
520 Bartlett St, San Francisco, CA 94110
2 beds
1 bath
$4,895
Apartment for rent

9h ago
Mission apartment for rent in San Francisco
2333 Mission St #2, San Francisco, CA 94110
2 beds
2 baths
$4,900
Apartment for rent

5d+ ago
Mission apartment for rent in San Francisco
2 beds
2 baths
$4,900
Apartment for rent


5d+ ago
Mission house for rent in San Francisco
1160 Florida St, San Francisco, CA 94110
4 beds
4 baths
$22,500
House for rent

20h ago
Mission house for rent in San Francisco
4 beds
3.5 baths
$19,950
House for rent

1d ago
Verified
2 beds
2.5 baths
$18,750
$17,790
Price drop
Apartment for rent
5d+ ago
Mission condo for rent in San Francisco
3 beds
2.5 baths
$12,500
Condo for rent
Available Aug 1


2h ago
Verified
2385 Folsom St, San Francisco, CA 94110
Studio
1 bath
$2,295
Apartment for rent

2d ago
901 Valencia St, San Francisco, CA 94110
1 bed
1 bath
$3,095
Apartment for rent

5d+ ago
2315 Mission St, San Francisco, CA 94110
1 bed
1 bath
$2,995
Apartment for rent
5d+ ago
Mission apartment for rent in San Francisco
470 14th St #4, San Francisco, CA 94103
1 bed
1 bath
$4,695
$4,495
Price drop
Apartment for rent
2h ago
Verified
2385 Folsom St, San Francisco, CA 94110
Studio
1 bath
$2,295
Apartment for rent

5d+ ago
Verified
3140 21st St #103A, San Francisco, CA 94110
Studio
1 bath
$2,795
Apartment for rent
Available Jun 15

5d+ ago
Verified
1 bed
1 bath
$3,440
Apartment for rent
2d ago
901 Valencia St, San Francisco, CA 94110
1 bed
1 bath
$3,095
Apartment for rent

1d ago
Verified
2 beds
2.5 baths
$18,750
$17,790
Price drop
Apartment for rent
5d+ ago
Verified
3140 21st St #103A, San Francisco, CA 94110
Studio
1 bath
$2,795
Apartment for rent
Available Jun 15
2d ago
520 Bartlett St, San Francisco, CA 94110
2 beds
1 bath
$4,895
Apartment for rent
2d ago
901 Valencia St, San Francisco, CA 94110
1 bed
1 bath
$3,095
Apartment for rent


Stay up to date with rental market insights

Are you interested in licensing our current and historical rental real estate data, or do you have custom data requests? Contact datalicensing@zumper.com.
Frequently asked questions for Mission, San Francisco, CA
Quick answers to common questions about the Mission rental market.
How much is rent in Mission?
The average rent in Mission is $3,747 per month as of June 13, 2026.
Is rent up or down in Mission?
Average rent prices in Mission have increased by 11% over the last month and have increased by 9% since last year.
How does Mission rent compare to the national average?
Rent in Mission is 92% above the national average, which means renters are paying approximately $1,797 more per month.
What salary do I need to afford rent in Mission?
To comfortably afford rent in Mission, you'd need to earn approximately $150,000/year, based on spending no more than 30% of your income on rent.
Methodology
Rent prices are based on Zumper's rental listings from the past 30 days. Median rent is calculated across all available listings and property types on the platform. If you filter the page by bedroom count or property type, the pricing throughout the page will update automatically to reflect that segment of the rental market.
Household and population data come from the U.S. Census Bureau. Cost-of-living data is sourced from the Council for Community and Economic Research's Cost of Living Index (COLI).