
Bedroom count
Property type
Last updated on June 26, 2026
Average rent in
Boston, MA
Average rent in
Last updated on June 26, 2026
Bedroom count
Property type
Key takeaways for renters
Where Boston rent stands today
Boston, MA rent rose 3.0% year over year, with a current median of $3,400/month. Renters today are paying $197 more per month on average than last year, with rent holding close to the recent peak from February 2026.
Vs. national rents
Boston runs roughly 1.7× the national median of $1,950/month, placing it among the priciest major coastal metros for renters seeking urban amenities.
Rent ranges by bedroom
Studio rents in Boston sit at $2,425/month, 1-bedrooms at $2,800/month, 2-bedrooms at $3,495/month, and 4+ bedrooms reach $4,995/month. These figures show a broad range of rental prices by bedroom count across the city.
Neighborhood spotlight
Bay Village rents rose 30.4% year over year to $4,825/month, contrasting with Fairmount Hills where rents fell 24.8% to $2,650/month. These neighborhoods illustrate notable local variation in rent trends.
Median rent
Median rent in Boston
$3,400/mo
vs previous year
The average rent in Boston is $3,400 per month as of June 2026. This is 74% above the national average rent, or $1,450 more per month.
average price per square foot
Total rentals
Available rentals in Boston
9,087
for rent on Zumper.com as of June 2026
Rent price distribution
Share of Boston rentals at each price point
Rent trends in Boston, MA
Average rent prices in Boston have remained the same over the last month and have increased by 3% since last year.
Rent trends
Rent prices on this page are calculated on a rolling 30-day basis and updated daily.
Compare rent prices in
Boston, MA
Rent prices in Boston vary by bedroom size, rental type, and neighborhood. The average rent for an apartment in Boston is $3,350, whereas a house costs $3,900. 1-bedroom apartments in Boston run $2,850 on average, while 2-bedroom apartments are $3,500.
Listings | ||||
|---|---|---|---|---|
Studio | $2,425 |  1% |  3% | |
1 bedroom | $2,800 | No Change | 4% | |
2 bedroom | $3,495 | No Change | 5% | |
3 bedroom | $3,850 | 1% | 7% | |
4 bedroom | $4,995 | 2% | 12% |
Listings | ||
|---|---|---|
Back Bay | $3,500 | |
Commonwealth | $3,000 | |
D Street West Broadway | $4,200 | |
Downtown Boston | $4,300 | |
Fenway Kenmore Audubon Circle Longwood | $3,247 | |
Mission Hill | $3,900 | |
North Allston | $3,695 | |
Oak Square | $3,500 | |
South End | $3,850 | |
St Elizabeth's | $2,800 |
Listings | ||||
|---|---|---|---|---|
Apartments | $3,350 | No Change | No Change | |
Condos | $3,800 | 1% | No Change | |
Houses | $3,900 | 3% | No Change | |
Rooms | $1,280 | 3% | No Change |
Studio
Average rent
$2,425
Last 30 days
1%
Last year
3%
1 bedroom
Average rent
$2,800
Last 30 days
No Change
Last year
4%
2 bedroom
Average rent
$3,495
Last 30 days
No Change
Last year
5%
3 bedroom
Average rent
$3,850
Last 30 days
1%
Last year
7%
4 bedroom
Average rent
$4,995
Last 30 days
2%
Last year
12%
Commonwealth
Average rent
$3,000
Fenway Kenmore Audubon Circle Longwood
Average rent
$3,247
Mission Hill
Average rent
$3,900
St Elizabeth's
Average rent
$2,800
Oak Square
Average rent
$3,500
Back Bay
Average rent
$3,500
Downtown Boston
Average rent
$4,300
North Allston
Average rent
$3,695
South End
Average rent
$3,850
D Street West Broadway
Average rent
$4,200
Apartments
Average rent
$3,350
Last 30 days
No Change
Condos
Average rent
$3,800
Last 30 days
1%
Houses
Average rent
$3,900
Last 30 days
3%
Rooms
Average rent
$1,280
Last 30 days
3%
The table above reflects average rent prices in Boston, MA, broken down by the number of bedrooms, neighborhoods, and property types. The availability of data for each category is dependent on market inventory and will adjust depending on your selected filters.
How does rent in Boston, MA compare to other cities?
Compare median rent prices in Boston and Brockton by all bedroom counts and property types.
Boston
higher than the national median
higher than the national median
Takeaway
The median rent for all rentals in Boston, MA is 55% higher than the median rent in Brockton, MA.
Average rent in nearby cities
Explore rent trends in neighboring markets
Cost of living in Boston, MA
Explore the cost of essential expenses, and then use our rent calculator to find out how much rent you can afford.
Expenses accrued by most renters | Average cost compared to national average |
|---|---|
| Goods & Services | 17% higher |
| Groceries | 4% higher |
| Health | 33% higher |
| Housing | 121% higher |
| Transportation | 5% higher |
| Utilities | 51% higher |
Discover rentals in Boston, MA

5d+ ago
7-9-9R Winship, Boston, MA 02135
Studio
-1 baths
$200
The price shown reflects a 12-month lease and includes base rent plus all required monthly fees provided by the property.Apartment for rent

2d ago
1–3 beds
1 bath
$795–$3,100
The price shown reflects a 12-month lease and includes base rent plus all required monthly fees provided by the property.Apartment for rent

5d+ ago
Franklin Field North apartment for rent in Boston
88 Bernard St #ROOM, Boston, MA 02124
1 bed
1 bath
$800
The price shown reflects a 12-month lease and includes base rent plus all required monthly fees provided by the property.Apartment for rent
Available Jul 1

5d+ ago
Bowdoin Park, Boston, MA 02122
1 bed
1–2 baths
$875
The price shown reflects a 12-month lease and includes base rent plus all required monthly fees provided by the property.Apartment for rent


5d+ ago
Chinatown - Leather District apartment for rent in Boston
2 Avery St #PH3C, Boston, MA 02111
3 beds
3.5 baths
$45,000
The price shown reflects a 12-month lease and includes base rent plus all required monthly fees provided by the property.Apartment for rent
Available Dec 1

1h ago
Verified
139 Washington St, Boston, MA 02135
Studio–3 beds
1–3 baths
$2,945–$5,655
Price drop
The price shown reflects a 12-month lease and includes base rent plus all required monthly fees provided by the property.Apartment for rent

8h ago
Verified
50 Causeway St, Boston, MA 02114
Studio–5 beds
1–2 baths
$2,750–$23,473
The price shown reflects a 12-month lease and includes base rent plus all required monthly fees provided by the property.Apartment for rent

8h ago
Verified
4 beds
2 baths
$23,979
$23,473
Price drop
The price shown reflects a 12-month lease and includes base rent plus all required monthly fees provided by the property.Apartment for rent


8h ago
Verified
50 Causeway St, Boston, MA 02114
Studio–5 beds
1–2 baths
$2,750–$23,473
The price shown reflects a 12-month lease and includes base rent plus all required monthly fees provided by the property.Apartment for rent

7h ago
Verified
250 1st Ave, Boston, MA 02129
Studio–2 beds
1–2 baths
$3,142–$7,617
The price shown reflects a 12-month lease and includes base rent plus all required monthly fees provided by the property.Apartment for rent

11h ago
Verified
1555 Vfw Pkwy, Boston, MA 02132
Studio–2 beds
1–2 baths
$2,528–$6,893
The price shown reflects a 12-month lease and includes base rent plus all required monthly fees provided by the property.Apartment for rent

19h ago
Verified
899 Congress St, Boston, MA 02210
Studio–3 beds
1–2 baths
$3,388–$16,982
The price shown reflects a 12-month lease and includes base rent plus all required monthly fees provided by the property.Apartment for rent


8h ago
Verified
50 Causeway St, Boston, MA 02114
Studio–5 beds
1–2 baths
$2,750–$23,473
The price shown reflects a 12-month lease and includes base rent plus all required monthly fees provided by the property.Apartment for rent
19h ago
Verified
899 Congress St, Boston, MA 02210
Studio–3 beds
1–2 baths
$3,388–$16,982
The price shown reflects a 12-month lease and includes base rent plus all required monthly fees provided by the property.Apartment for rent
16h ago
Verified
9 Bronsdon St, Boston, MA 02135
2–3 beds
1 bath
$3,120–$3,905
The price shown reflects a 12-month lease and includes base rent plus all required monthly fees provided by the property.Apartment for rent

2d ago
Verified
30 Rockingham Ave, Boston, MA 02132
1–2 beds
1 bath
$2,495–$3,590
Price drop
The price shown reflects a 12-month lease and includes base rent plus all required monthly fees provided by the property.Apartment for rent


8h ago
Verified
50 Causeway St, Boston, MA 02114
Studio–4 beds
1–2 baths
$2,840–$6,924
The price shown reflects a 12-month lease and includes base rent plus all required monthly fees provided by the property.Apartment for rent
7h ago
Verified
250 1st Ave, Boston, MA 02129
Studio–2 beds
1–2 baths
$3,142–$7,617
The price shown reflects a 12-month lease and includes base rent plus all required monthly fees provided by the property.Apartment for rent
1d ago
Verified
899 Congress St, Boston, MA 02210
1 bed
1 bath
Call for price
The price shown reflects a 12-month lease and includes base rent plus all required monthly fees provided by the property.Apartment for rent
5d+ ago
Verified
1555 Vfw Pkwy, Boston, MA 02132
1 bed
1 bath
Call for price
The price shown reflects a 12-month lease and includes base rent plus all required monthly fees provided by the property.Apartment for rent
Stay up to date with rental market insights


Are you interested in licensing our current and historical rental real estate data, or do you have custom data requests? Contact datalicensing@zumper.com.
Frequently asked questions for Boston, MA
Quick answers to common questions about the Boston rental market.
How much is rent in Boston?
The average rent in Boston is $3,400 per month as of June 20, 2026.
Is rent up or down in Boston?
Average rent prices in Boston have remained the same over the last month and have increased by 3% since last year.
How does Boston rent compare to the national average?
Rent in Boston is 74% above the national average, which means renters are paying approximately $1,450 more per month.
Which neighborhoods are most affordable in Boston?
The most affordable neighborhoods in Boston are St Elizabeth's ($2,800/mo), Commonwealth ($3,000/mo), and Fenway Kenmore Audubon Circle Longwood ($3,247/mo).
What salary do I need to afford rent in Boston?
To comfortably afford rent in Boston, you'd need to earn approximately $136,000/year, based on spending no more than 30% of your income on rent.
When is the best time of year to rent in Boston?
Boston's 2025 rental market shows 1-bedroom apartments averaging around $2,900 per month, while 2-bedroom units average around $3,400 per month. These figures reflect the city's competitive rental landscape across different property types and neighborhoods.
Methodology
Rent prices are based on Zumper's rental listings from the past 30 days. Median rent is calculated across all available listings and property types on the platform. If you filter the page by bedroom count or property type, the pricing throughout the page will update automatically to reflect that segment of the rental market.
Household and population data come from the U.S. Census Bureau. Cost-of-living data is sourced from the Council for Community and Economic Research's Cost of Living Index (COLI).
For additional insights into rental trends, including month-over-month changes and historical comparisons, see Zumper's Monthly Metro Report.
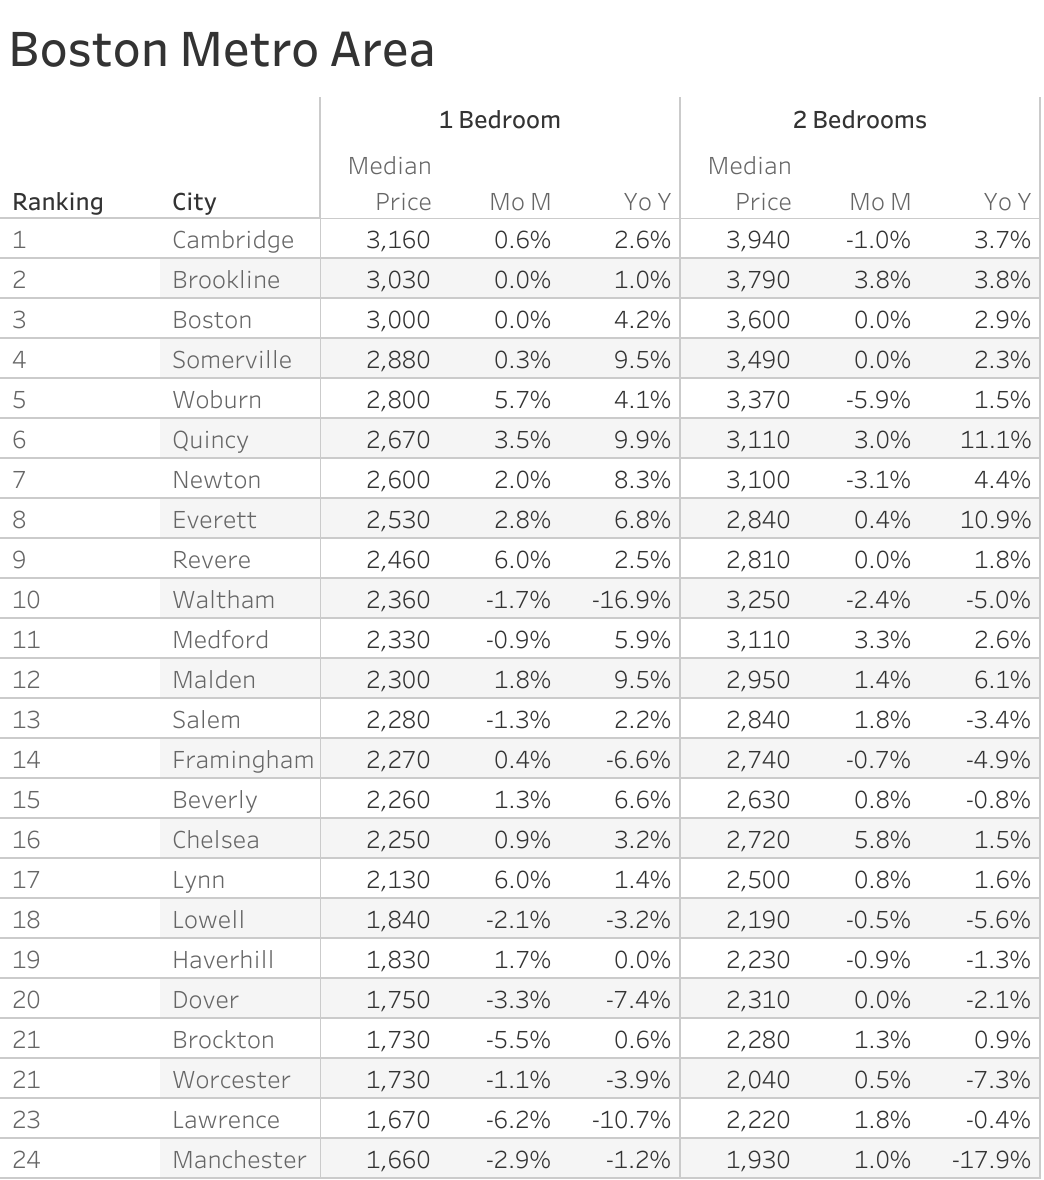
Boston Metro Report
The Zumper Boston Metro Report analyzed active listings last month across metro cities to show the most and least expensive cities and cities with the fastest growing rents. The Massachusetts one bedroom median rent was $2,286 last month.
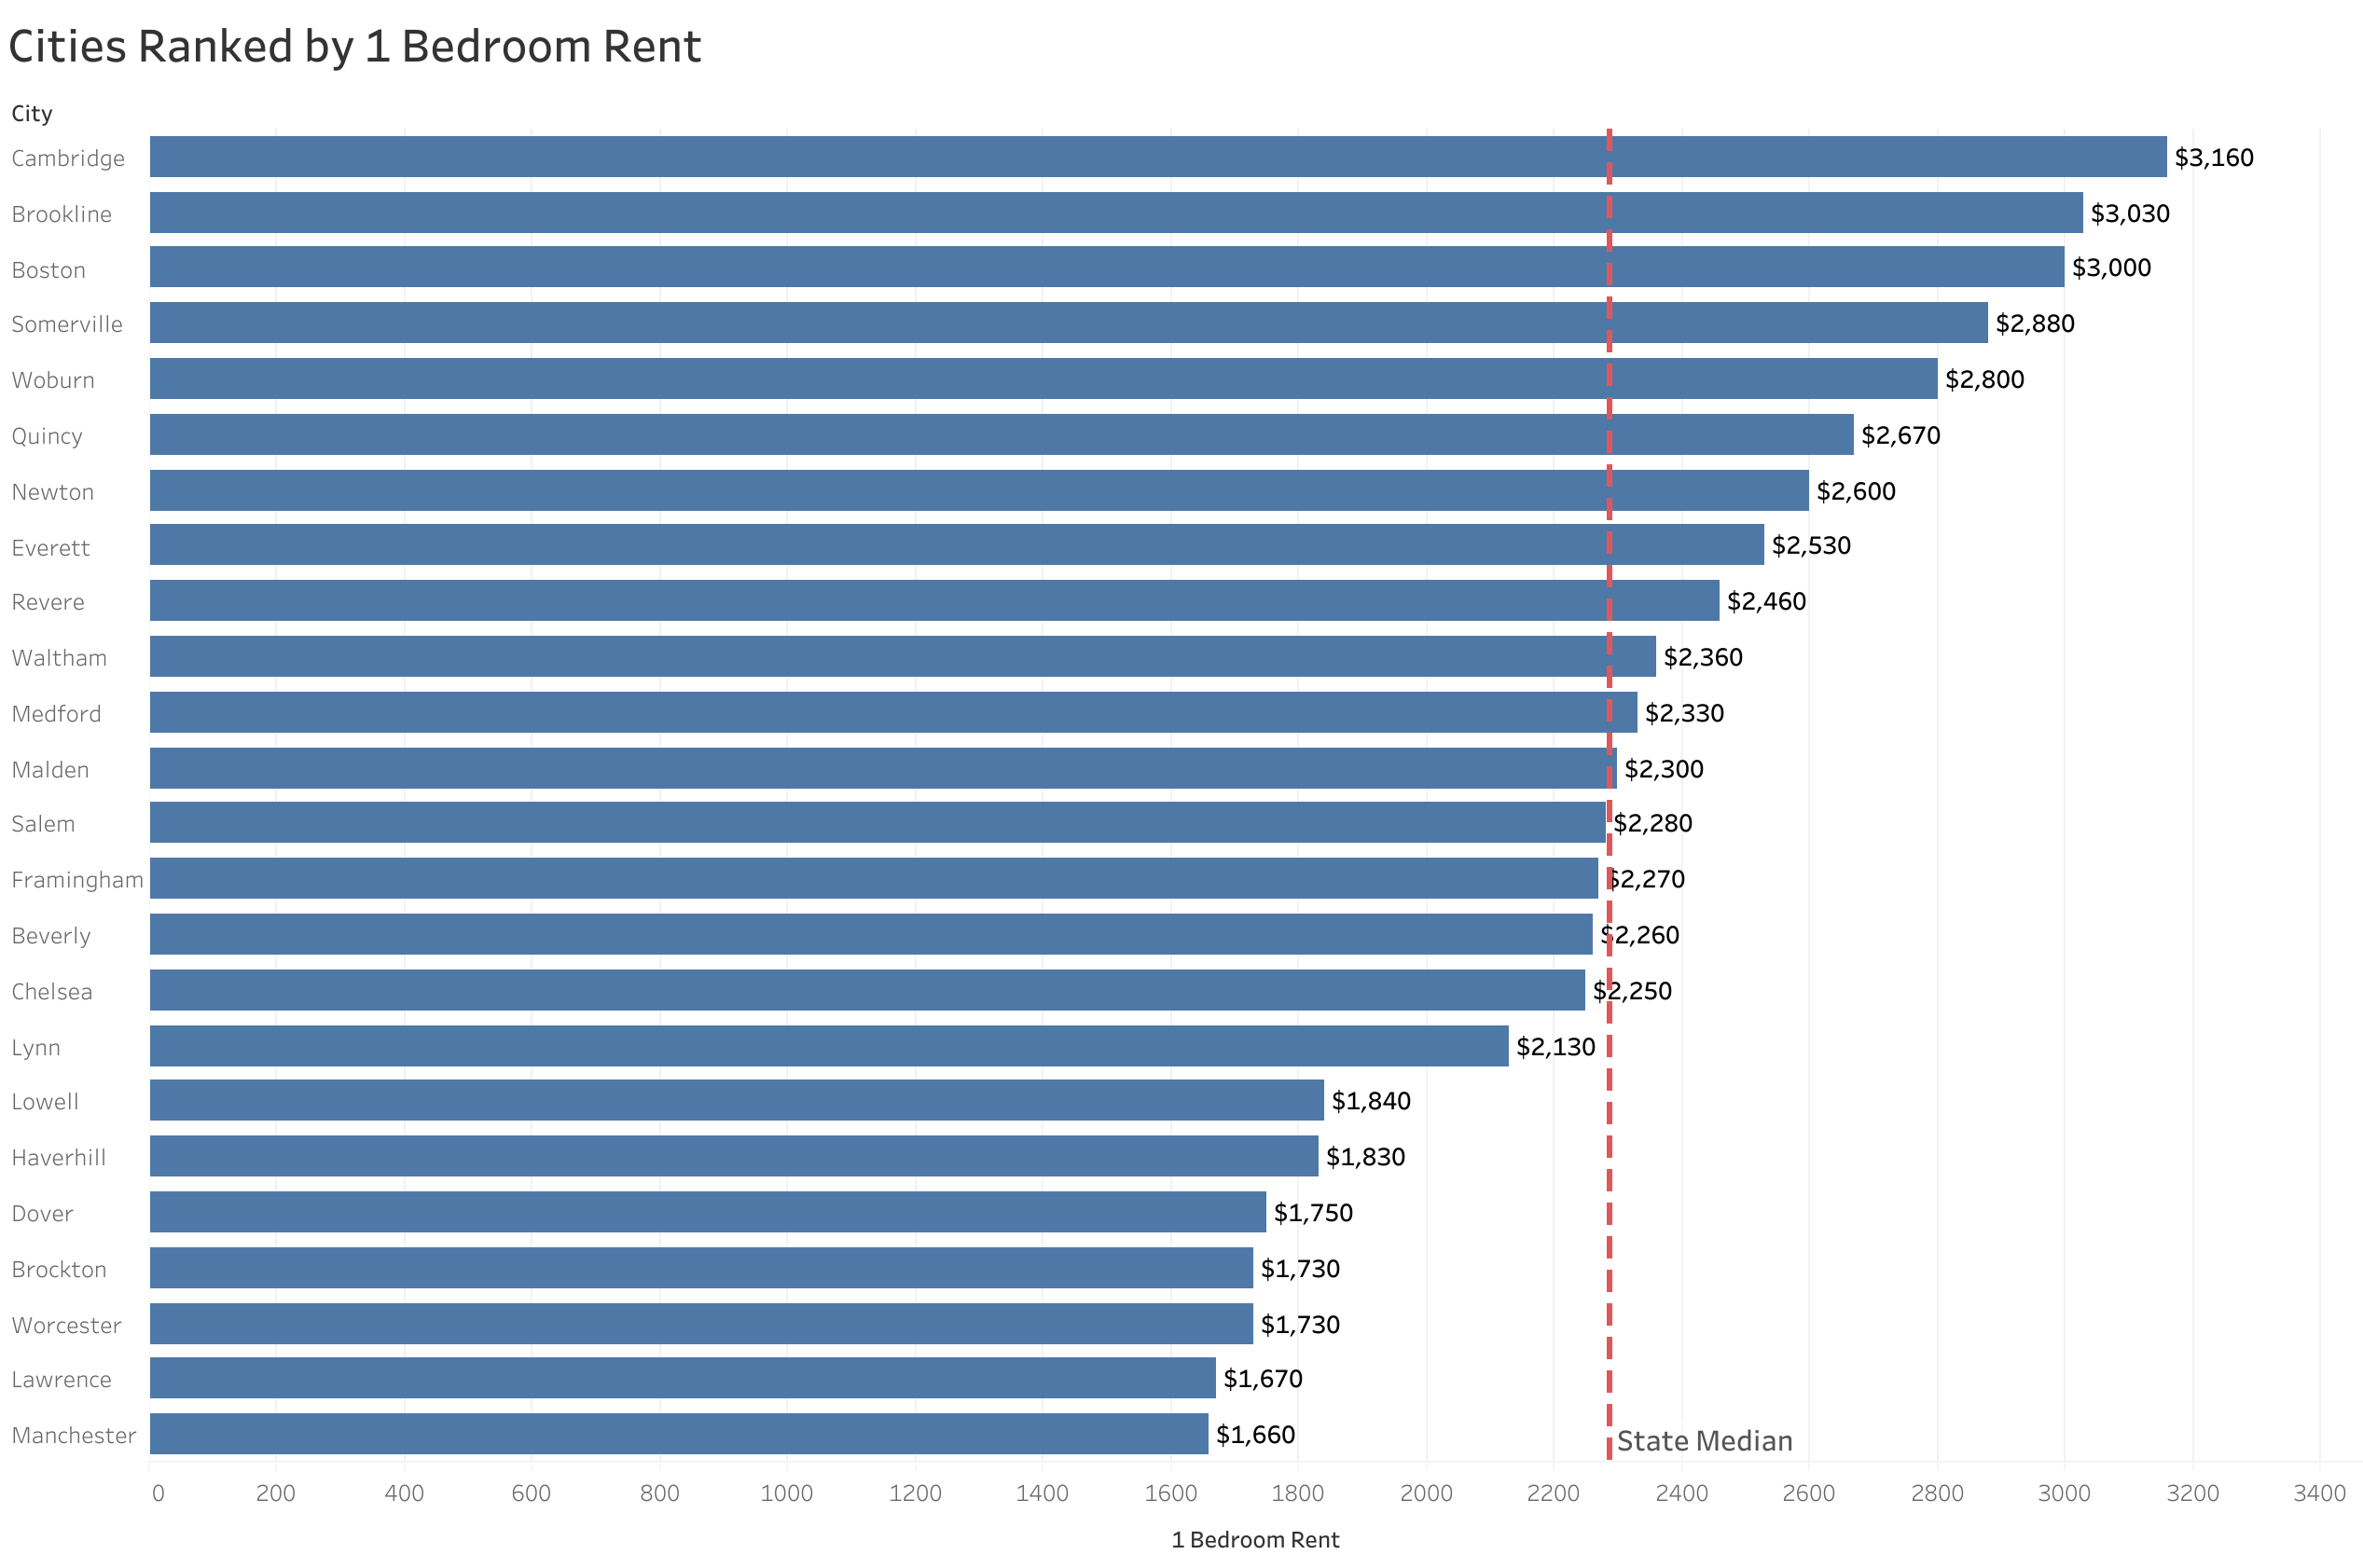
The Most Expensive
- Cambridge ranked as the most expensive city with one-bedrooms priced at $3,160.
- Brookline was the second priciest with rent at $3,030.
- Boston placed as third with rent at $3,000.
The Least Expensive
- Manchester was the most affordable city with one-bedrooms priced at $1,660.
- Lawrence ranked as the second least expensive with rent at $1,670.
- Worcester placed third with rent at $1,730.
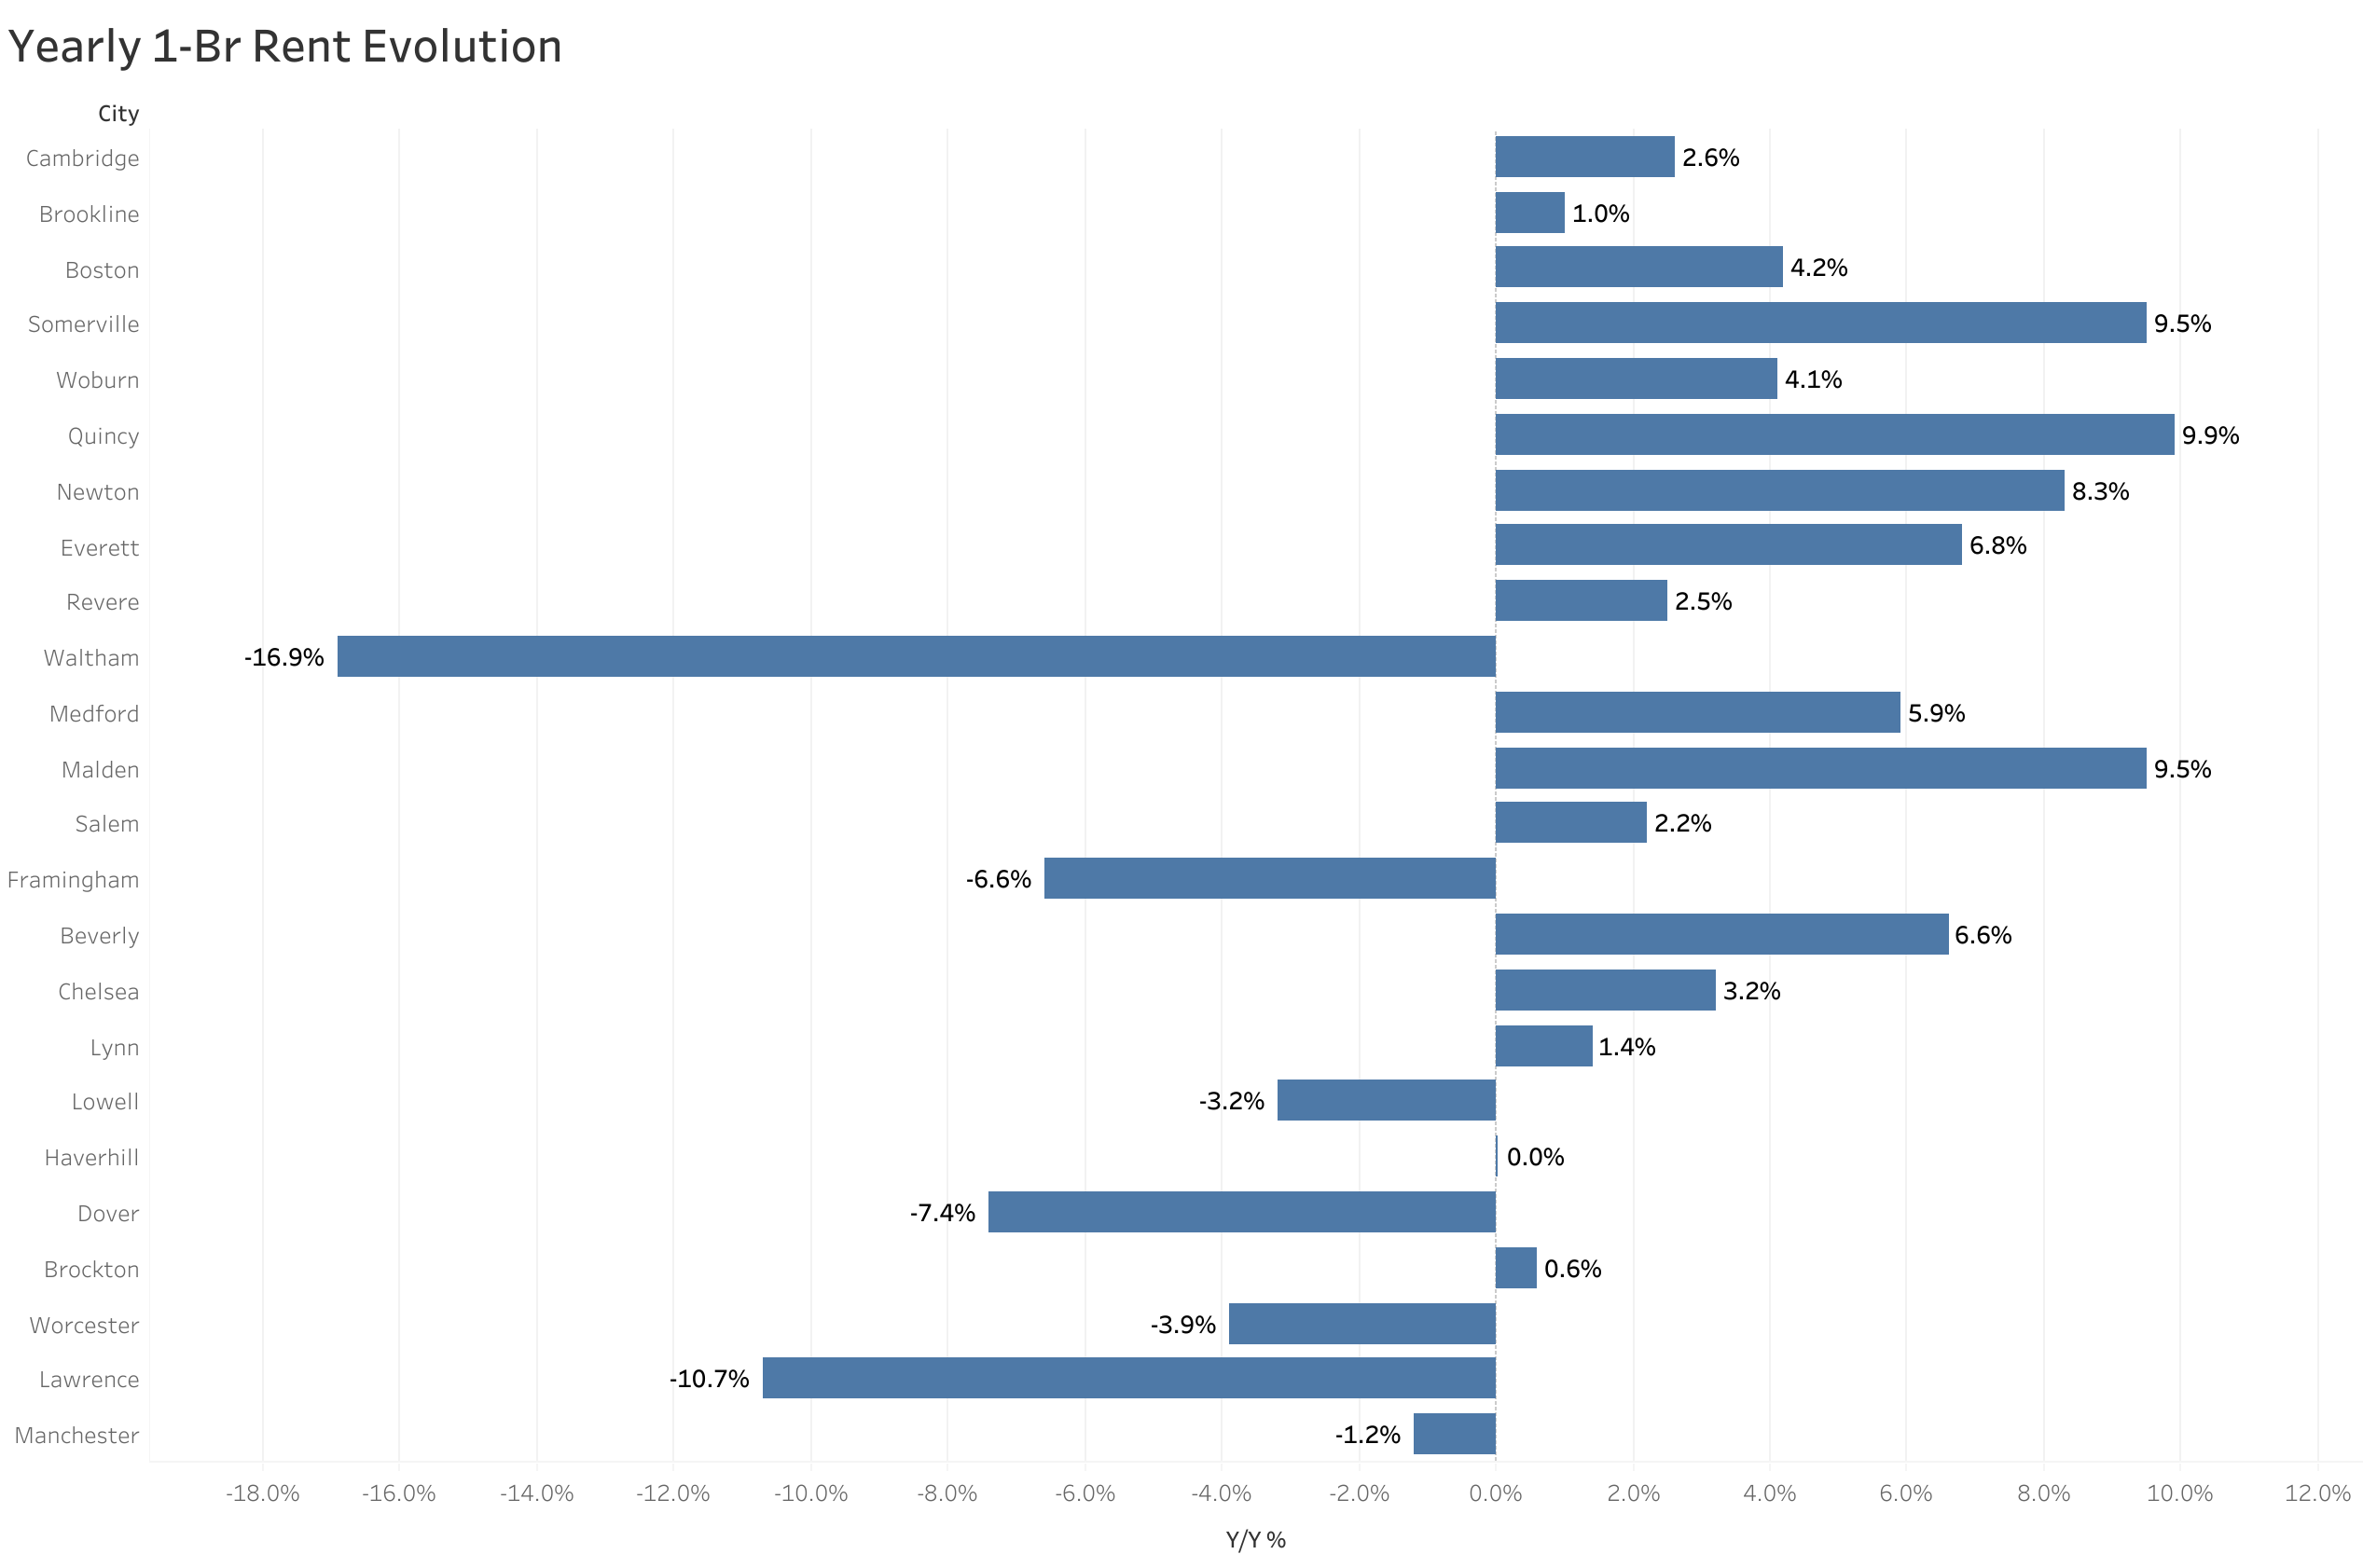
The Fastest Growing (Y/Y%)
- Quincy had the fastest growing rent, up 9.9% since this time last year.
- Somerville & Malden tied for second with rents both climbing 9.5%.
- Newton placed third with rent increasing 8.3%.
The Fastest Growing (M/M%)
About
The Zumper Boston Metro Area Report analyzed active listings that hit the market last month. Listings are aggregated by city to calculate median asking rents.
Words by
Crystal ChenCrystal Chen is a seasoned real estate and housing market expert with more than a decade of experience analyzing rental trends, housing affordability, and urban living. At Zumper, she leads data storytelling as well as press and media relations, where she translates complex housing research into easily digestible insights for renters, industry professionals, and journalists. Her reports can be seen cited in national outlets like The New York Times, The Wall Street Journal, and CNBC. She is passionate about helping renters navigate today’s evolving housing landscape with clarity and confidence. Living in New York City herself, she knows firsthand the chaos and challenges of navigating a competitive rental market.