
Bedroom count
Property type
Last updated on June 29, 2026
Average rent in
Phoenix, AZ
Average rent in
Last updated on June 29, 2026
Bedroom count
Property type
Key takeaways for renters
Where Phoenix rent stands today
Phoenix, AZ rent slipped 5.3% year over year, with a current median of $1,699/month. Renters today are paying $55 less per month on average than last year, though rent ticked up 2.8% month over month in June 2026.
Compared to national trends
Phoenix sits 12.9% more affordable than the $1,950/month national median, with 3,158 total rentals offering a broad range of options for renters.
Price ranges
Studios in Phoenix rent for about $950/month, 1-bedrooms around $1,154/month, and 2-bedrooms near $1,495/month, with 3-bedrooms at $2,195/month and 4+ bedrooms at $2,695/month. Houses run a median of $2,235/month while apartments sit at $1,324/month, reflecting distinct price tiers for property types.
Neighborhood spotlight
Granite Mountain Ranch rents climbed 116.7% year over year to $6,500/month across 12 rentals, contrasting with the citywide decline of 5.3%. Pointe Tapatio rents fell 60.6% year over year to $1,004/month.
Median rent
Median rent in Phoenix
$1,699/mo
vs previous year
The average rent in Phoenix is $1,699 per month as of June 2026. This is 13% below the national average rent, or $251 less per month.
average price per square foot
Total rentals
Available rentals in Phoenix
3,158
for rent on Zumper.com as of June 2026
Rent price distribution
Share of Phoenix rentals at each price point
Rent trends in Phoenix, AZ
Average rent prices in Phoenix have increased by 3% over the last month and have decreased by 5% since last year.
Rent trends
Rent prices on this page are calculated on a rolling 30-day basis and updated daily.
Compare rent prices in
Phoenix, AZ
Rent prices in Phoenix vary by bedroom size, rental type, and neighborhood. The average rent for an apartment in Phoenix is $1,324, whereas a house costs $2,235. 1-bedroom apartments in Phoenix run $1,175 on average, while 2-bedroom apartments are $1,405.
Listings | ||||
|---|---|---|---|---|
Studio | $950 |  1% | 17% | |
1 bedroom | $1,154 | No Change |  4% | |
2 bedroom | $1,495 | No Change | 4% | |
3 bedroom | $2,195 | No Change | 1% | |
4 bedroom | $2,695 | 5% | 4% |
Listings | ||
|---|---|---|
Citrus Acres | $1,205 | |
Desert Ridge | $3,595 | |
Downtown Phoenix | $1,954 | |
Garfield | $1,325 | |
Governmental Mall | $1,195 | |
Kierland | $3,484 | |
La Mancha | $1,350 | |
Lakewood | $1,865 | |
Paradise Valley Oasis | $2,295 | |
Tramonto | $2,300 |
Listings | ||||
|---|---|---|---|---|
Apartments | $1,324 | 1% | No Change | |
Condos | $1,595 | No Change | No Change | |
Houses | $2,235 | 2% | No Change | |
Rooms | $840 | 3% | No Change |
Studio
Average rent
$950
Last 30 days
1%
Last year
17%
1 bedroom
Average rent
$1,154
Last 30 days
No Change
Last year
4%
2 bedroom
Average rent
$1,495
Last 30 days
No Change
Last year
4%
3 bedroom
Average rent
$2,195
Last 30 days
No Change
Last year
1%
4 bedroom
Average rent
$2,695
Last 30 days
5%
Last year
4%
Downtown Phoenix
Average rent
$1,954
Garfield
Average rent
$1,325
Kierland
Average rent
$3,484
Desert Ridge
Average rent
$3,595
Citrus Acres
Average rent
$1,205
La Mancha
Average rent
$1,350
Tramonto
Average rent
$2,300
Paradise Valley Oasis
Average rent
$2,295
Governmental Mall
Average rent
$1,195
Lakewood
Average rent
$1,865
Apartments
Average rent
$1,324
Last 30 days
1%
Condos
Average rent
$1,595
Last 30 days
No Change
Houses
Average rent
$2,235
Last 30 days
2%
Rooms
Average rent
$840
Last 30 days
3%
The table above reflects average rent prices in Phoenix, AZ, broken down by the number of bedrooms, neighborhoods, and property types. The availability of data for each category is dependent on market inventory and will adjust depending on your selected filters.
How does rent in Phoenix, AZ compare to other cities?
Compare median rent prices in Phoenix and Avondale by all bedroom counts and property types.
Phoenix
lower than the national median
lower than the national median
Takeaway
The median rent for all rentals in Phoenix, AZ is 12% lower than the median rent in Avondale, AZ.
Average rent in nearby cities
Explore rent trends in neighboring markets
$1,925
$2,343
$1,827
$1,897
$2,095
$8,000
$2,200
$3,000
$1,750
$2,095
$1,879
$2,050
Cost of living in Phoenix, AZ
Explore the cost of essential expenses, and then use our rent calculator to find out how much rent you can afford.
Expenses accrued by most renters | Average cost compared to national average |
|---|---|
| Goods & Services | No difference |
| Groceries | 3% higher |
| Health | 3% lower |
| Housing | 11% higher |
| Transportation | 10% higher |
| Utilities | 6% higher |
Discover rentals in Phoenix, AZ

5d+ ago
Downtown Phoenix house for rent in Phoenix
112 N Central Ave #M08, Phoenix, AZ 85004
Studio
0 baths
$399
House for rent

5d+ ago
Tramonto house for rent in Phoenix
34975 N North Valley Pkwy #152, Phoenix, AZ 85086
Studio
0 baths
$500
House for rent

5d+ ago
Apartment for rent in Phoenix
Studio
1 bath
$500
Apartment for rent

5d+ ago
Apartment for rent in Phoenix
1 bed
1 bath
$599
Apartment for rent


5d+ ago
House for rent in Phoenix
5632 N Camelback Canyon Dr, Phoenix, AZ 85018
5 beds
5.5 baths
$45,000
House for rent

5d+ ago
House for rent in Phoenix
4925 E Red Rock Dr #43, Phoenix, AZ 85018
5 beds
5.5 baths
$40,000
House for rent

5d+ ago
House for rent in Phoenix
5316 E Royal View Dr S, Phoenix, AZ 85018
5 beds
4.5 baths
$25,000
House for rent

5d+ ago
House for rent in Phoenix
4549 E Calle Tuberia, Phoenix, AZ 85018
4 beds
4.5 baths
$20,000
House for rent


2d ago
Verified
7750 W Encanto Blvd, Phoenix, AZ 85035
1–3 beds
1–2 baths
$1,234–$1,701
Apartment for rent

3d ago
Verified
3833 N 30th St, Phoenix, AZ 85016
2 beds
1 bath
$1,333–$3,103
Apartment for rent


9h ago
Verified
909 E Camelback Rd, Phoenix, AZ 85014
Studio–3 beds
1–2 baths
$1,320–$2,710
Price drop
Apartment for rent
Available Jun 29


12h ago
Verified
3211 E Pinchot Ave, Phoenix, AZ 85018
1 bed
1 bath
$999
Apartment for rent

12h ago
Verified
120 W Dobbins Rd, Phoenix, AZ 85041
1–2 beds
1 bath
$999–$1,345
Apartment for rent

13h ago
Verified
6333 N 12th St, Phoenix, AZ 85014
1–2 beds
1–2 baths
$1,150–$1,525
Apartment for rent

1d ago
Verified
1450 E Bell Rd, Phoenix, AZ 85022
1–3 beds
1–2 baths
$1,055–$2,992
Apartment for rent


2d ago
Verified
7750 W Encanto Blvd, Phoenix, AZ 85035
2 beds
1–2 baths
$1,485
Apartment for rent
3d ago
Verified
3833 N 30th St, Phoenix, AZ 85016
2 beds
1 bath
$1,333–$3,103
Apartment for rent
9h ago
Verified
909 E Camelback Rd, Phoenix, AZ 85014
Studio–3 beds
1–2 baths
$1,320–$2,710
Price drop
Apartment for rent
Available Jun 29


Stay up to date with rental market insights


Are you interested in licensing our current and historical rental real estate data, or do you have custom data requests? Contact datalicensing@zumper.com.
Frequently asked questions for Phoenix, AZ
Quick answers to common questions about the Phoenix rental market.
How much is rent in Phoenix?
The average rent in Phoenix is $1,699 per month as of June 27, 2026.
Is rent up or down in Phoenix?
Average rent prices in Phoenix have increased by 3% over the last month and have decreased by 5% since last year.
How does Phoenix rent compare to the national average?
Rent in Phoenix is 13% below the national average, which means renters are paying approximately $251 less per month.
Which neighborhoods are most affordable in Phoenix?
The most affordable neighborhoods in Phoenix are Governmental Mall ($1,195/mo), Citrus Acres ($1,205/mo), and Garfield ($1,325/mo).
What salary do I need to afford rent in Phoenix?
To comfortably afford rent in Phoenix, you'd need to earn approximately $68,000/year, based on spending no more than 30% of your income on rent.
When is the best time of year to rent in Phoenix?
Phoenix's 2025 rental market shows one-bedroom apartments averaging around $1,200 per month, while two-bedroom units rent for around $1,500 monthly. These figures reflect current pricing across the city's diverse neighborhoods and property types.
Methodology
Rent prices are based on Zumper's rental listings from the past 30 days. Median rent is calculated across all available listings and property types on the platform. If you filter the page by bedroom count or property type, the pricing throughout the page will update automatically to reflect that segment of the rental market.
Household and population data come from the U.S. Census Bureau. Cost-of-living data is sourced from the Council for Community and Economic Research's Cost of Living Index (COLI).
For additional insights into rental trends, including month-over-month changes and historical comparisons, see Zumper's Monthly Metro Report.
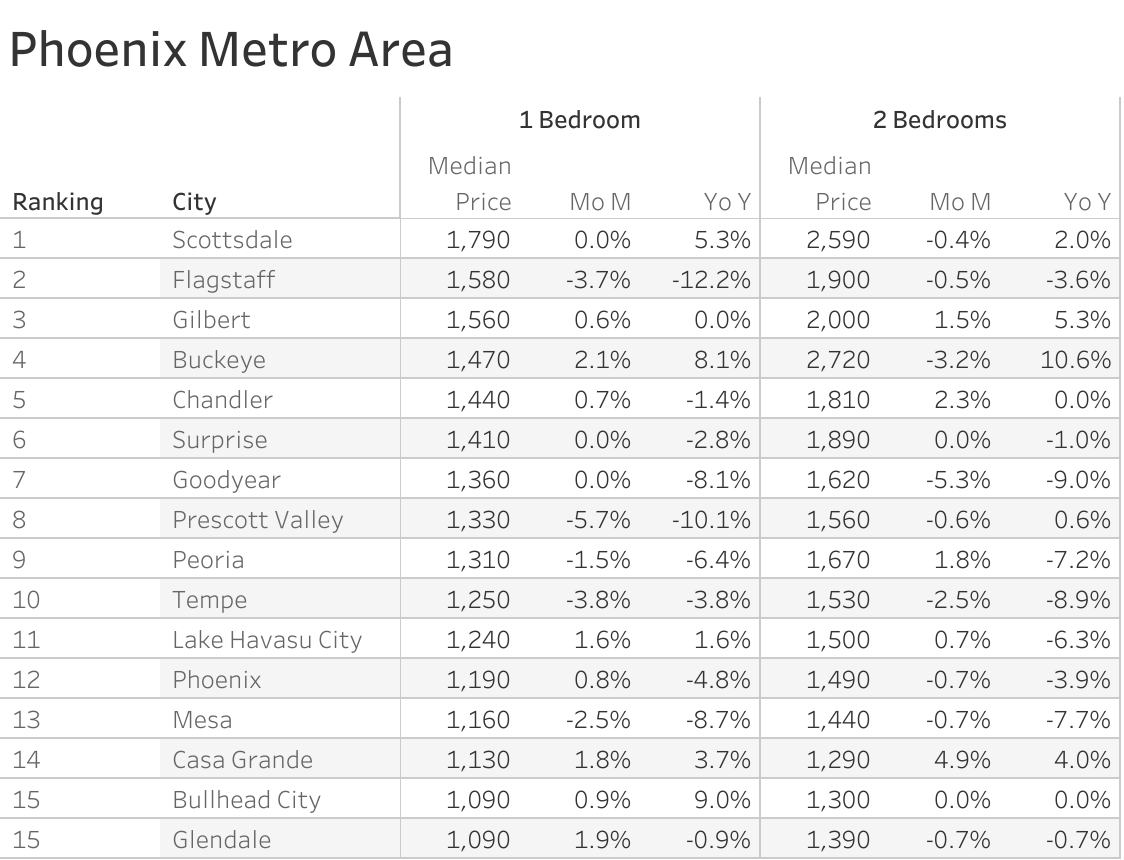
Phoenix Metro Report
The Zumper Phoenix Metro Report analyzed active listings last month across metro cities to reveal the most and least expensive cities, as well as those with the fastest growing rents. The Arizona one bedroom median rent was $1,231 last month.
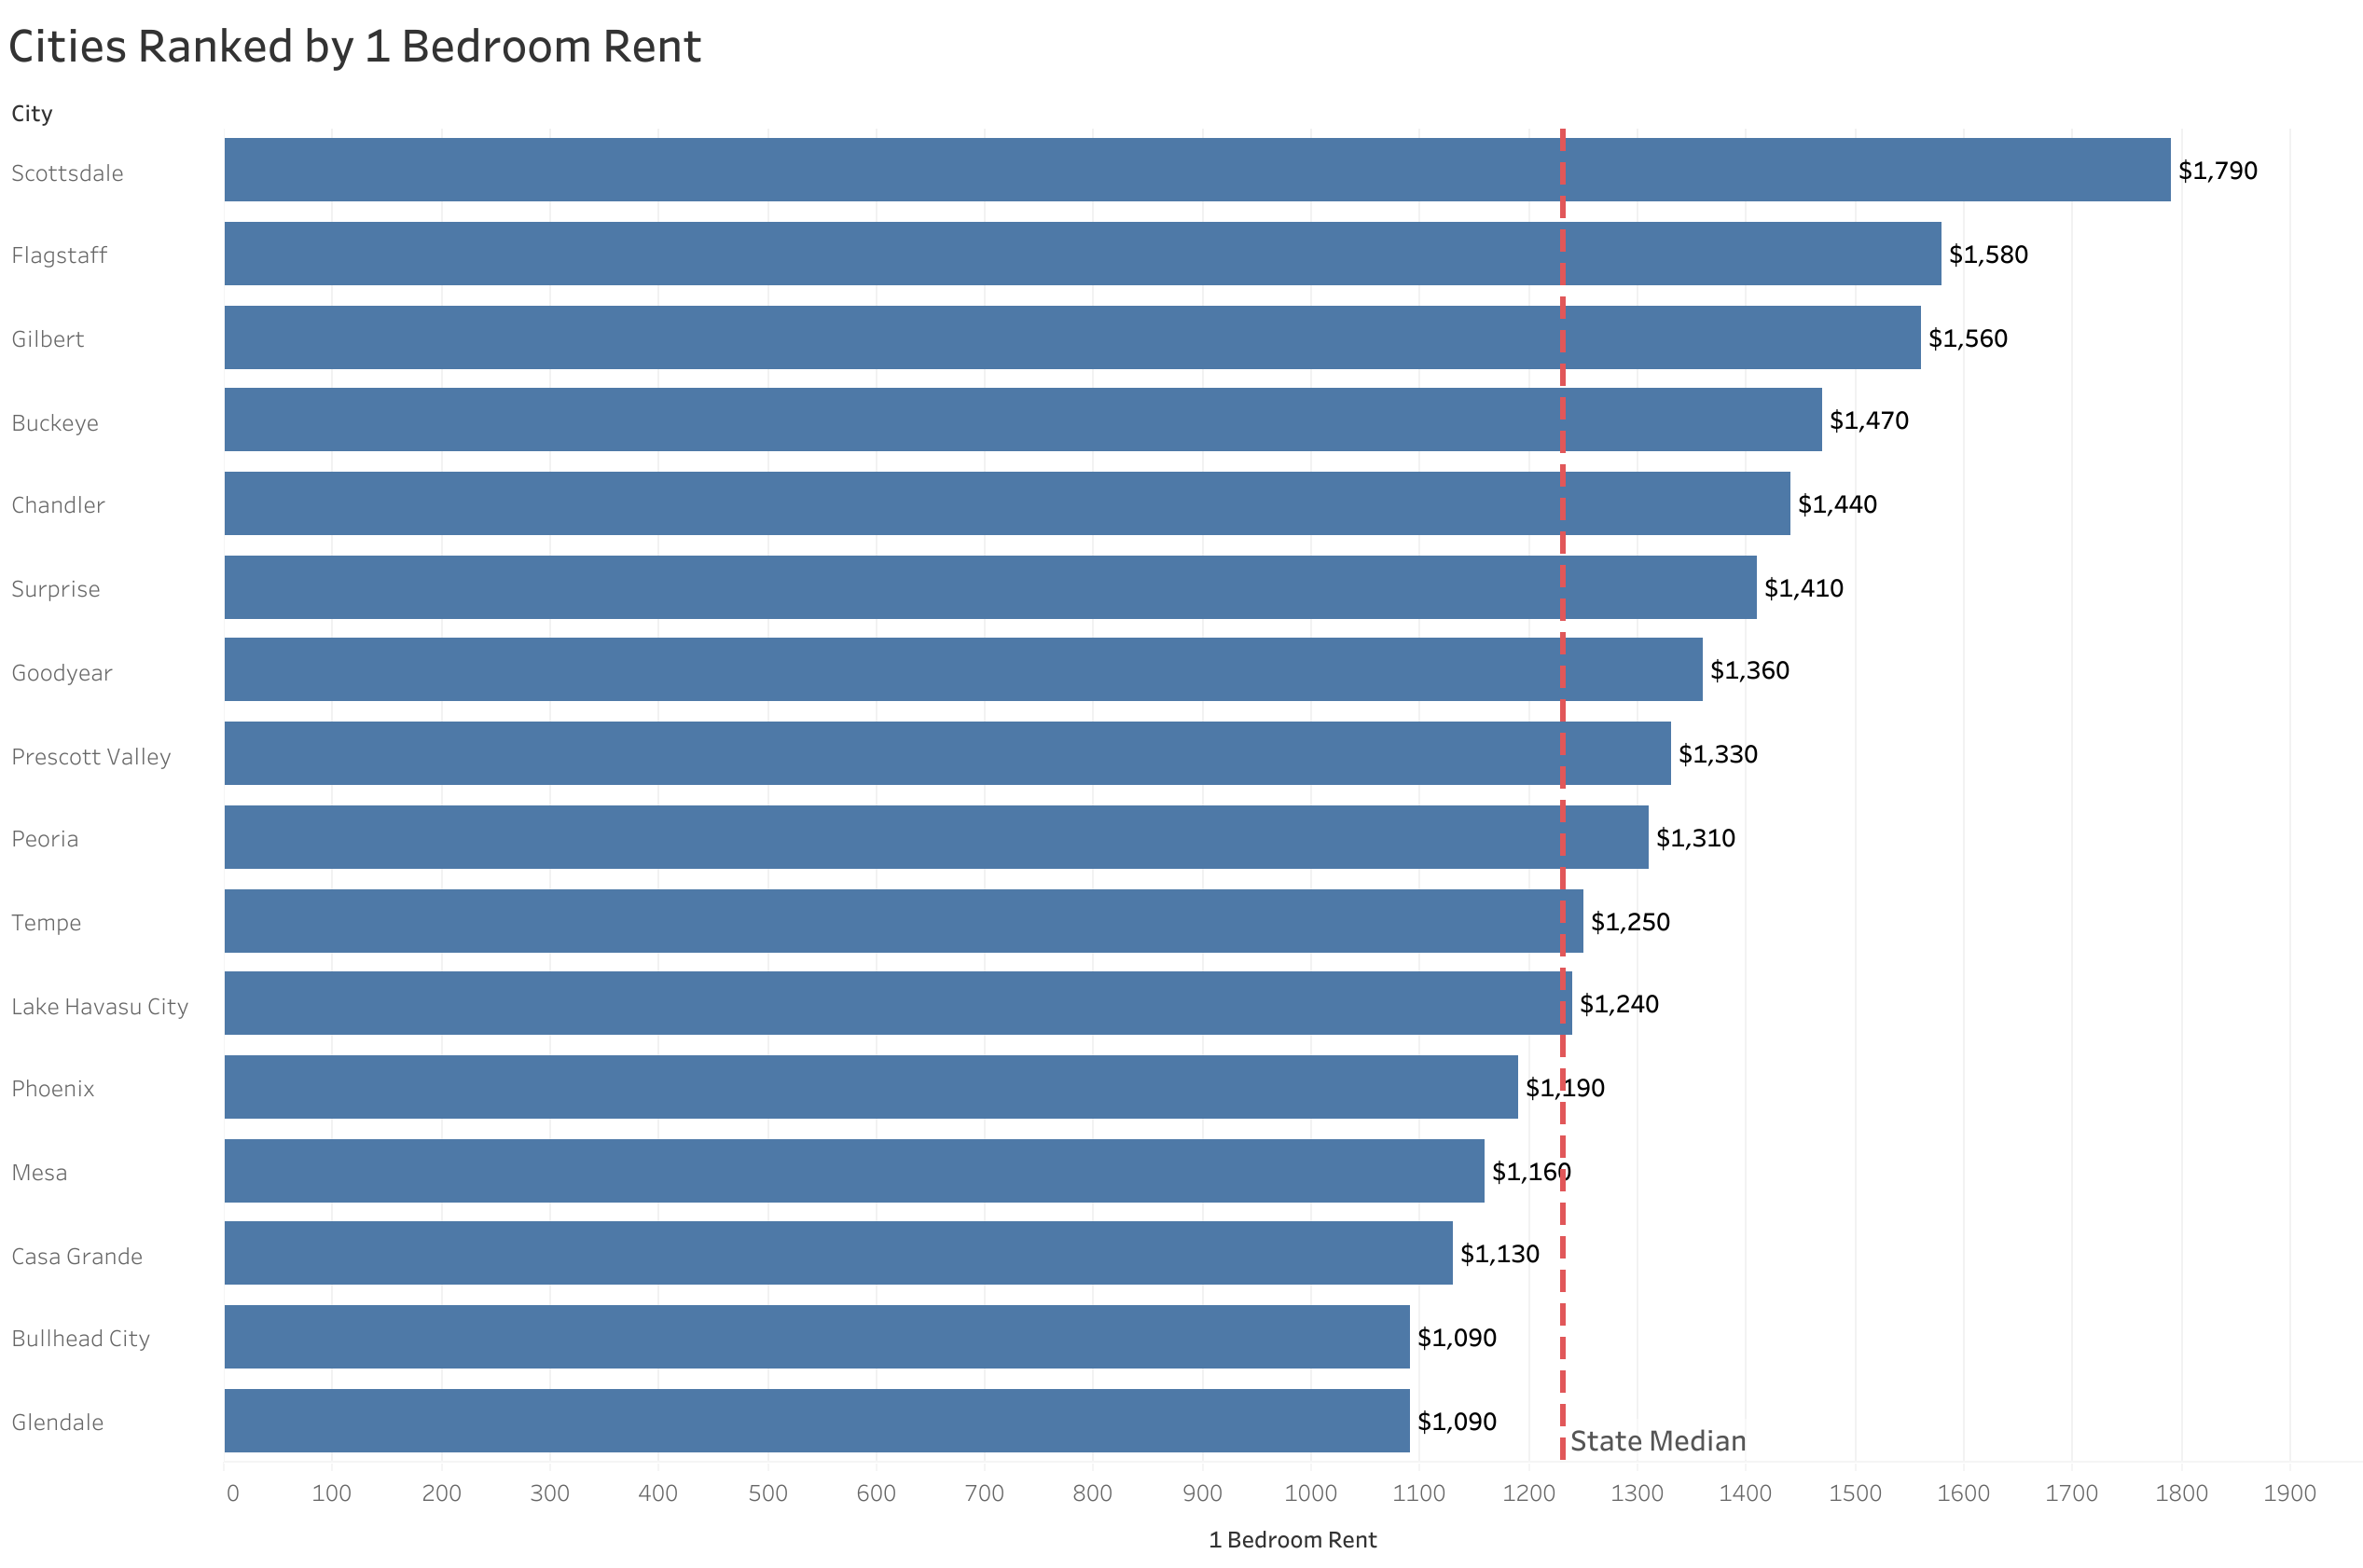
The Most Expensive
- Scottsdale was the most expensive city with one-bedrooms priced at $1,790.
- Flagstaff ranked as the second priciest with rent at $1,580.
- Gilbert placed third with rent at $1,560.
The Least Expensive
- Glendale & Bullhead City tied for the most affordable city with one-bedrooms both priced at $1,090.
- Casa Grande was the second least expensive with rent at $1,130.
- Mesa placed third with rent priced at $1,160.
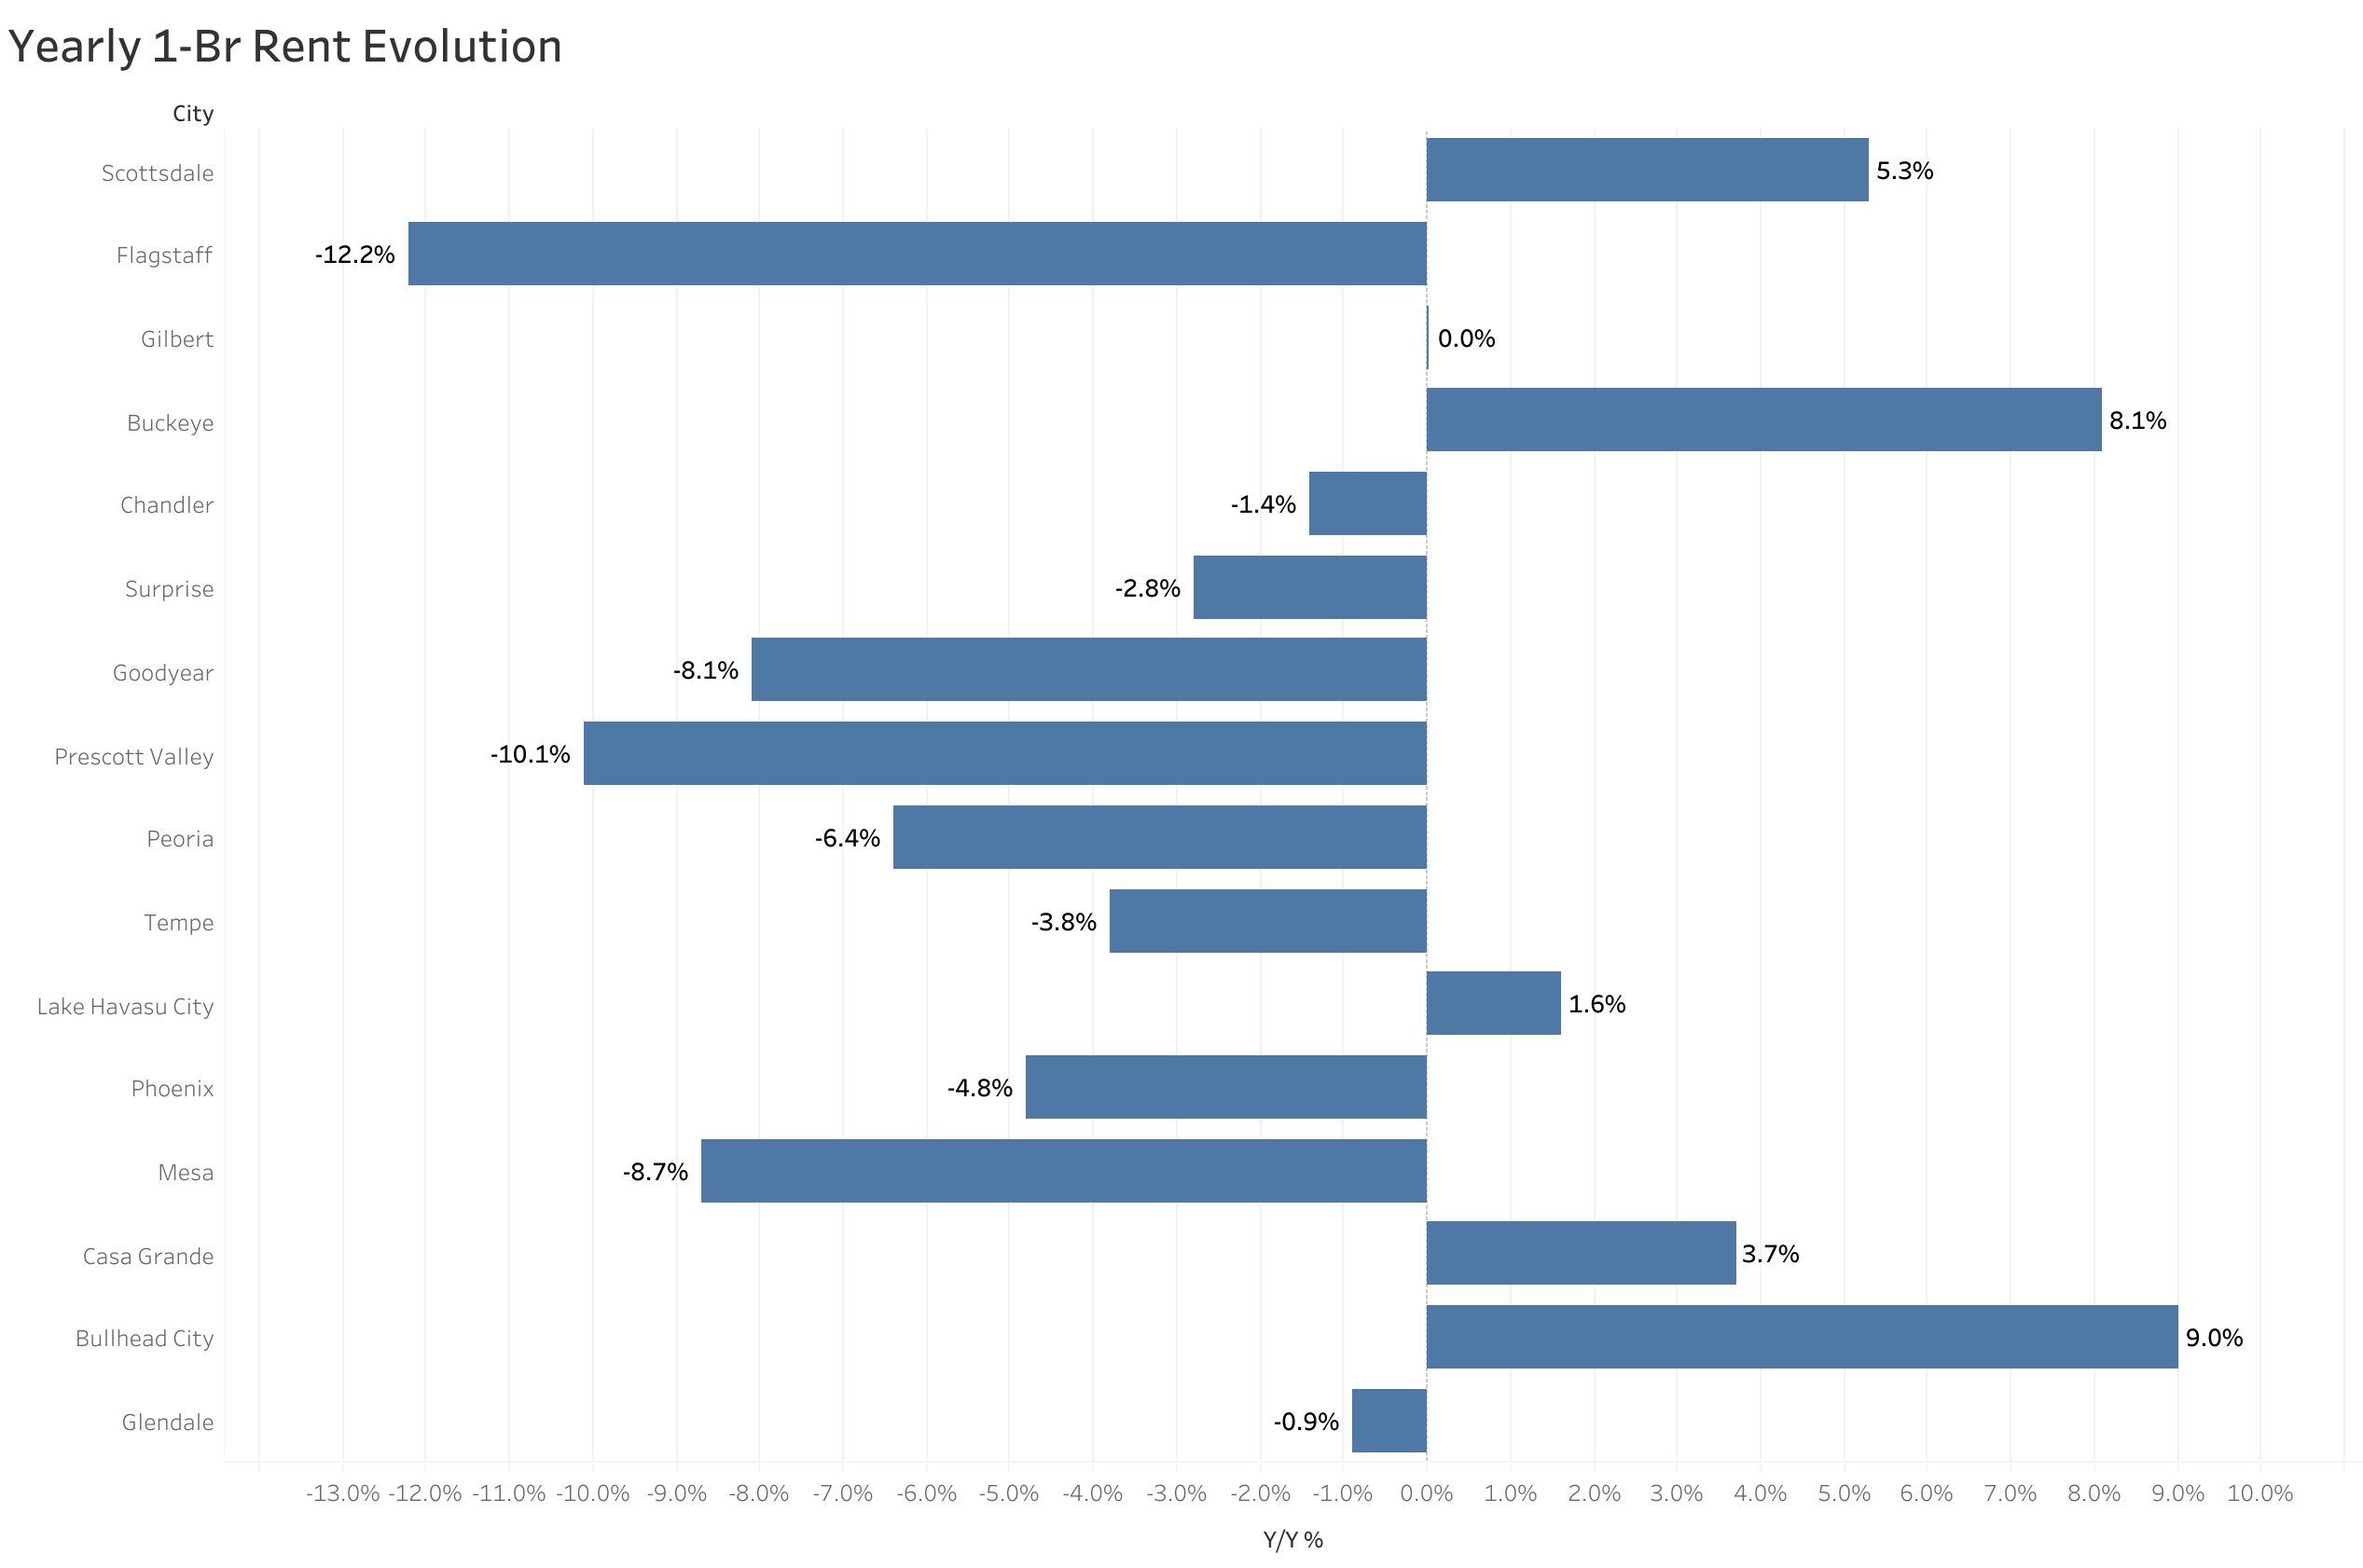
The Largest Decline (Y/Y%)
- Flagstaff had the largest annual rent price decline, falling 12.2%.
- Prescott Valley saw rent drop 10.1%, making it second.
- Mesa was third with rent decreasing 8.7%.
The Largest Decline (M/M%)
- Prescott Valley had the largest monthly rent price decline, down 5.7%.
- Tempe was second with rent dropping 3.8%.
- Flagstaff saw rent decrease 3.7% last month, making it third.
About
The Zumper Phoenix Metro Area Report analyzed active listings that hit the market last month. Listings are aggregated by city to calculate median asking rents.
Words by
Crystal ChenCrystal Chen is a seasoned real estate and housing market expert with more than a decade of experience analyzing rental trends, housing affordability, and urban living. At Zumper, she leads data storytelling as well as press and media relations, where she translates complex housing research into easily digestible insights for renters, industry professionals, and journalists. Her reports can be seen cited in national outlets like The New York Times, The Wall Street Journal, and CNBC. She is passionate about helping renters navigate today’s evolving housing landscape with clarity and confidence. Living in New York City herself, she knows firsthand the chaos and challenges of navigating a competitive rental market.