
Bedroom count
Property type
Last updated on June 28, 2026
Average rent in
San Francisco, CA
Average rent in
Last updated on June 28, 2026
Bedroom count
Property type
Key takeaways for renters
Where San Francisco rent stands today
San Francisco, CA rent rose 17.5% year over year, with a current median of $4,108/month. Renters are paying $725 more per month on average than last year, reaching the peak level of $4,377/month recorded this month after steady growth over two years.
Vs. national rents
San Francisco rents run roughly 2.1× the $1,950/month national median, placing it among the priciest major metros in the country. The market is tight with 492 total rentals, reflecting high demand and limited supply.
Rent ranges by bedroom
Studio rents in San Francisco sit around $2,608/month, 1-bedrooms at $3,995/month, and 2-bedrooms at $5,545/month, with 4+ bedrooms reaching $8,995/month. These figures show a wide range of rent levels by bedroom count.
Neighborhood spotlight
Presidio Heights saw rents climb 64.5% year over year to $6,700/month, while Cow Hollow rose 64.2% to $5,295/month. In contrast, Corona Heights rents fell 37.4% to $4,600/month, showing strong neighborhood divergence amid the citywide 17.5% rise.
Median rent
Median rent in San Francisco
$4,108/mo
vs previous year
The average rent in San Francisco is $4,108 per month as of June 2026. This is 111% above the national average rent, or $2,158 more per month.
average price per square foot
Total rentals
Available rentals in San Francisco
492
for rent on Zumper.com as of June 2026
Rent price distribution
Share of San Francisco rentals at each price point
Rent trends in San Francisco, CA
Average rent prices in San Francisco have increased by 2% over the last month and have increased by 18% since last year.
Rent trends
Rent prices on this page are calculated on a rolling 30-day basis and updated daily.
Compare rent prices in
San Francisco, CA
Rent prices in San Francisco vary by bedroom size, rental type, and neighborhood. The average rent for an apartment in San Francisco is $4,034, whereas a house costs $5,800. 1-bedroom apartments in San Francisco run $4,036 on average, while 2-bedroom apartments are $5,500.
Listings | ||||
|---|---|---|---|---|
Studio | $2,607 |  2% | 11% | |
1 bedroom | $3,995 | 3% | 19% | |
2 bedroom | $5,545 | 5% | 22% | |
3 bedroom | $7,000 | 3% | 27% | |
4 bedroom | $8,995 | 7% | 26% |
Listings | ||
|---|---|---|
Civic Center | $4,660 | |
Dogpatch | $4,850 | |
Downtown | $2,295 | |
Financial District | $970 | |
Hayes Valley | $4,495 | |
Mission | $3,800 | |
Pacific Heights | $5,350 | |
Soma | $4,915 | |
South Beach | $5,260 | |
Tenderloin | $1,875 |
Listings | ||||
|---|---|---|---|---|
Apartments | $4,034 | 2% | No Change | |
Condos | $4,950 | 8% | No Change | |
Houses | $5,800 | 6% | No Change | |
Rooms | $1,295 | 17% | No Change |
Studio
Average rent
$2,607
Last 30 days
2%
Last year
11%
1 bedroom
Average rent
$3,995
Last 30 days
3%
Last year
19%
2 bedroom
Average rent
$5,545
Last 30 days
5%
Last year
22%
3 bedroom
Average rent
$7,000
Last 30 days
3%
Last year
27%
4 bedroom
Average rent
$8,995
Last 30 days
7%
Last year
26%
Soma
Average rent
$4,915
South Beach
Average rent
$5,260
Dogpatch
Average rent
$4,850
Hayes Valley
Average rent
$4,495
Downtown
Average rent
$2,295
Civic Center
Average rent
$4,660
Tenderloin
Average rent
$1,875
Pacific Heights
Average rent
$5,350
Mission
Average rent
$3,800
Financial District
Average rent
$970
Apartments
Average rent
$4,034
Last 30 days
2%
Condos
Average rent
$4,950
Last 30 days
8%
Houses
Average rent
$5,800
Last 30 days
6%
Rooms
Average rent
$1,295
Last 30 days
17%
The table above reflects average rent prices in San Francisco, CA, broken down by the number of bedrooms, neighborhoods, and property types. The availability of data for each category is dependent on market inventory and will adjust depending on your selected filters.
How does rent in San Francisco, CA compare to other cities?
Compare median rent prices in San Francisco and Alameda by all bedroom counts and property types.
San Francisco
higher than the national median
higher than the national median
Takeaway
The median rent for all rentals in San Francisco, CA is 58% higher than the median rent in Alameda, CA.
Average rent in nearby cities
Explore rent trends in neighboring markets
$2,600
$2,500
$2,872
$2,600
$3,307
$2,230
$2,709
$2,497
$2,273
$3,500
$2,950
$3,300
Cost of living in San Francisco, CA
Explore the cost of essential expenses, and then use our rent calculator to find out how much rent you can afford.
Expenses accrued by most renters | Average cost compared to national average |
|---|---|
| Goods & Services | 21% higher |
| Groceries | 16% higher |
| Health | 24% higher |
| Housing | 156% higher |
| Transportation | 41% higher |
| Utilities | 47% higher |
Discover rentals in San Francisco, CA

5d+ ago
Tenderloin apartment for rent in San Francisco
345 Taylor St Ofc 3, San Francisco, CA 94102
Studio
0 baths
$499
Apartment for rent
Available Mar 1

5d+ ago
Tenderloin apartment for rent in San Francisco
345 Taylor St Ofc 4, San Francisco, CA 94102
Studio
0 baths
$499
Apartment for rent
Available Mar 1

5d+ ago
Telegraph Hill apartment for rent in San Francisco
Studio
1 bath
$600
Apartment for rent
Available May 15

5d+ ago
Tenderloin apartment for rent in San Francisco
345 Taylor St Ofc 5, San Francisco, CA 94102
Studio
0 baths
$649
Apartment for rent
Available Mar 1


5d+ ago
SOMA condo for rent in San Francisco
3 beds
3 baths
$30,000
Condo for rent
Available Jun 1

5d+ ago
Pacific Heights condo for rent in San Francisco
4 beds
3 baths
$24,950
Condo for rent
Available Jul 1

1d ago
Nob Hill apartment for rent in San Francisco
Pacific Avenue & Phoenix Terrace, San Francisco, CA 94133
5 beds
4.5 baths
$24,000
Apartment for rent

5d+ ago
Mission house for rent in San Francisco
1160 Florida St, San Francisco, CA 94110
4 beds
4 baths
$22,500
House for rent


1d ago
Verified
149 San Francisco New Montgomery St, San Francisco, CA 94105
Studio–3 beds
1–2 baths
$3,020–$18,480
House for rent

1d ago
Verified
77 Bluxome St, San Francisco, CA 94107
Studio
1 bath
$2,500–$2,670
Apartment for rent

8h ago
Verified
2665 Geneva Ave, San Francisco, CA 94014
1–3 beds
1–2 baths
$4,230
Apartment for rent


5d+ ago
Verified
1200 Sacramento Street, San Francisco, CA 94108
Studio
1 bath
$2,000
Apartment for rent
Available Oct 1

14h ago
Verified
530 Brannan St, San Francisco, CA 94107
Studio–1 bed
1–2 baths
$3,919–$5,147
Apartment for rent


2d ago
Verified
3421 25th St #7, San Francisco, CA 94110
2 beds
1 bath
$5,154
$4,895
Price drop
Condo for rent
Available Aug 7


8h ago
Verified
2665 Geneva Ave, San Francisco, CA 94014
1–3 beds
1–2 baths
$4,230
Apartment for rent
21h ago
Verified
800 Indiana St, San Francisco, CA 94107
Studio–3 beds
1–2 baths
$4,215–$6,695
Price drop
Apartment for rent

2d ago
Verified
916 Pacific Ave, San Francisco, CA 94133
1 bed
1 bath
$3,695
Apartment for rent


Stay up to date with rental market insights


Are you interested in licensing our current and historical rental real estate data, or do you have custom data requests? Contact datalicensing@zumper.com.
Frequently asked questions for San Francisco, CA
Quick answers to common questions about the San Francisco rental market.
How much is rent in San Francisco?
The average rent in San Francisco is $4,108 per month as of June 27, 2026.
Is rent up or down in San Francisco?
Average rent prices in San Francisco have increased by 2% over the last month and have increased by 18% since last year.
How does San Francisco rent compare to the national average?
Rent in San Francisco is 111% above the national average, which means renters are paying approximately $2,158 more per month.
Which neighborhoods are most affordable in San Francisco?
The most affordable neighborhoods in San Francisco are Financial District ($970/mo), Tenderloin ($1,875/mo), and Downtown ($2,295/mo).
What salary do I need to afford rent in San Francisco?
To comfortably afford rent in San Francisco, you'd need to earn approximately $164,000/year, based on spending no more than 30% of your income on rent.
When is the best time of year to rent in San Francisco?
San Francisco's 2025 rental market shows one-bedroom apartments averaging around $3,400 per month, while two-bedroom units command around $4,700 monthly. These figures reflect the city's position as a major tech hub with strong rental demand across different apartment sizes.
Methodology
Rent prices are based on Zumper's rental listings from the past 30 days. Median rent is calculated across all available listings and property types on the platform. If you filter the page by bedroom count or property type, the pricing throughout the page will update automatically to reflect that segment of the rental market.
Household and population data come from the U.S. Census Bureau. Cost-of-living data is sourced from the Council for Community and Economic Research's Cost of Living Index (COLI).
For additional insights into rental trends, including month-over-month changes and historical comparisons, see Zumper's Monthly Metro Report.
San Francisco Bay Area Metro Report
The Zumper San Francisco Bay Area Metro Report analyzed active listings last month across metro cities to show the most and least expensive cities and cities with the fastest growing rents. The California one-bedroom median rent was $2,050 last month.
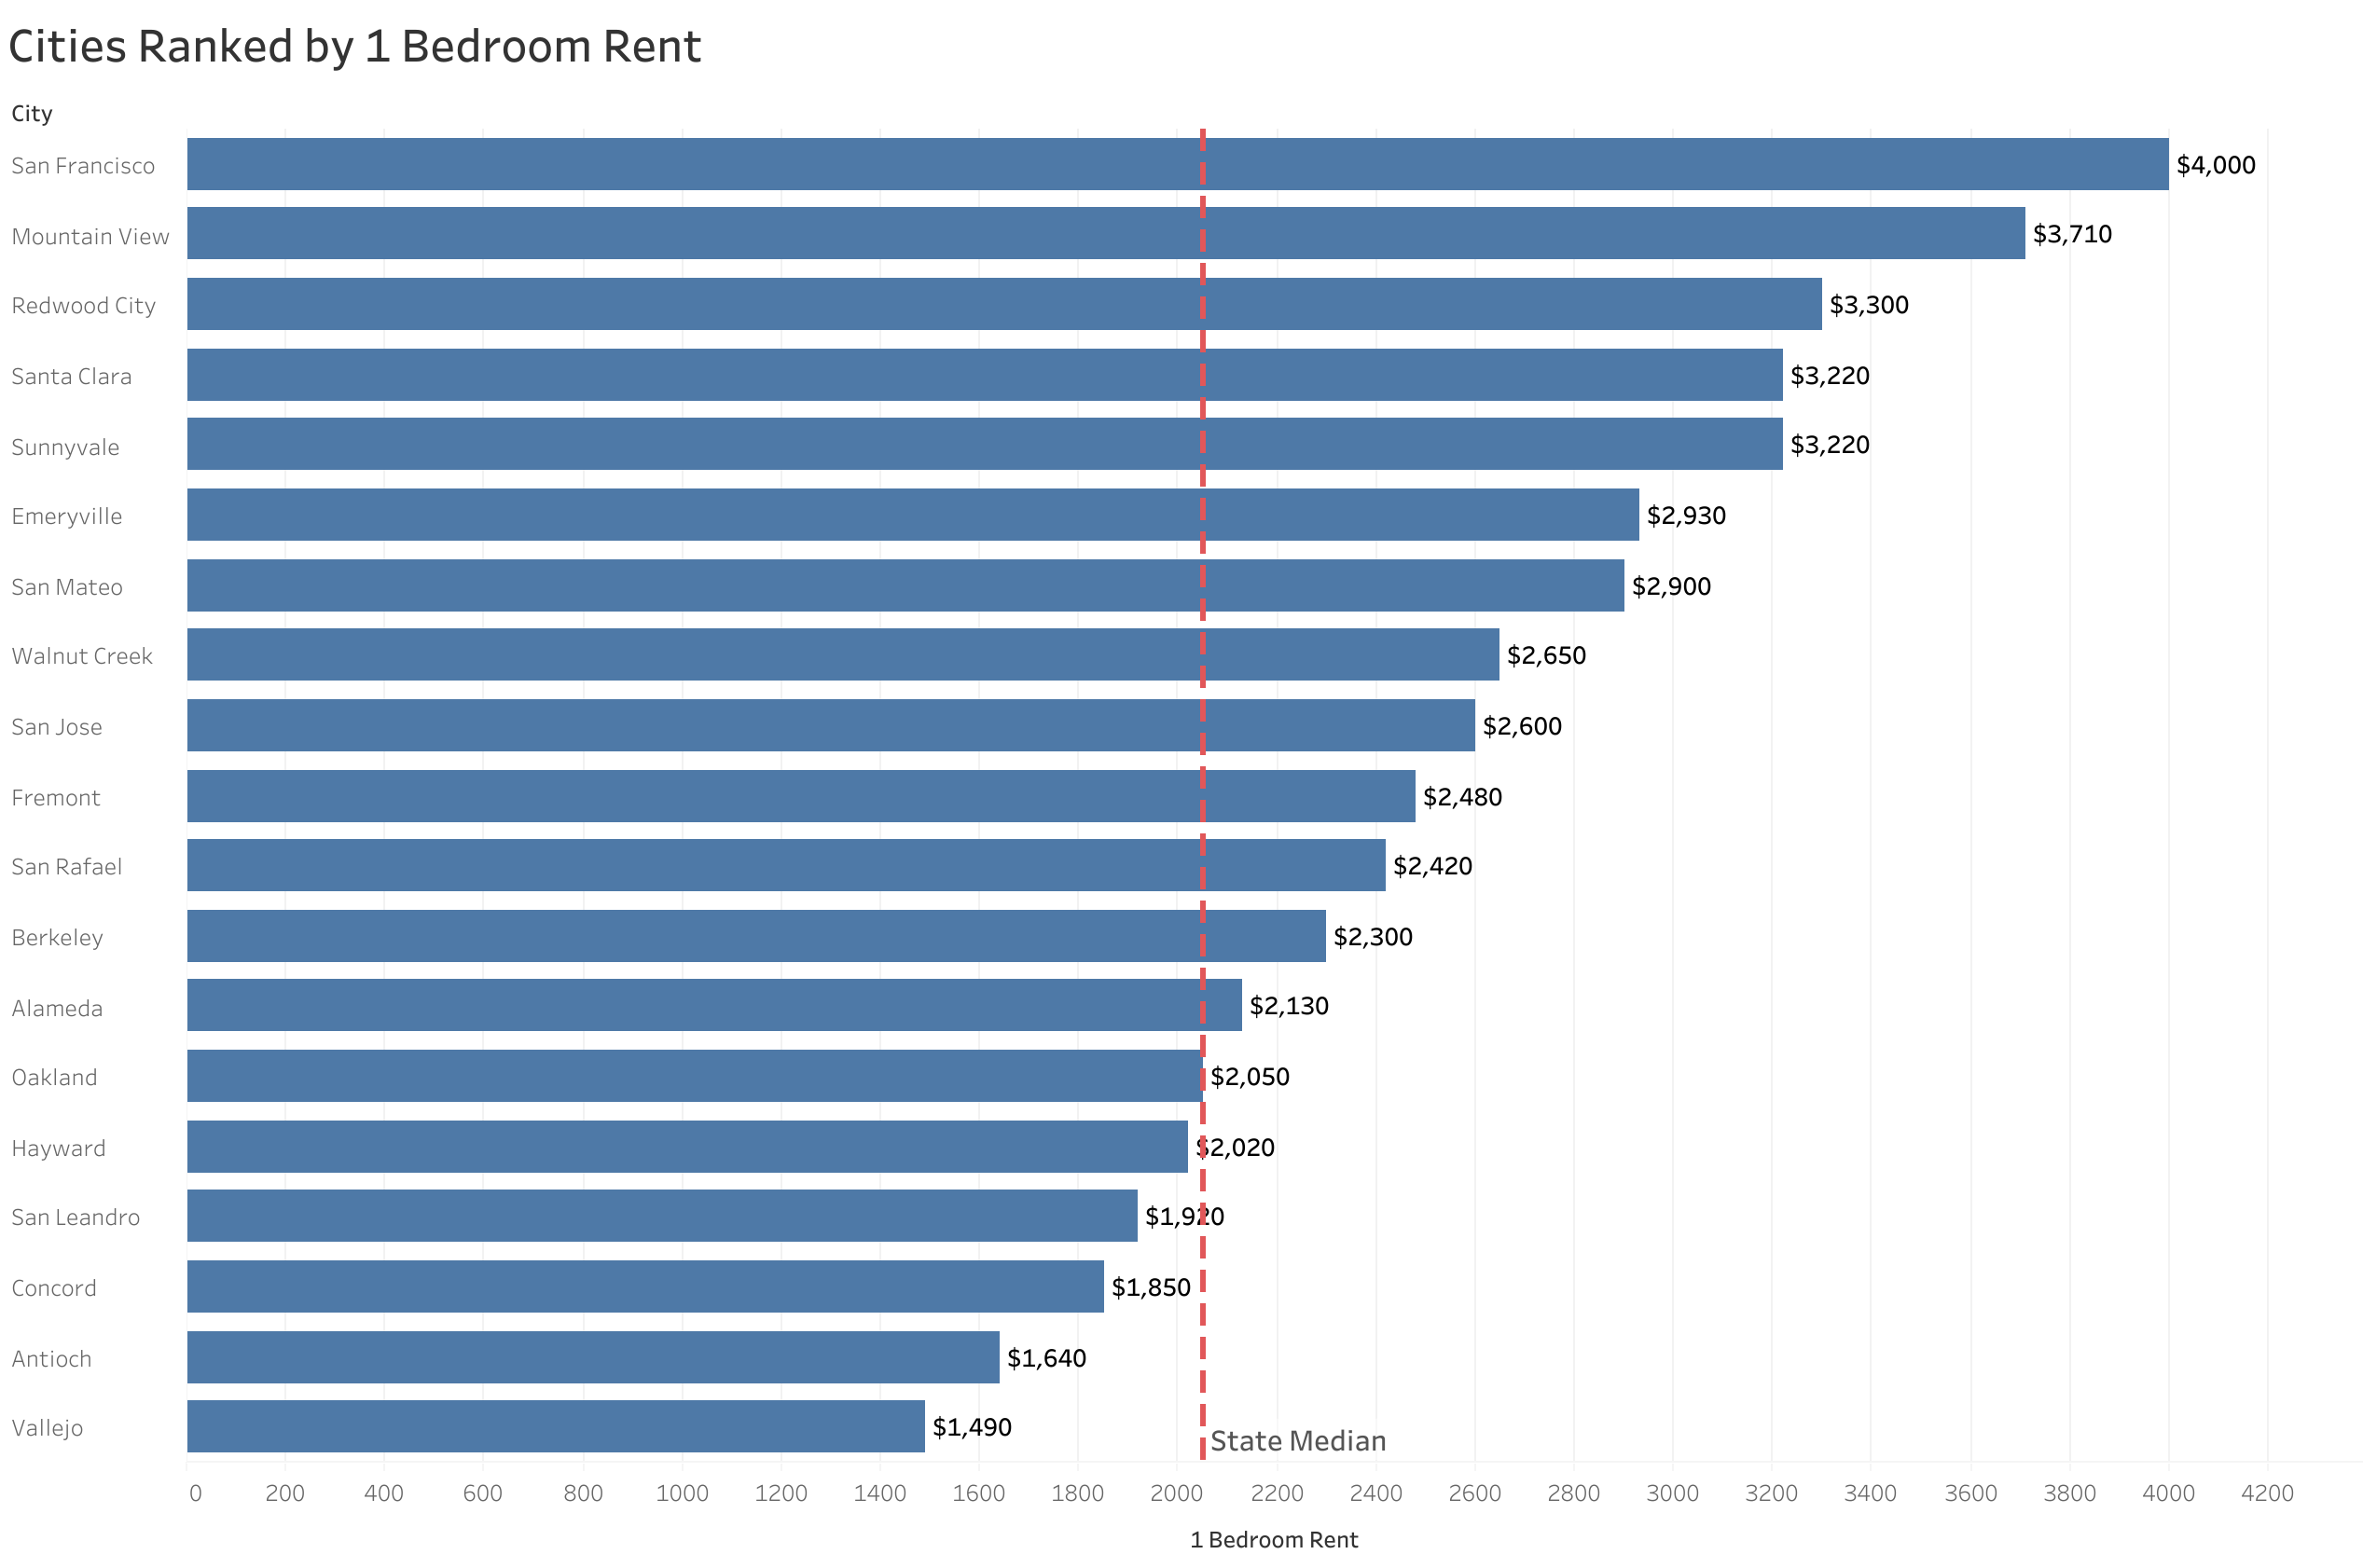
The Most Expensive
- San Francisco ranked as the most expensive city with one-bedrooms priced at $4,000.
- Mountain View was the second priciest with rent at $3,710.
- Redwood City placed third with rent at $3,300.
The Least Expensive
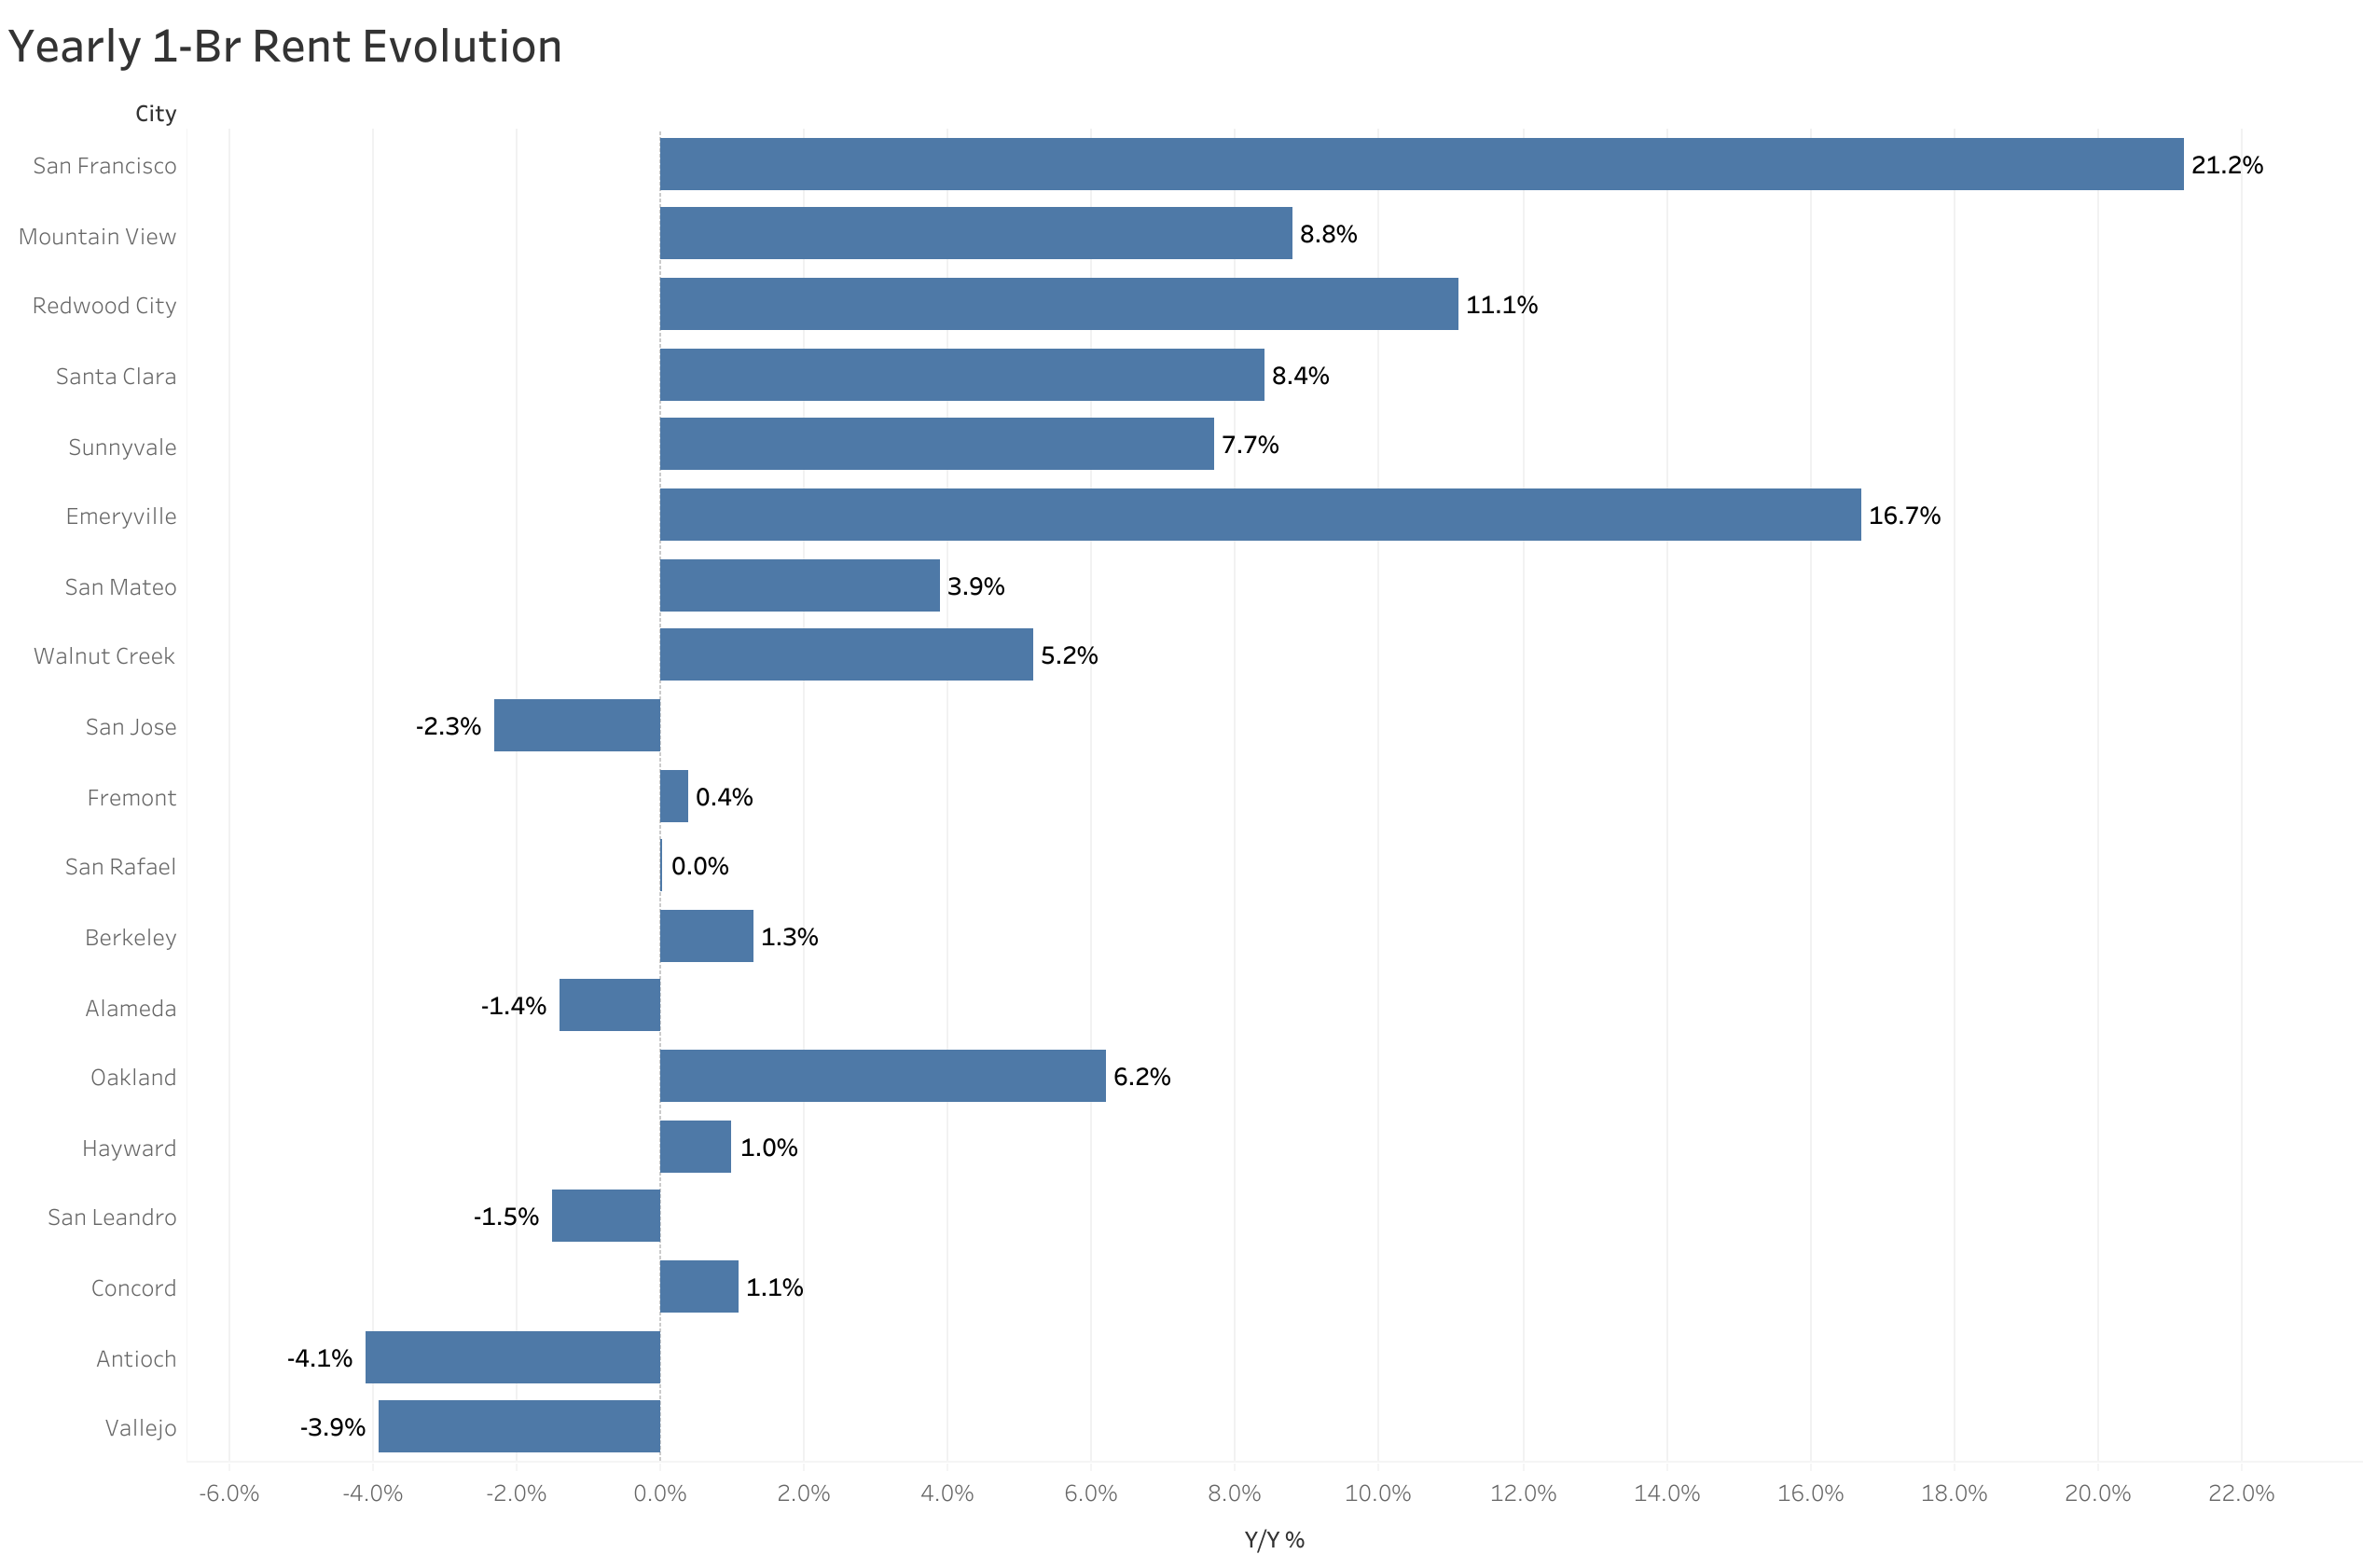
The Fastest Growing (Y/Y%)
- San Francisco continued to have the fastest growing rent, up 21.2% since this time last year.
- Emeryville saw rent climb 16.7%, making it the second fastest growing.
- Redwood City was third with rent increasing 11.1%.
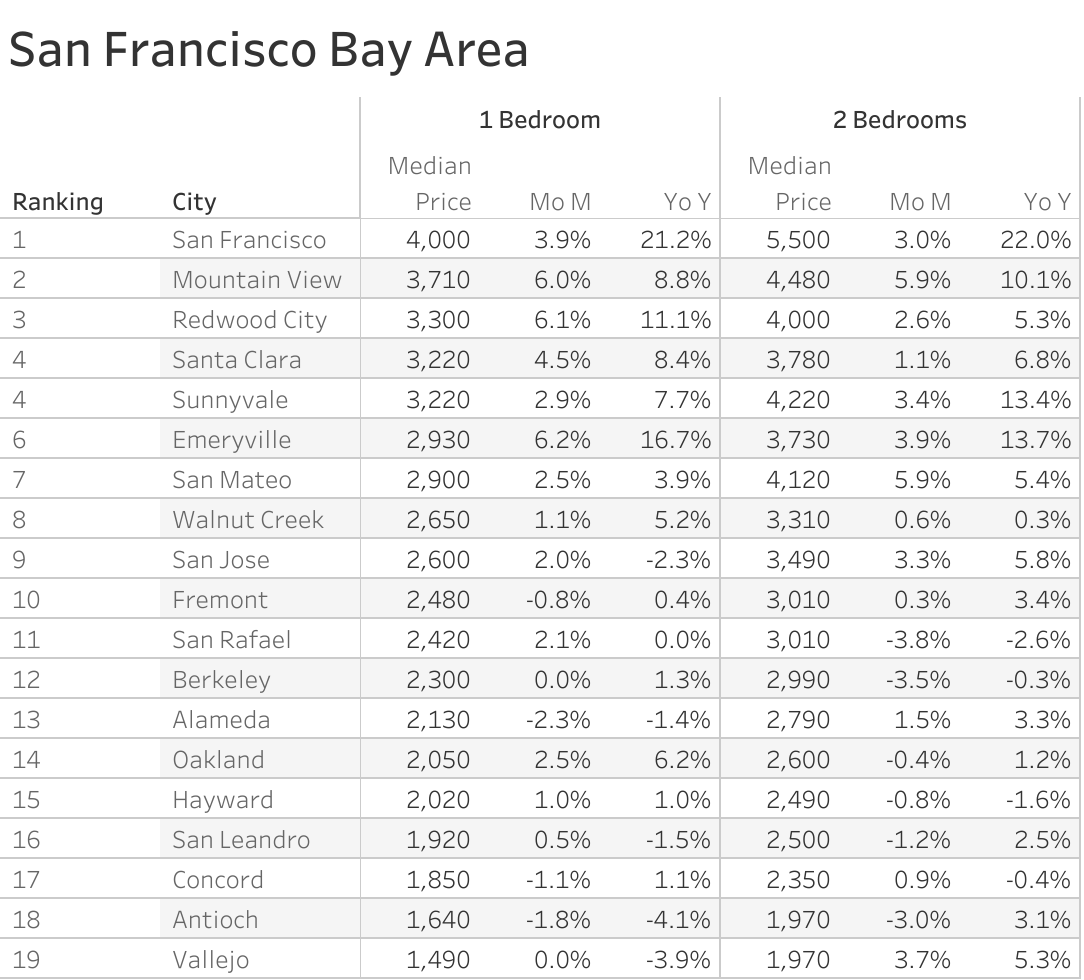
The Fastest Growing (M/M%)
- Emeryville had the largest monthly growth rate, up 6.2%.
- Redwood City saw rent jump 6.1%, making it second.
- Mountain View ranked as third with rent climbing 6% last month.
About
The Zumper San Francisco Bay Area Metro Area Report analyzed active listings that hit the market last month. Listings are aggregated by city to calculate median asking rents.
Words by
Crystal ChenCrystal Chen is a seasoned real estate and housing market expert with more than a decade of experience analyzing rental trends, housing affordability, and urban living. At Zumper, she leads data storytelling as well as press and media relations, where she translates complex housing research into easily digestible insights for renters, industry professionals, and journalists. Her reports can be seen cited in national outlets like The New York Times, The Wall Street Journal, and CNBC. She is passionate about helping renters navigate today’s evolving housing landscape with clarity and confidence. Living in New York City herself, she knows firsthand the chaos and challenges of navigating a competitive rental market.