
Bedroom count
Property type
Last updated on July 30, 2026
Average rent in
Merritt, Oakland, CA
Average rent in
Last updated on July 30, 2026
Bedroom count
Property type
Median rent
Median rent in Merritt
$1,860/mo
vs previous year
The average rent in Merritt is $1,860 per month as of July 2026. This is 4% below the national average rent, or $70 less per month.
average price per square foot
Total rentals
Available rentals in Merritt
14
for rent on Zumper.com as of July 2026
Rent price distribution
Share of Merritt rentals at each price point
This report has limited data.Due a shortage of data for this selected bedroom and/or property type in Merritt, Oakland, CA, in the last 30 days, rent estimates may not represent the actual market.
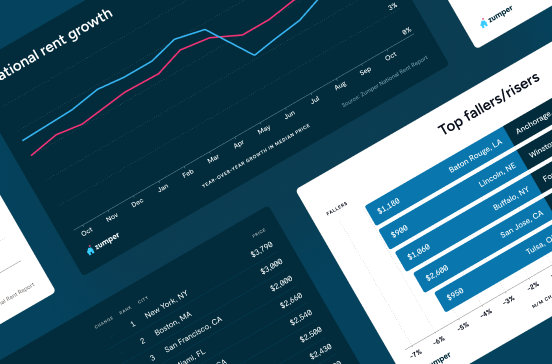
Rent trends in Merritt, Oakland, CA
Average rent prices in Merritt have remained the same over the last month and have increased by 6% since last year.
Rent trends
Rent prices on this page are calculated on a rolling 30-day basis and updated daily.
Compare rent prices in
Merritt, Oakland, CA
Rent prices in Merritt vary by bedroom size, rental type, and neighborhood. The average rent for an apartment in Merritt is $1,895, whereas a house costs $2,439. 1-bedroom apartments in Merritt run $1,795 on average, while 2-bedroom apartments are $2,250.
Listings | ||||
|---|---|---|---|---|
Studio | $1,710 |  3% | 41% | |
1 bedroom | $1,810 | 4% | 8% | |
2 bedroom | $3,109 | 9% | 37% | |
3 bedroom | $3,100 | 2% | - | |
4 bedroom | $3,800 | 9% | - |
Listings | ||
|---|---|---|
Adams Point | $2,095 | |
Cleveland Heights | $2,095 | |
Downtown Oakland | $2,666 | |
Hoover Foster | $2,350 | |
Northgate Waverly | $2,515 | |
Oakland Ave Harrison St | $2,715 |
Listings | ||||
|---|---|---|---|---|
Apartments | $1,895 | 7% | No Change | |
Condos | $1,850 | 40% | - | |
Houses | $2,439 | 10% | 75% |
Studio
Average rent
$1,710
Last 30 days
3%
Last year
41%
1 bedroom
Average rent
$1,810
Last 30 days
4%
Last year
8%
2 bedroom
Average rent
$3,109
Last 30 days
9%
Last year
37%
3 bedroom
Average rent
$3,100
Last 30 days
2%
4 bedroom
Average rent
$3,800
Last 30 days
9%
Adams Point
Average rent
$2,095
Cleveland Heights
Average rent
$2,095
Downtown Oakland
Average rent
$2,666
Hoover Foster
Average rent
$2,350
Northgate Waverly
Average rent
$2,515
Oakland Ave Harrison St
Average rent
$2,715
Apartments
Average rent
$1,895
Last 30 days
7%
Condos
Average rent
$1,850
Last 30 days
40%
Houses
Average rent
$2,439
Last 30 days
10%
Last year
75%
The table above reflects average rent prices in Merritt, Oakland, CA, broken down by the number of bedrooms, neighborhoods, and property types. The availability of data for each category is dependent on market inventory and will adjust depending on your selected filters.
How does rent in Merritt, Oakland, CA compare to other neighborhoods?
Compare median rent prices in Merritt and Adams Point by all bedroom counts and property types.
Merritt
lower than the national median
higher than the national median
Takeaway
The median rent for all rentals in Merritt, Oakland, CA is 11% lower than the median rent in Adams Point, Oakland, CA.
Average rent in nearby neighborhoods
Explore rent trends in neighboring markets
Discover rentals in Merritt, Oakland, CA

5d+ ago
Merritt apartment for rent in Oakland
324 International Blvd #324, Oakland, CA 94606
3 beds
1.5 baths
$3,500
Apartment for rent
Available Jun 6

1d ago
Merritt apartment for rent in Oakland
1438 4th Ave, Oakland, CA 94606
4 beds
1 bath
$3,750
Apartment for rent
Available Jul 28

5d+ ago
Merritt townhouse for rent in Oakland
1018 4th Ave #1, Oakland, CA 94606
1 bed
1 bath
$3,075
$2,850
Price drop
House for rent
Available Jul 20

1d ago
239 Foothill Blvd, Oakland, CA 94606
1 bed
1 bath
$2,500
Apartment for rent

2h ago
Merritt apartment for rent in Oakland
323 E 15th St #325, Oakland, CA 94606
1 bed
1 bath
$2,385
Apartment for rent

4d ago
Merritt apartment for rent in Oakland
1 bed
1 bath
$1,945
Apartment for rent
Available Jun 24


2d ago
Verified
1600 3rd Ave, Oakland, CA 94606
Studio
1 bath
$1,595
Apartment for rent
2h ago
Merritt apartment for rent in Oakland
323 E 15th St #325, Oakland, CA 94606
1 bed
1 bath
$2,385
Apartment for rent
5d+ ago
Merritt townhouse for rent in Oakland
1018 4th Ave #1, Oakland, CA 94606
1 bed
1 bath
$3,075
$2,850
Price drop
House for rent
Available Jul 20
2d ago
Verified
1600 3rd Ave, Oakland, CA 94606
Studio
1 bath
$1,595
Apartment for rent

5d+ ago
1640 5th Ave, Oakland, CA 94606
1 bed
1 bath
$1,750–$1,795
Apartment for rent

1d ago
1530 6th Ave, Oakland, CA 94606
1 bed
1 bath
$1,795
Price drop
Apartment for rent
1d ago
Merritt apartment for rent in Oakland
1438 4th Ave, Oakland, CA 94606
4 beds
1 bath
$3,750
Apartment for rent
Available Jul 28


1d ago
1530 6th Ave, Oakland, CA 94606
1 bed
1 bath
$1,795
Price drop
Apartment for rent
1d ago
411 E 17th St, Oakland, CA 94606
1 bed
1 bath
$1,725
Apartment for rent
4d ago
1607 2nd Ave, Oakland, CA 94606
Studio
1 bath
$1,495
Apartment for rent
4d ago
1435 3rd Ave, Oakland, CA 94606
1 bed
1 bath
$1,745
Apartment for rent
Stay up to date with rental market insights

Are you interested in licensing our current and historical rental real estate data, or do you have custom data requests? Contact datalicensing@zumper.com.
Frequently asked questions for Merritt, Oakland, CA
Quick answers to common questions about the Merritt rental market.
How much is rent in Merritt?
The average rent in Merritt is $1,860 per month as of July 25, 2026.
Is rent up or down in Merritt?
Average rent prices in Merritt have remained the same over the last month and have increased by 6% since last year.
How does Merritt rent compare to the national average?
Rent in Merritt is 4% below the national average, which means renters are paying approximately $70 less per month.
What salary do I need to afford rent in Merritt?
To comfortably afford rent in Merritt, you'd need to earn approximately $74,000/year, based on spending no more than 30% of your income on rent.
Methodology
Rent prices are based on Zumper's rental listings from the past 30 days. Median rent is calculated across all available listings and property types on the platform. If you filter the page by bedroom count or property type, the pricing throughout the page will update automatically to reflect that segment of the rental market.
Household and population data come from the U.S. Census Bureau. Cost-of-living data is sourced from the Council for Community and Economic Research's Cost of Living Index (COLI).