
Bedroom count
Property type
Last updated on July 30, 2026
Average rent in
Miami Beach, FL
Average rent in
Last updated on July 30, 2026
Bedroom count
Property type
Key takeaways for renters
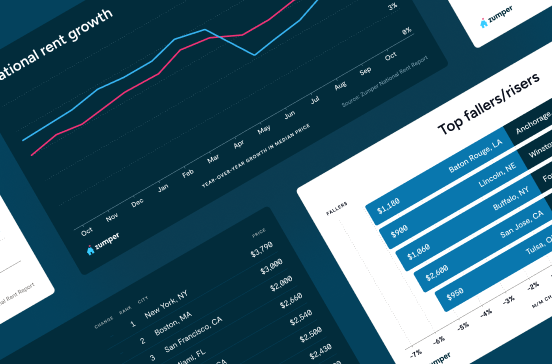
Where Miami Beach rent stands today
Miami Beach, FL rent rose 8.7% year over year, with a current median of $3,422/month. Renters today are paying $942 more per month on average than last year despite a recent 2.8% month-over-month decline from the peak in June 2026.
Vs. national rents
Miami Beach runs roughly 1.8× the $1,930/month national median, placing it among the pricier coastal metros. The market offers 1,964 total rentals with a high average price per square foot of $2.61.
Rent ranges by bedroom
Studios in Miami Beach rent for about $1,900/month, 1-bedrooms for $2,600/month, and 2-bedrooms for $4,600/month, with 3-bedrooms at $10,000/month and 4+ bedrooms at $27,500/month. These figures reflect the wide range of rental options by bedroom count.
Neighborhood spotlight
Nautilus rents climbed 144.5% year over year to $25,000/month across 20 rentals, while Star Palm And Hibiscus Islands rose 50.0% to $37,500/month. In contrast, Biscayne Point cooled 72.4% to $2,900/month and Beach View fell 56.2% to $7,000/month. These shifts contrast with the citywide 8.7% rise and show strong local variation.
Median rent
Median rent in Miami Beach
$3,422/mo
vs previous year
The average rent in Miami Beach is $3,422 per month as of July 2026. This is 77% above the national average rent, or $1,492 more per month.
average price per square foot
Total rentals
Available rentals in Miami Beach
1,964
for rent on Zumper.com as of July 2026
Rent price distribution
Share of Miami Beach rentals at each price point
Rent trends in Miami Beach, FL
Average rent prices in Miami Beach have decreased by 3% over the last month and have increased by 9% since last year.
Rent trends
Rent prices on this page are calculated on a rolling 30-day basis and updated daily.
Compare rent prices in
Miami Beach, FL
Rent prices in Miami Beach vary by bedroom size, rental type, and neighborhood. The average rent for an apartment in Miami Beach is $2,400, whereas a house costs $9,950. 1-bedroom apartments in Miami Beach run $2,200 on average, while 2-bedroom apartments are $3,500.
Listings | ||||
|---|---|---|---|---|
Studio | $1,900 |  2% |  3% | |
1 bedroom | $2,600 | 2% | 7% | |
2 bedroom | $4,600 | 3% | 18% | |
3 bedroom | $10,000 | 6% | 4% | |
4 bedroom | $27,500 | 3% | No Change |
Listings | ||
|---|---|---|
Altos Del Mar South | $1,800 | |
Bayshore | $4,500 | |
Biscayne Beach | $2,275 | |
City Center | $3,500 | |
Flamingo Lummus | $2,250 | |
Normandy Isles | $2,200 | |
Oceanfront | $4,500 | |
South Pointe | $6,500 | |
Venetian Islands | $7,400 | |
West Avenue | $3,500 |
Listings | ||||
|---|---|---|---|---|
Apartments | $2,400 | 13% | No Change | |
Condos | $3,700 | 2% | No Change | |
Houses | $9,950 | 2% | No Change | |
Rooms | $3,522 | No Change | - |
Studio
Average rent
$1,900
Last 30 days
2%
Last year
3%
1 bedroom
Average rent
$2,600
Last 30 days
2%
Last year
7%
2 bedroom
Average rent
$4,600
Last 30 days
3%
Last year
18%
3 bedroom
Average rent
$10,000
Last 30 days
6%
Last year
4%
4 bedroom
Average rent
$27,500
Last 30 days
3%
Last year
No Change
Oceanfront
Average rent
$4,500
Flamingo Lummus
Average rent
$2,250
City Center
Average rent
$3,500
West Avenue
Average rent
$3,500
South Pointe
Average rent
$6,500
Normandy Isles
Average rent
$2,200
Altos Del Mar South
Average rent
$1,800
Bayshore
Average rent
$4,500
Biscayne Beach
Average rent
$2,275
Venetian Islands
Average rent
$7,400
Apartments
Average rent
$2,400
Last 30 days
13%
Condos
Average rent
$3,700
Last 30 days
2%
Houses
Average rent
$9,950
Last 30 days
2%
Rooms
Average rent
$3,522
The table above reflects average rent prices in Miami Beach, FL, broken down by the number of bedrooms, neighborhoods, and property types. The availability of data for each category is dependent on market inventory and will adjust depending on your selected filters.
How does rent in Miami Beach, FL compare to other cities?
Compare median rent prices in Miami Beach and Aventura by all bedroom counts and property types.
Miami Beach
higher than the national median
higher than the national median
Takeaway
The median rent for all rentals in Miami Beach, FL is 2% higher than the median rent in Aventura, FL.
Average rent in nearby cities
Explore rent trends in neighboring markets
$3,367
$3,875
$3,200
$2,475
$2,300
$2,500
$3,100
$2,600
$2,800
$2,200
$2,397
$5,000
Discover rentals in Miami Beach, FL

5d+ ago
House for rent in Miami Beach
6300 Collins Ave #MANY, Miami Beach, FL 33141
Studio
1 bath
$1,300
House for rent

5d+ ago
Flamingo - Lummus apartment for rent in Miami Beach
1025 Meridian Ave #105, Miami Beach, FL 33139
Studio
1 bath
$1,350
Apartment for rent

5d+ ago
Apartment for rent in Miami Beach
8132 Harding Ave #9, Miami Beach, FL 33141
Studio
1 bath
$1,350
Apartment for rent

5d+ ago
Apartment for rent in Miami Beach
8315 Byron Ave #7A, Miami Beach, FL 33141
Studio
1 bath
$1,375
Apartment for rent


5d+ ago
Oceanfront condo for rent in Miami Beach
102 24th St, Miami Beach, FL 33139
3 beds
3.5 baths
$95,000
Condo for rent

5d+ ago
Bayshore house for rent in Miami Beach
3465 N Meridian Ave #0, Miami Beach, FL 33140
5 beds
6 baths
$80,000
House for rent

5d+ ago
Star, Palm and Hibiscus Islands house for rent in Miami Beach
432 S Hibiscus Dr, Miami Beach, FL 33139
5 beds
6 baths
$78,000
House for rent

5d+ ago
Star, Palm and Hibiscus Islands house for rent in Miami Beach
257 N Coconut Ln, Miami Beach, FL 33139
5 beds
5.5 baths
$75,000
House for rent


5d+ ago
Verified
4 beds
3.5 baths
$25,000
House for rent
Available Aug 3

5d+ ago
Verified
3 beds
3.5 baths
$16,000
Condo for rent
Available Aug 3

5d+ ago
Verified
4 beds
3 baths
$15,000
House for rent
Available Aug 3

5d+ ago
Verified
4 beds
4.5 baths
$28,000
Condo for rent
Available Aug 3


5d+ ago
Verified
1750 James Ave #9F, Miami Beach, FL 33139
1 bed
1.5 baths
$2,700
Apartment for rent
Available Aug 15
5d+ ago
Verified
4 beds
3.5 baths
$25,000
House for rent
Available Aug 3
5d+ ago
Verified
3 beds
3.5 baths
$16,000
Condo for rent
Available Aug 3
5d+ ago
Verified
4 beds
3 baths
$15,000
House for rent
Available Aug 3


5d+ ago
1201 Pennsylvania Ave, Miami Beach, FL 33139
Studio
1 bath
$1,575
Apartment for rent
5d+ ago
Verified
1750 James Ave #9F, Miami Beach, FL 33139
1 bed
1.5 baths
$2,700
Apartment for rent
Available Aug 15

5d+ ago
Verified
2 beds
2 baths
$4,000
$3,400
Price drop
Condo for rent
Available Jun 1
5d+ ago
Verified
4 beds
3 baths
$15,000
House for rent
Available Aug 3


Stay up to date with rental market insights

Are you interested in licensing our current and historical rental real estate data, or do you have custom data requests? Contact datalicensing@zumper.com.
Frequently asked questions for Miami Beach, FL
Quick answers to common questions about the Miami Beach rental market.
How much is rent in Miami Beach?
The average rent in Miami Beach is $3,422 per month as of July 25, 2026.
Is rent up or down in Miami Beach?
Average rent prices in Miami Beach have decreased by 3% over the last month and have increased by 9% since last year.
How does Miami Beach rent compare to the national average?
Rent in Miami Beach is 77% above the national average, which means renters are paying approximately $1,492 more per month.
Which neighborhoods are most affordable in Miami Beach?
The most affordable neighborhoods in Miami Beach are Altos Del Mar South ($1,800/mo), Normandy Isles ($2,200/mo), and Flamingo Lummus ($2,250/mo).
What salary do I need to afford rent in Miami Beach?
To comfortably afford rent in Miami Beach, you'd need to earn approximately $137,000/year, based on spending no more than 30% of your income on rent.
When is the best time of year to rent in Miami Beach?
Based on Zumper's July 2026 data, one-bedroom apartments in Miami Beach average around $2,550/month and two-bedrooms approximately $4,240/month.
Methodology
Rent prices are based on Zumper's rental listings from the past 30 days. Median rent is calculated across all available listings and property types on the platform. If you filter the page by bedroom count or property type, the pricing throughout the page will update automatically to reflect that segment of the rental market.
Household and population data come from the U.S. Census Bureau. Cost-of-living data is sourced from the Council for Community and Economic Research's Cost of Living Index (COLI).