
Bedroom count
Property type
Last updated on July 30, 2026
Average rent in
Brisbane, CA
Average rent in
Last updated on July 30, 2026
Bedroom count
Property type
Median rent
Median rent in Brisbane
$4,083/mo
vs previous year
The average rent in Brisbane is $4,083 per month as of July 2026. This is 112% above the national average rent, or $2,153 more per month.
average price per square foot
Total rentals
Available rentals in Brisbane
8
for rent on Zumper.com as of July 2026
Rent price distribution
Share of Brisbane rentals at each price point
This report has limited data.Due a shortage of data for this selected bedroom and/or property type in Brisbane, CA, in the last 30 days, rent estimates may not represent the actual market.
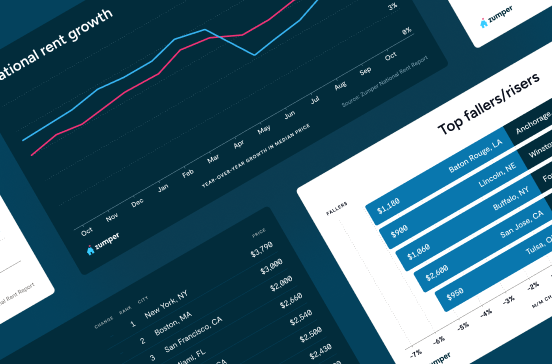
Rent trends in Brisbane, CA
Average rent prices in Brisbane have increased by 3% over the last month and have increased by 21% since last year.
Rent trends
Rent prices on this page are calculated on a rolling 30-day basis and updated daily.
Compare rent prices in
Brisbane, CA
Rent prices in Brisbane vary by bedroom size, rental type, and neighborhood. The average rent for an apartment in Brisbane is $3,826, whereas a house costs $4,390. 1-bedroom apartments in Brisbane run $3,600 on average, while 2-bedroom apartments are $3,825.
Listings | ||||
|---|---|---|---|---|
1 bedroom | $3,369 | No Change |  3% | |
2 bedroom | $3,826 |  3% | 12% | |
3 bedroom | $4,900 | 8% | 7% | |
4 bedroom | $5,895 | No Change | 16% |
Listings | ||
|---|---|---|
Central Brisbane | $4,395 | |
Crocker Park | $3,550 | |
Northwest Bayshore | $3,886 | |
San Bruno Mountain State Park | $4,000 | |
Sierra Point | $3,709 | |
Southeast Bayshore | $3,595 | |
Southwest Bayshore | $3,886 | |
The Northeast Ridge | $3,595 |
Listings | ||||
|---|---|---|---|---|
Apartments | $3,826 | 6% | No Change | |
Condos | $4,850 | 3% | No Change | |
Houses | $4,390 | 4% | No Change | |
Rooms | $1,100 | - | - |
1 bedroom
Average rent
$3,369
Last year
3%
2 bedroom
Average rent
$3,826
Last 30 days
3%
Last year
12%
3 bedroom
Average rent
$4,900
Last 30 days
8%
Last year
7%
4 bedroom
Average rent
$5,895
Last 30 days
No Change
Last year
16%
Central Brisbane
Average rent
$4,395
Southwest Bayshore
Average rent
$3,886
Sierra Point
Average rent
$3,709
Southeast Bayshore
Average rent
$3,595
The Northeast Ridge
Average rent
$3,595
Northwest Bayshore
Average rent
$3,886
San Bruno Mountain State Park
Average rent
$4,000
Crocker Park
Average rent
$3,550
Apartments
Average rent
$3,826
Last 30 days
6%
Condos
Average rent
$4,850
Last 30 days
3%
Houses
Average rent
$4,390
Last 30 days
4%
Last year
No Change
Rooms
Average rent
$1,100
The table above reflects average rent prices in Brisbane, CA, broken down by the number of bedrooms, neighborhoods, and property types. The availability of data for each category is dependent on market inventory and will adjust depending on your selected filters.
How does rent in Brisbane, CA compare to other cities?
Compare median rent prices in Brisbane and Belmont by all bedroom counts and property types.
Brisbane
higher than the national median
higher than the national median
Takeaway
The median rent for all rentals in Brisbane, CA is 4% higher than the median rent in Belmont, CA.
Average rent in nearby cities
Explore rent trends in neighboring markets
$3,925
$4,000
$2,497
$2,500
$3,898
$3,495
$3,390
$3,450
$3,572
$3,660
$2,125
$4,775
Stay up to date with rental market insights

Are you interested in licensing our current and historical rental real estate data, or do you have custom data requests? Contact datalicensing@zumper.com.
Frequently asked questions for Brisbane, CA
Quick answers to common questions about the Brisbane rental market.
How much is rent in Brisbane?
The average rent in Brisbane is $4,083 per month as of July 25, 2026.
Is rent up or down in Brisbane?
Average rent prices in Brisbane have increased by 3% over the last month and have increased by 21% since last year.
How does Brisbane rent compare to the national average?
Rent in Brisbane is 112% above the national average, which means renters are paying approximately $2,153 more per month.
Which neighborhoods are most affordable in Brisbane?
The most affordable neighborhoods in Brisbane are Crocker Park ($3,550/mo), Southeast Bayshore ($3,595/mo), and The Northeast Ridge ($3,595/mo).
What salary do I need to afford rent in Brisbane?
To comfortably afford rent in Brisbane, you'd need to earn approximately $163,000/year, based on spending no more than 30% of your income on rent.
When is the best time of year to rent in Brisbane?
Central Brisbane and The Northeast Ridge are Brisbane's top rental neighborhoods. Central Brisbane offers urban convenience with 1-bedroom apartments at $2,100/month, while The Northeast Ridge excels in walkability and social connectivity with excellent transit access.
Methodology
Rent prices are based on Zumper's rental listings from the past 30 days. Median rent is calculated across all available listings and property types on the platform. If you filter the page by bedroom count or property type, the pricing throughout the page will update automatically to reflect that segment of the rental market.
Household and population data come from the U.S. Census Bureau. Cost-of-living data is sourced from the Council for Community and Economic Research's Cost of Living Index (COLI).