
Bedroom count
Property type
Last updated on June 15, 2026
Average rent in
Seattle, WA
Average rent in
Last updated on June 15, 2026
Bedroom count
Property type
Key takeaways for renters
Where Seattle rent stands today
Seattle, WA rent rose 1.0% year over year, with a current median of $1,995/month. Renters today are paying $64 more per month on average than last year, with rents still below the peak of $2,074/month from July 2024.
Compared to national trends
Seattle runs 2.3% more expensive than the $1,950/month national median, positioning it as a mid-tier metro with 2,068 total rentals offering a range of options for renters.
Rent ranges by bedroom
Studios in Seattle rent for about $1,370/month, 1-bedrooms at $1,950/month, and 2-bedrooms at $2,795/month, with 3-bedrooms and 4+ bedrooms reaching $3,795 and $4,200/month respectively. These figures reflect the range of bedroom sizes available to renters.
Price ranges
Houses rent for a median of $3,650/month in Seattle, while apartments rent for a median of $1,895/month. Apartments account for 77.5% of total rentals, showing the predominance of this property type in the market.
Median rent
Median rent in Seattle
$1,995/mo
vs previous year
The average rent in Seattle is $1,995 per month as of June 2026. This is 2% above the national average rent, or $45 more per month.
average price per square foot
Total rentals
Available rentals in Seattle
2,068
for rent on Zumper.com as of June 2026
Rent price distribution
Share of Seattle rentals at each price point
Rent trends in Seattle, WA
Average rent prices in Seattle have increased by 1% over the last month and have increased by 1% since last year.
Rent trends
Rent prices on this page are calculated on a rolling 30-day basis and updated daily.
Compare rent prices in
Seattle, WA
Rent prices in Seattle vary by bedroom size, rental type, and neighborhood. The average rent for an apartment in Seattle is $1,895, whereas a house costs $3,650. 1-bedroom apartments in Seattle run $1,950 on average, while 2-bedroom apartments are $2,695.
Listings | ||||
|---|---|---|---|---|
Studio | $1,370 |  1% | 1% | |
1 bedroom | $1,949 | No Change |  5% | |
2 bedroom | $2,795 | 1% | 9% | |
3 bedroom | $3,795 | 3% | 9% | |
4 bedroom | $4,200 | 2% | 16% |
Listings | ||
|---|---|---|
Adams | $1,713 | |
Belltown | $2,350 | |
Broadway | $1,700 | |
First Hill | $1,657 | |
Fremont | $1,895 | |
Greenwood | $1,636 | |
Lake City | $1,687 | |
Lower Queen Anne | $2,147 | |
South Lake Union | $2,932 | |
University District | $1,575 |
Listings | ||||
|---|---|---|---|---|
Apartments | $1,895 | No Change | No Change | |
Condos | $2,295 | 3% | No Change | |
Houses | $3,650 | 2% | No Change | |
Rooms | $825 | 1% | No Change |
Studio
Average rent
$1,370
Last 30 days
1%
Last year
1%
1 bedroom
Average rent
$1,949
Last 30 days
No Change
Last year
5%
2 bedroom
Average rent
$2,795
Last 30 days
1%
Last year
9%
3 bedroom
Average rent
$3,795
Last 30 days
3%
Last year
9%
4 bedroom
Average rent
$4,200
Last 30 days
2%
Last year
16%
South Lake Union
Average rent
$2,932
Broadway
Average rent
$1,700
University District
Average rent
$1,575
Lower Queen Anne
Average rent
$2,147
Belltown
Average rent
$2,350
Adams
Average rent
$1,713
First Hill
Average rent
$1,657
Fremont
Average rent
$1,895
Greenwood
Average rent
$1,636
Lake City
Average rent
$1,687
Apartments
Average rent
$1,895
Last 30 days
No Change
Condos
Average rent
$2,295
Last 30 days
3%
Houses
Average rent
$3,650
Last 30 days
2%
Rooms
Average rent
$825
Last 30 days
1%
The table above reflects average rent prices in Seattle, WA, broken down by the number of bedrooms, neighborhoods, and property types. The availability of data for each category is dependent on market inventory and will adjust depending on your selected filters.
How does rent in Seattle, WA compare to other cities?
Compare median rent prices in Seattle and Bellevue by all bedroom counts and property types.
Seattle
higher than the national median
higher than the national median
Takeaway
The median rent for all rentals in Seattle, WA is 31% lower than the median rent in Bellevue, WA.
Average rent in nearby cities
Explore rent trends in neighboring markets
Cost of living in Seattle, WA
Explore the cost of essential expenses, and then use our rent calculator to find out how much rent you can afford.
Expenses accrued by most renters | Average cost compared to national average |
|---|---|
| Goods & Services | 25% higher |
| Groceries | 11% higher |
| Health | 19% higher |
| Housing | 106% higher |
| Transportation | 35% higher |
| Utilities | No difference |
Discover rentals in Seattle, WA

1d ago
127 11th Avenue East ##1, Seattle, WA 98102
Studio
0 baths
$445
Apartment for rent

2d ago
5632 11th Ave Ne, Seattle, WA 98105
1 bed
3 baths
$675
Apartment for rent

4d ago
901 Hiawatha Pl S, Seattle, WA 98144
Studio–1 bed
1 bath
$687–$3,200
Apartment for rent

2d ago
2107 Ne 54th St, Seattle, WA 98105
1 bed
3 baths
$690
Apartment for rent


16h ago
112 Boren Ave N, Seattle, WA 98109
1–3 beds
0–4 baths
$2,293–$31,995
Price drop
Apartment for rent

45m ago
Verified
224 Pontius Ave N, Seattle, WA 98109
Studio–4 beds
1–3 baths
$1,270–$12,545
Apartment for rent

6h ago
Verified
3 beds
2 baths
$16,177
$12,545
Price drop
Apartment for rent

6h ago
Verified
3 beds
3 baths
$14,751
$11,929
Price drop
Apartment for rent


22h ago
Verified
3036 16th Ave W, Seattle, WA 98119
1 bed
1 bath
$1,795–$2,195
Apartment for rent

5d+ ago
Verified
11222 11222 - 11244 Greenwood Ave N, Seattle, WA 98133
1–2 beds
1–2 baths
$1,599–$2,295
Apartment for rent
45m ago
Verified
224 Pontius Ave N, Seattle, WA 98109
Studio–4 beds
1–3 baths
$1,270–$12,545
Apartment for rent

16h ago
Verified
8520 20th Ave Ne, Seattle, WA 98115
Studio
1 bath
$895–$950
Apartment for rent


1d ago
Verified
8500 20th Ave Ne, Seattle, WA 98115
Studio–2 beds
1–2 baths
$895–$2,100
Apartment for rent
1d ago
Verified
12728 28th Ave Ne, Seattle, WA 98125
1–3 beds
1–2 baths
$1,599–$2,305
Apartment for rent

1d ago
Verified
12316 28th Ave Ne, Seattle, WA 98125
1–2 beds
1–2 baths
$1,625–$2,059
Apartment for rent


5d+ ago
Verified
11222 11222 - 11244 Greenwood Ave N, Seattle, WA 98133
1 bed
1 bath
$1,599–$1,695
Apartment for rent
16h ago
Verified
8520 20th Ave Ne, Seattle, WA 98115
Studio
1 bath
$895–$950
Apartment for rent
16h ago
Verified
4337 15th Ave Ne, Seattle, WA 98105
Studio–1 bed
0–1 bath
$1,255–$1,665
Apartment for rent
1d ago
Verified
522 N 85th St, Seattle, WA 98103
Studio–2 beds
1–2 baths
$1,470–$5,000
Price drop
Apartment for rent

Stay up to date with rental market insights

Are you interested in licensing our current and historical rental real estate data, or do you have custom data requests? Contact datalicensing@zumper.com.
Frequently asked questions for Seattle, WA
Quick answers to common questions about the Seattle rental market.
How much is rent in Seattle?
The average rent in Seattle is $1,995 per month as of June 13, 2026.
Is rent up or down in Seattle?
Average rent prices in Seattle have increased by 1% over the last month and have increased by 1% since last year.
How does Seattle rent compare to the national average?
Rent in Seattle is 2% above the national average, which means renters are paying approximately $45 more per month.
Which neighborhoods are most affordable in Seattle?
The most affordable neighborhoods in Seattle are University District ($1,575/mo), Greenwood ($1,636/mo), and First Hill ($1,657/mo).
What salary do I need to afford rent in Seattle?
To comfortably afford rent in Seattle, you'd need to earn approximately $80,000/year, based on spending no more than 30% of your income on rent.
When is the best time of year to rent in Seattle?
Seattle's 2025 rental market shows 1-bedroom apartments averaging around $2,000 per month, while 2-bedroom units rent for around $2,800 monthly. One-bedroom rents declined 2.9% from the previous year, whereas 2-bedroom prices remained relatively stable.
Methodology
Rent prices are based on Zumper's rental listings from the past 30 days. Median rent is calculated across all available listings and property types on the platform. If you filter the page by bedroom count or property type, the pricing throughout the page will update automatically to reflect that segment of the rental market.
Household and population data come from the U.S. Census Bureau. Cost-of-living data is sourced from the Council for Community and Economic Research's Cost of Living Index (COLI).
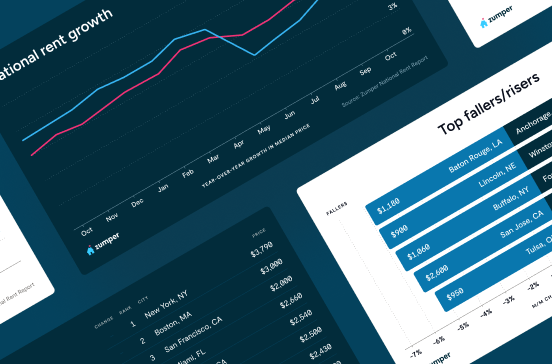
For additional insights into rental trends, including month-over-month changes and historical comparisons, see Zumper's Monthly Metro Report.
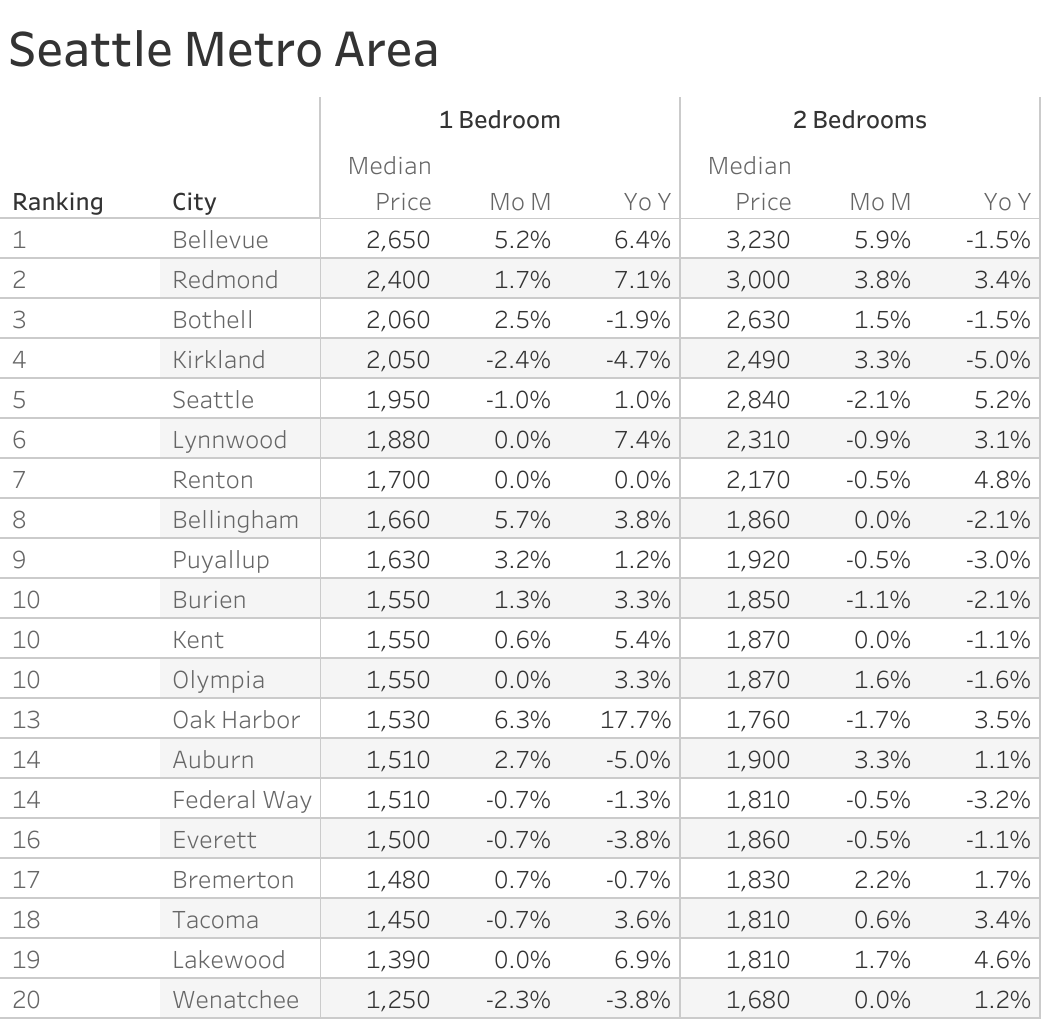
Seattle Metro Report
The Zumper Seattle Metro Report analyzed active listings last month across metro cities to identify the most and least expensive cities and those with the fastest growing rents. The Washington state one-bedroom median rent was $1,573 last month.
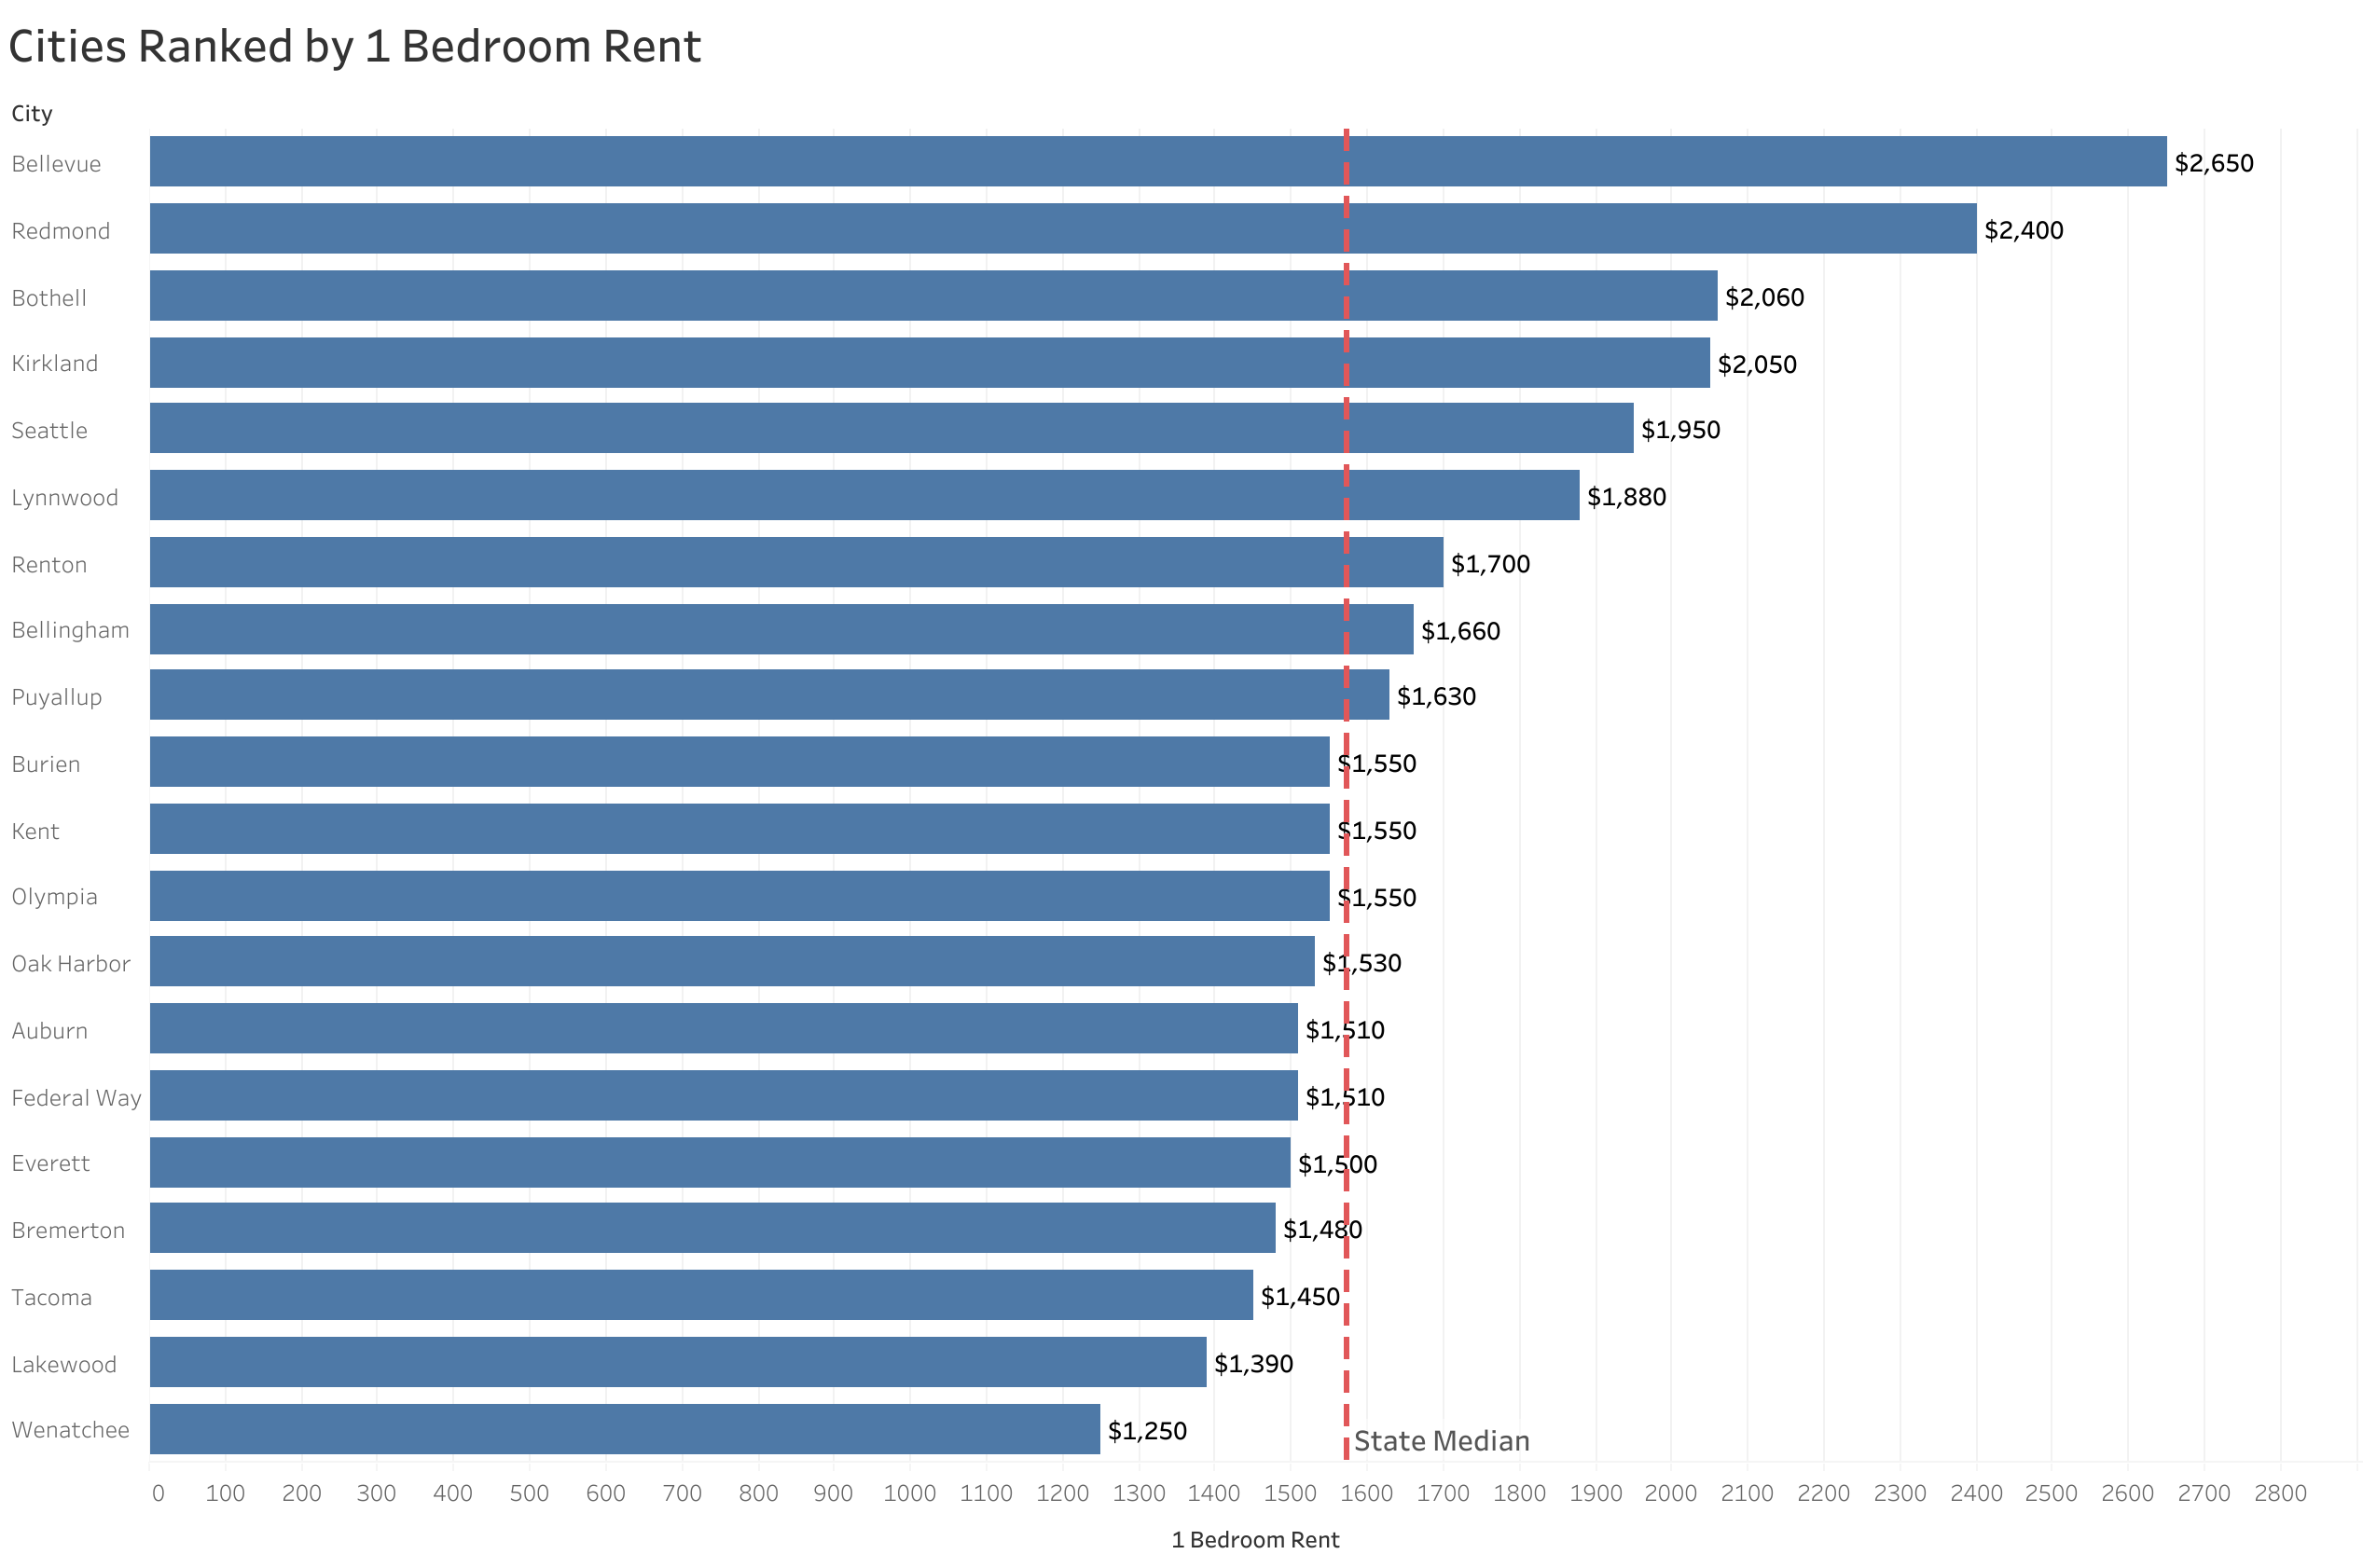
The Most Expensive
- Bellevue ranked as the most expensive city with one-bedrooms priced at $2,650.
- Redmond was the second priciest, with rent at $2,400.
- Bothell placed third with rent at $2,060.
The Least Expensive
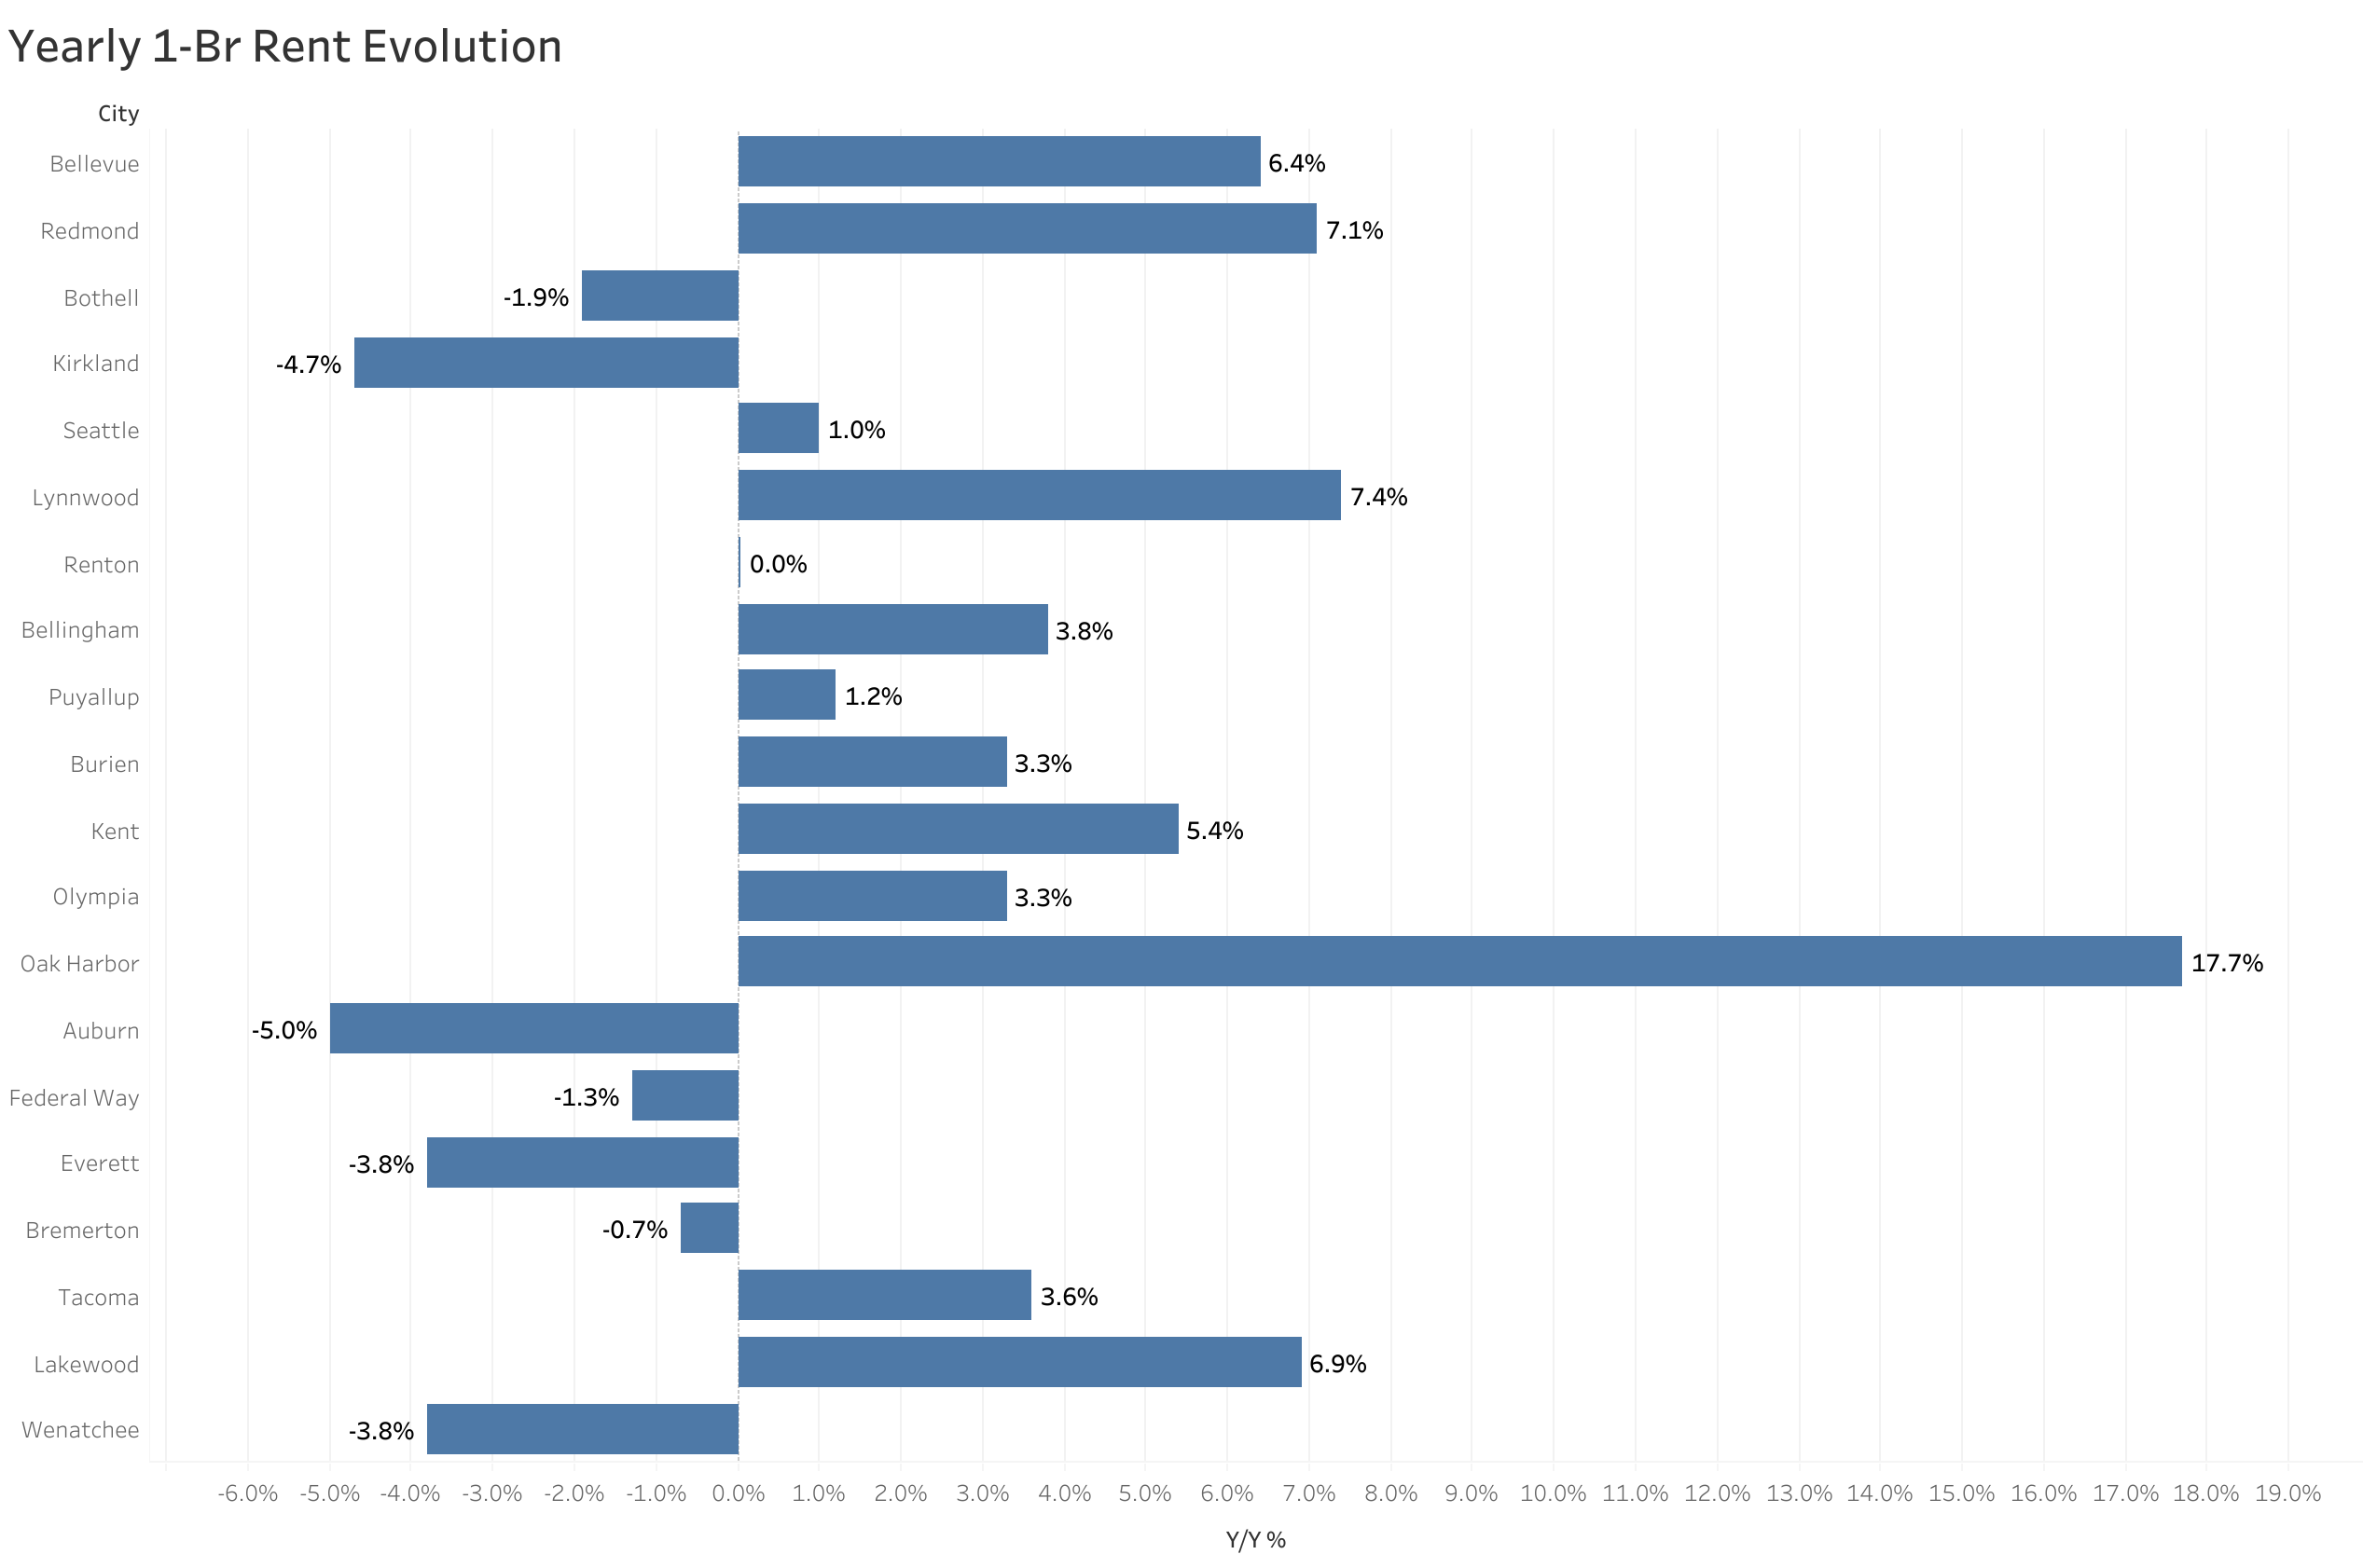
The Fastest Growing (Y/Y%)
- Oak Harbor had the largest annual rent price growth rate, up 17.7%.
- Lynnwood saw rent jump 7.4%, making it second.
- Redmond was third with rent increasing 7.1%.
The Fastest Growing (M/M%)
- Oak Harbor had the largest monthly rent price growth rate, up 6.3%.
- Bellingham placed second with rent climbing 5.7%.
- Bellevue saw rent increase 5.2%, making it third.
About
The Zumper Seattle Metro Area Report analyzed active listings that hit the market last month. Listings are aggregated by city to calculate median asking rents.
Words by
Crystal ChenCrystal Chen is a seasoned real estate and housing market expert with more than a decade of experience analyzing rental trends, housing affordability, and urban living. At Zumper, she leads data storytelling as well as press and media relations, where she translates complex housing research into easily digestible insights for renters, industry professionals, and journalists. Her reports can be seen cited in national outlets like The New York Times, The Wall Street Journal, and CNBC. She is passionate about helping renters navigate today’s evolving housing landscape with clarity and confidence. Living in New York City herself, she knows firsthand the chaos and challenges of navigating a competitive rental market.