
Bedroom count
Property type
Last updated on June 13, 2026
Average rent in
Burlingame, CA
Average rent in
Last updated on June 13, 2026
Bedroom count
Property type
Median rent
Median rent in Burlingame
$2,800/mo
vs previous year
The average rent in Burlingame is $2,800 per month as of June 2026. This is 44% above the national average rent, or $850 more per month.
average price per square foot
Total rentals
Available rentals in Burlingame
16
for rent on Zumper.com as of June 2026
Rent price distribution
Share of Burlingame rentals at each price point
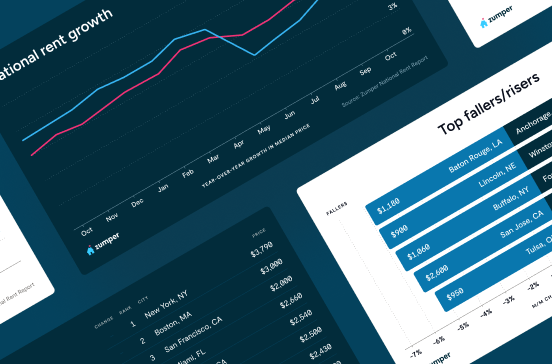
Rent trends in Burlingame, CA
Average rent prices in Burlingame have increased by 5% over the last month and have decreased by 7% since last year.
Rent trends
Rent prices on this page are calculated on a rolling 30-day basis and updated daily.
Compare rent prices in
Burlingame, CA
Rent prices in Burlingame vary by bedroom size, rental type, and neighborhood. The average rent for an apartment in Burlingame is $2,792, whereas a house costs $5,200. 1-bedroom apartments in Burlingame run $2,790 on average, while 2-bedroom apartments are $4,195.
Listings | ||||
|---|---|---|---|---|
Studio | $2,100 |  4% |  14% | |
1 bedroom | $2,790 | 2% | 3% | |
2 bedroom | $4,295 | 3% | 2% | |
3 bedroom | $5,090 | 13% | 1% | |
4 bedroom | $8,000 | 7% | 30% |
Listings | ||
|---|---|---|
Bayfront | $3,384 | |
Burlingame Gardens | $3,545 | |
Burlingame Park | $3,609 | |
Burlingame Terrace | $3,600 | |
Downtown Burlingame | $2,797 | |
Easton Addition | $3,705 | |
Lyon Hoag | $4,171 | |
Mills Estates | $3,455 | |
North Burlingame Rollins Road | $3,940 | |
Ray Park | $2,750 |
Listings | ||||
|---|---|---|---|---|
Apartments | $2,792 | 3% | No Change | |
Condos | $3,450 | 57% | 18% | |
Houses | $5,200 | 8% | No Change |
Studio
Average rent
$2,100
Last 30 days
4%
Last year
14%
1 bedroom
Average rent
$2,790
Last 30 days
2%
Last year
3%
2 bedroom
Average rent
$4,295
Last 30 days
3%
Last year
2%
3 bedroom
Average rent
$5,090
Last 30 days
13%
Last year
1%
4 bedroom
Average rent
$8,000
Last 30 days
7%
Last year
30%
Downtown Burlingame
Average rent
$2,797
Burlingame Gardens
Average rent
$3,545
Lyon Hoag
Average rent
$4,171
North Burlingame Rollins Road
Average rent
$3,940
Ray Park
Average rent
$2,750
Burlingame Park
Average rent
$3,609
Easton Addition
Average rent
$3,705
Mills Estates
Average rent
$3,455
Bayfront
Average rent
$3,384
Burlingame Terrace
Average rent
$3,600
Apartments
Average rent
$2,792
Last 30 days
3%
Condos
Average rent
$3,450
Last 30 days
57%
Last year
18%
Houses
Average rent
$5,200
Last 30 days
8%
The table above reflects average rent prices in Burlingame, CA, broken down by the number of bedrooms, neighborhoods, and property types. The availability of data for each category is dependent on market inventory and will adjust depending on your selected filters.
How does rent in Burlingame, CA compare to other cities?
Compare median rent prices in Burlingame and Daly City by all bedroom counts and property types.
Burlingame
higher than the national median
higher than the national median
Takeaway
The median rent for all rentals in Burlingame, CA is 6% lower than the median rent in Daly City, CA.
Average rent in nearby cities
Explore rent trends in neighboring markets
$2,972
$3,330
$3,513
$4,893
$2,909
$1,953
$3,930
$3,000
$4,000
$4,350
$3,392
$5,202
Discover rentals in Burlingame, CA

1d ago
1005 1005 Burlingame Ave/261 Myrtle Rd, Burlingame, CA 94010
1 bed
1 bath
$2,395
Apartment for rent

1h ago
Downtown Burlingame apartment for rent in Burlingame
1417 Bellevue Ave, Burlingame, CA 94010
1 bed
1 bath
$2,400
Apartment for rent

1d ago
1120 Douglas Ave, Burlingame, CA 94010
2 beds
1 bath
$3,395
Apartment for rent

3d ago
816 Peninsula Ave, Burlingame, CA 94010
2 beds
2 baths
$4,195
Apartment for rent


1d ago
Verified
2 beds
2 baths
$7,700
Apartment for rent

16h ago
Verified
920 Bayswater Ave #1056, Burlingame, CA 94010
1–2 beds
1–2 baths
$4,330–$6,760
Apartment for rent

3d ago
Verified
1 Adrian Ct #1897, Burlingame, CA 94010
1–2 beds
1–2 baths
$4,950–$5,620
Apartment for rent


16h ago
Verified
920 Bayswater Ave #1056, Burlingame, CA 94010
1–2 beds
1–2 baths
$4,330–$6,760
Apartment for rent
1d ago
Verified
2 beds
2 baths
$7,700
Apartment for rent
3d ago
Verified
1 Adrian Ct #1897, Burlingame, CA 94010
1–2 beds
1–2 baths
$4,950–$5,620
Apartment for rent

5d+ ago
Verified
2 beds
2.5 baths
$4,595
House for rent
Available Jun 21
16h ago
Verified
920 Bayswater Ave #1056, Burlingame, CA 94010
1–2 beds
1–2 baths
$4,330–$6,760
Apartment for rent
1d ago
Verified
55 El Camino Real, Burlingame, CA 94010
1 bed
1 bath
$3,295
Apartment for rent
5d+ ago
Verified
2 beds
2.5 baths
$4,595
House for rent
Available Jun 21
1d ago
1005 1005 Burlingame Ave/261 Myrtle Rd, Burlingame, CA 94010
1 bed
1 bath
$2,395
Apartment for rent
1d ago
1120 Douglas Ave, Burlingame, CA 94010
2 beds
1 bath
$3,395
Apartment for rent
Stay up to date with rental market insights

Are you interested in licensing our current and historical rental real estate data, or do you have custom data requests? Contact datalicensing@zumper.com.
Frequently asked questions for Burlingame, CA
Quick answers to common questions about the Burlingame rental market.
How much is rent in Burlingame?
The average rent in Burlingame is $2,800 per month as of June 6, 2026.
Is rent up or down in Burlingame?
Average rent prices in Burlingame have increased by 5% over the last month and have decreased by 7% since last year.
How does Burlingame rent compare to the national average?
Rent in Burlingame is 44% above the national average, which means renters are paying approximately $850 more per month.
Which neighborhoods are most affordable in Burlingame?
The most affordable neighborhoods in Burlingame are Ray Park ($2,750/mo), Downtown Burlingame ($2,797/mo), and Bayfront ($3,384/mo).
What salary do I need to afford rent in Burlingame?
To comfortably afford rent in Burlingame, you'd need to earn approximately $112,000/year, based on spending no more than 30% of your income on rent.
When is the best time of year to rent in Burlingame?
Burlingame's 2025 rental market shows 1-bedroom apartments averaging around $2,700 per month, while 2-bedroom units average around $3,900 monthly. These figures represent the current market conditions across San Mateo County's competitive rental landscape.
Methodology
Rent prices are based on Zumper's rental listings from the past 30 days. Median rent is calculated across all available listings and property types on the platform. If you filter the page by bedroom count or property type, the pricing throughout the page will update automatically to reflect that segment of the rental market.
Household and population data come from the U.S. Census Bureau. Cost-of-living data is sourced from the Council for Community and Economic Research's Cost of Living Index (COLI).