
Bedroom count
Property type
Last updated on July 13, 2026
Average rent in
NOPA, San Francisco, CA
Average rent in
Last updated on July 13, 2026
Bedroom count
Property type
Median rent
Median rent in Nopa
$5,852/mo
vs previous year
The average rent in Nopa is $5,852 per month as of July 2026. This is 200% above the national average rent, or $3,902 more per month.
average price per square foot
Total rentals
Available rentals in Nopa
20
for rent on Zumper.com as of July 2026
Rent price distribution
Share of Nopa rentals at each price point
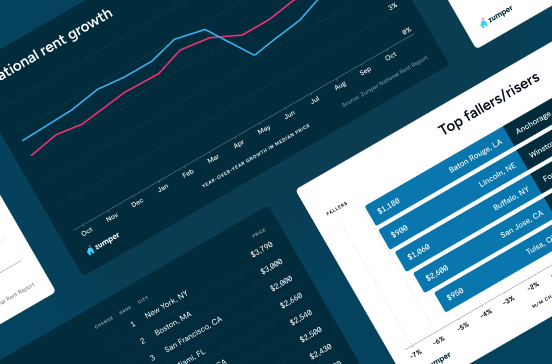
Rent trends in NOPA, San Francisco, CA
Average rent prices in Nopa have increased by 5% over the last month and have increased by 67% since last year.
Rent trends
Rent prices on this page are calculated on a rolling 30-day basis and updated daily.
Compare rent prices in
NOPA, San Francisco, CA
Rent prices in Nopa vary by bedroom size, rental type, and neighborhood. The average rent for an apartment in Nopa is $4,600, whereas a house costs $13,000. 1-bedroom apartments in Nopa run $3,845 on average, while 2-bedroom apartments are $6,000.
Listings | ||||
|---|---|---|---|---|
Studio | $3,255 |  34% | 34% | |
1 bedroom | $4,495 | 17% | 56% | |
2 bedroom | $5,975 | 17% | 42% | |
3 bedroom | $10,497 |  27% | 90% | |
4 bedroom | $12,000 | 35% | 50% |
Listings | ||
|---|---|---|
Castro | $5,000 | |
Cole Valley | $4,686 | |
Haight Ashbury | $4,822 | |
Inner Richmond | $4,795 | |
Inner Sunset | $4,197 | |
Mission Dolores | $4,997 |
Listings | ||||
|---|---|---|---|---|
Apartments | $4,600 | 45% | No Change | |
Condos | $7,995 | 11% | No Change | |
Houses | $13,000 | No Change | No Change |
Studio
Average rent
$3,255
Last 30 days
34%
Last year
34%
1 bedroom
Average rent
$4,495
Last 30 days
17%
Last year
56%
2 bedroom
Average rent
$5,975
Last 30 days
17%
Last year
42%
3 bedroom
Average rent
$10,497
Last 30 days
27%
Last year
90%
4 bedroom
Average rent
$12,000
Last 30 days
35%
Last year
50%
Castro
Average rent
$5,000
Cole Valley
Average rent
$4,686
Haight Ashbury
Average rent
$4,822
Inner Richmond
Average rent
$4,795
Inner Sunset
Average rent
$4,197
Mission Dolores
Average rent
$4,997
Apartments
Average rent
$4,600
Last 30 days
45%
Condos
Average rent
$7,995
Last 30 days
11%
Houses
Average rent
$13,000
The table above reflects average rent prices in NOPA, San Francisco, CA, broken down by the number of bedrooms, neighborhoods, and property types. The availability of data for each category is dependent on market inventory and will adjust depending on your selected filters.
How does rent in Nopa, San Francisco, CA compare to other neighborhoods?
Compare median rent prices in Nopa and Castro by all bedroom counts and property types.
Nopa
higher than the national median
higher than the national median
Takeaway
The median rent for all rentals in Nopa, San Francisco, CA is 17% higher than the median rent in Castro, San Francisco, CA.
Average rent in nearby neighborhoods
Explore rent trends in neighboring markets
Discover rentals in NOPA, San Francisco, CA

5d+ ago
NOPA apartment for rent in San Francisco
1753 Fulton St #1757, San Francisco, CA 94117
5 beds
2 baths
$10,000
Apartment for rent
Available Jun 25

5d+ ago
NOPA condo for rent in San Francisco
3 beds
1.5 baths
$8,500
Condo for rent
Available Aug 8

3d ago
839 Broderick St, San Francisco, CA 94115
2 beds
2 baths
$6,595
Price drop
Apartment for rent

5d+ ago
NOPA apartment for rent in San Francisco
2 beds
1 bath
$6,000
Apartment for rent
Available May 1

3d ago
Verified
500 Stanyan St, San Francisco, CA 94117
1 bed
1 bath
$5,390
Apartment for rent


5d+ ago
NOPA apartment for rent in San Francisco
2 beds
1 bath
$6,000
Apartment for rent
Available May 1
5d+ ago
NOPA apartment for rent in San Francisco
1753 Fulton St #1757, San Francisco, CA 94117
5 beds
2 baths
$10,000
Apartment for rent
Available Jun 25
2d ago
NOPA apartment for rent in San Francisco
1888 Golden Gate Ave #14, San Francisco, CA 94115
Studio
1 bath
$3,495
Apartment for rent
Available Jul 10
3d ago
NOPA apartment for rent in San Francisco
1431 Grove St #2, San Francisco, CA 94117
1 bed
1 bath
$4,495
Apartment for rent
3d ago
Verified
500 Stanyan St, San Francisco, CA 94117
1 bed
1 bath
$5,390
Apartment for rent
3d ago
839 Broderick St, San Francisco, CA 94115
2 beds
2 baths
$6,595
Price drop
Apartment for rent
5d+ ago
NOPA apartment for rent in San Francisco
1753 Fulton St #1757, San Francisco, CA 94117
5 beds
2 baths
$10,000
Apartment for rent
Available Jun 25
5d+ ago
NOPA condo for rent in San Francisco
3 beds
1.5 baths
$8,500
Condo for rent
Available Aug 8
5d+ ago
NOPA apartment for rent in San Francisco
2 beds
1 bath
$6,000
Apartment for rent
Available May 1
3d ago
839 Broderick St, San Francisco, CA 94115
2 beds
2 baths
$6,595
Price drop
Apartment for rent
Stay up to date with rental market insights

Are you interested in licensing our current and historical rental real estate data, or do you have custom data requests? Contact datalicensing@zumper.com.
Frequently asked questions for NOPA, San Francisco, CA
Quick answers to common questions about the Nopa rental market.
How much is rent in Nopa?
The average rent in Nopa is $5,852 per month as of July 11, 2026.
Is rent up or down in Nopa?
Average rent prices in Nopa have increased by 5% over the last month and have increased by 67% since last year.
How does Nopa rent compare to the national average?
Rent in Nopa is 200% above the national average, which means renters are paying approximately $3,902 more per month.
What salary do I need to afford rent in Nopa?
To comfortably afford rent in Nopa, you'd need to earn approximately $234,000/year, based on spending no more than 30% of your income on rent.
Methodology
Rent prices are based on Zumper's rental listings from the past 30 days. Median rent is calculated across all available listings and property types on the platform. If you filter the page by bedroom count or property type, the pricing throughout the page will update automatically to reflect that segment of the rental market.
Household and population data come from the U.S. Census Bureau. Cost-of-living data is sourced from the Council for Community and Economic Research's Cost of Living Index (COLI).