
Bedroom count
Property type
Last updated on June 15, 2026
Average rent in
Rockridge Bart Station, CA
Average rent in
Last updated on June 15, 2026
Bedroom count
Property type
Median rent
Median rent in Oakland
$1,995/mo
vs previous year
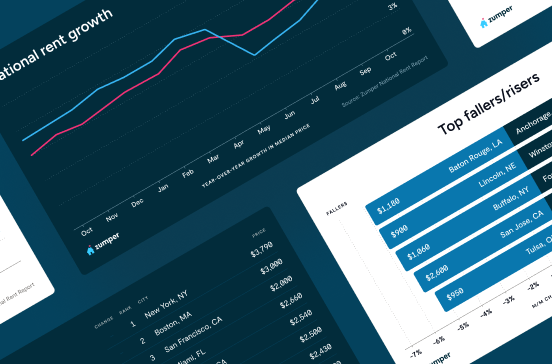
The average rent in Oakland is $1,995 per month as of June 2026. This is 2% above the national average rent, or $45 more per month.
average price per square foot
Total rentals
Available rentals in Oakland
27
for rent on Zumper.com as of June 2026
Rent price distribution
Share of Oakland rentals at each price point
Rent trends in Rockridge Bart Station, CA
Average rent prices in Oakland have increased by 18% since last year. At this time, we don't have enough information to generate yearly trends. Please see below for more rent price details.
Rent trends
Rent prices on this page are calculated on a rolling 30-day basis and updated daily.
Compare rent prices in
Rockridge Bart Station, CA
Rent prices in Oakland vary by bedroom size, rental type, and neighborhood. The average rent for an apartment in Oakland is $1,995, whereas a house costs $5,199. 1-bedroom apartments in Oakland run $1,895 on average, while 2-bedroom apartments are $2,500.
Listings | ||||
|---|---|---|---|---|
Studio | $1,995 | - |  45% | |
1 bedroom | $1,895 | - | 11% | |
2 bedroom | $2,495 | - | 11% | |
4 bedroom | $3,297 | - | 265% |
At this time, we don't have enough active inventory for all rentals to generate data. Please check back soon to see neighborhood rent prices in Rockridge Bart Station, CA.
Listings | ||||
|---|---|---|---|---|
Apartments | $1,995 | - | No Change | |
Condos | $2,395 | - | - | |
Houses | $5,199 | - | - | |
Rooms | $1,245 | - | - |
Studio
Average rent
$1,995
Last year
45%
1 bedroom
Average rent
$1,895
Last year
11%
2 bedroom
Average rent
$2,495
Last year
11%
4 bedroom
Average rent
$3,297
Last year
265%
At this time, we don't have enough active inventory for all rentals to generate data. Please check back soon to see neighborhood rent prices in Rockridge Bart Station, CA.
Apartments
Average rent
$1,995
Condos
Average rent
$2,395
Houses
Average rent
$5,199
Rooms
Average rent
$1,245
The table above reflects average rent prices in Rockridge Bart Station, CA, broken down by the number of bedrooms, neighborhoods, and property types. The availability of data for each category is dependent on market inventory and will adjust depending on your selected filters.
Discover rentals in Rockridge Bart Station, CA

5d+ ago
592 59th St, Oakland, CA 94609
2 beds
1 bath
$2,050
Apartment for rent

4d ago
6616 Telegraph Ave, Oakland, CA 94609
2 beds
1 bath
$2,495–$2,895
Apartment for rent

5d+ ago
Verified
5 beds
3 baths
$5,199
House for rent
Available Jun 1

3d ago
Shafter house for rent in Oakland
3 beds
2 baths
$5,500
House for rent

5d+ ago
Rockridge house for rent in Oakland
1 bed
1 bath
$2,800
House for rent

3d ago
Verified
3030 Telegraph Ave, Berkeley, CA 94705
Studio
1 bath
$2,750
Apartment for rent

3d ago
4700 Telegraph Ave, Oakland, CA 94609
Studio
1 bath
$2,718
The price shown reflects a 12-month lease and includes base rent plus all required monthly fees provided by the property.Apartment for rent


3d ago
Verified
3030 Telegraph Ave, Berkeley, CA 94705
Studio
1 bath
$2,750
Apartment for rent

5h ago
Bushrod apartment for rent in Oakland
663 Alcatraz Ave #5, Oakland, CA 94609
1 bed
1 bath
$1,899
Apartment for rent
Available Jun 26

20h ago
5445 Vicente Way, Oakland, CA 94609
1 bed
1 bath
$1,895
Apartment for rent
3d ago
4700 Telegraph Ave, Oakland, CA 94609
Studio
1 bath
$2,718
The price shown reflects a 12-month lease and includes base rent plus all required monthly fees provided by the property.Apartment for rent

5d+ ago
Verified
5 beds
3 baths
$5,199
House for rent
Available Jun 1

10h ago
5471 Vicente Way, Oakland, CA 94609
Studio
1 bath
$1,525–$1,695
Apartment for rent
5d+ ago
592 59th St, Oakland, CA 94609
2 beds
1 bath
$2,050
Apartment for rent

4d ago
3105 Telegraph Ave, Berkeley, CA 94705
2 beds
1 bath
$3,195
Apartment for rent


3d ago
Verified
3030 Telegraph Ave, Berkeley, CA 94705
Studio
1 bath
$2,750
Apartment for rent
5d+ ago
Verified
5 beds
3 baths
$5,199
House for rent
Available Jun 1
2d ago
225 Clifton St, Oakland, CA 94618
1 bed
1 bath
$1,850–$2,250
Apartment for rent
5h ago
Bushrod apartment for rent in Oakland
663 Alcatraz Ave #5, Oakland, CA 94609
1 bed
1 bath
$1,899
Apartment for rent
Available Jun 26

Stay up to date with rental market insights

Are you interested in licensing our current and historical rental real estate data, or do you have custom data requests? Contact datalicensing@zumper.com.
Frequently asked questions for Rockridge Bart Station, CA
Quick answers to common questions about the Oakland rental market.
How much is rent in Oakland?
The average rent in Oakland is $1,995 per month as of June 13, 2026.
Is rent up or down in Oakland?
Average rent prices in Oakland have increased by 18% since last year.
How does Oakland rent compare to the national average?
Rent in Oakland is 2% above the national average, which means renters are paying approximately $45 more per month.
What salary do I need to afford rent in Oakland?
To comfortably afford rent in Oakland, you'd need to earn approximately $80,000/year, based on spending no more than 30% of your income on rent.
Methodology
Rent prices are based on Zumper's rental listings from the past 30 days. Median rent is calculated across all available listings and property types on the platform. If you filter the page by bedroom count or property type, the pricing throughout the page will update automatically to reflect that segment of the rental market.
Household and population data come from the U.S. Census Bureau. Cost-of-living data is sourced from the Council for Community and Economic Research's Cost of Living Index (COLI).