
Bedroom count
Property type
Last updated on July 1, 2026
Average rent in
Sylmar, Los Angeles, CA
Average rent in
Last updated on July 1, 2026
Bedroom count
Property type
Median rent
Median rent in Sylmar
$2,455/mo
vs previous year
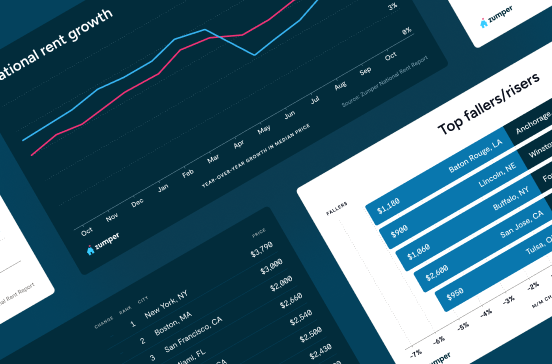
The average rent in Sylmar is $2,455 per month as of June 2026. This is 26% above the national average rent, or $505 more per month.
average price per square foot
Total rentals
Available rentals in Sylmar
46
for rent on Zumper.com as of June 2026
Rent price distribution
Share of Sylmar rentals at each price point
Rent trends in Sylmar, Los Angeles, CA
Average rent prices in Sylmar have decreased by 7% over the last month and have decreased by 10% since last year.
Rent trends
Rent prices on this page are calculated on a rolling 30-day basis and updated daily.
Compare rent prices in
Sylmar, Los Angeles, CA
Rent prices in Sylmar vary by bedroom size, rental type, and neighborhood. The average rent for an apartment in Sylmar is $2,194, whereas a house costs $3,722. 1-bedroom apartments in Sylmar run $1,806 on average, while 2-bedroom apartments are $2,424.
Listings | ||||
|---|---|---|---|---|
Studio | $1,650 |  1% | 1% | |
1 bedroom | $1,797 | No Change |  10% | |
2 bedroom | $2,455 | 5% | 13% | |
3 bedroom | $3,200 | 1% | 11% | |
4 bedroom | $3,900 | 2% | 4% |
Listings | ||
|---|---|---|
Granada Hills | $3,695 | |
Greater Valley Glen | $2,395 | |
Lake Balboa | $2,285 | |
North Hills East | $2,195 | |
Panorama City | $2,075 | |
San Fernando | $2,150 |
Listings | ||||
|---|---|---|---|---|
Apartments | $2,194 | 5% | No Change | |
Condos | $3,297 | 2% | No Change | |
Houses | $3,722 | 9% | No Change |
Studio
Average rent
$1,650
Last 30 days
1%
Last year
1%
1 bedroom
Average rent
$1,797
Last 30 days
No Change
Last year
10%
2 bedroom
Average rent
$2,455
Last 30 days
5%
Last year
13%
3 bedroom
Average rent
$3,200
Last 30 days
1%
Last year
11%
4 bedroom
Average rent
$3,900
Last 30 days
2%
Last year
4%
Granada Hills
Average rent
$3,695
Greater Valley Glen
Average rent
$2,395
Lake Balboa
Average rent
$2,285
North Hills East
Average rent
$2,195
Panorama City
Average rent
$2,075
San Fernando
Average rent
$2,150
Apartments
Average rent
$2,194
Last 30 days
5%
Condos
Average rent
$3,297
Last 30 days
2%
Houses
Average rent
$3,722
Last 30 days
9%
The table above reflects average rent prices in Sylmar, Los Angeles, CA, broken down by the number of bedrooms, neighborhoods, and property types. The availability of data for each category is dependent on market inventory and will adjust depending on your selected filters.
How does rent in Sylmar, Los Angeles, CA compare to other neighborhoods?
Compare median rent prices in Sylmar and Granada Hills by all bedroom counts and property types.
Sylmar
higher than the national median
higher than the national median
Takeaway
The median rent for all rentals in Sylmar, Los Angeles, CA is 34% lower than the median rent in Granada Hills, Los Angeles, CA.
Average rent in nearby neighborhoods
Explore rent trends in neighboring markets
Discover rentals in Sylmar, Los Angeles, CA

4d ago
14033 Foothill Blvd, Los Angeles, CA 91342
2 beds
1 bath
$2,190
Apartment for rent

5d+ ago
Sylmar apartment for rent in Los Angeles
2 beds
2 baths
$2,399
$2,199
Price drop
Apartment for rent

5d+ ago
Sylmar house for rent in Los Angeles
2 beds
1 bath
$2,300
House for rent
Available Jan 15

4d ago
13140 Dronfield Ave, Los Angeles, CA 91342
2–3 beds
2 baths
$2,399–$3,545
Apartment for rent


5d+ ago
Sylmar apartment for rent in Los Angeles
2 beds
1 bath
$3,900
Apartment for rent

1d ago
16601 Foothill Blvd, Los Angeles, CA 91342
1–2 beds
1–2 baths
$2,197–$2,766
Price drop
Apartment for rent

2d ago
Sylmar house for rent in Los Angeles
1 bed
1 bath
$2,250
House for rent

5d+ ago
Sylmar apartment for rent in Los Angeles
1 bed
1 bath
$2,220
Apartment for rent


4d ago
Verified
14500 Olive View Dr, Los Angeles, CA 91342
1–2 beds
1 bath
$1,945–$1,995
Apartment for rent
1d ago
16601 Foothill Blvd, Los Angeles, CA 91342
1–2 beds
1–2 baths
$2,197–$2,766
Price drop
Apartment for rent

1d ago
Sylmar house for rent in Los Angeles
4 beds
2.5 baths
$4,795
$4,495
Price drop
House for rent
2d ago
Sylmar house for rent in Los Angeles
1 bed
1 bath
$2,250
House for rent


4d ago
Verified
14500 Olive View Dr, Los Angeles, CA 91342
1–2 beds
1 bath
$1,945–$1,995
Apartment for rent

5d+ ago
Verified
15520 Foothill Blvd, Los Angeles, CA 91342
Studio
1 bath
$1,795
Apartment for rent
1d ago
16601 Foothill Blvd, Los Angeles, CA 91342
1–2 beds
1–2 baths
$2,197–$2,766
Price drop
Apartment for rent
5d+ ago
13983 Astoria St, Los Angeles, CA 91342
1 bed
1 bath
$1,795
Apartment for rent

4d ago
Verified
14500 Olive View Dr, Los Angeles, CA 91342
1–2 beds
1 bath
$1,945–$1,995
Apartment for rent
1d ago
12181 San Fernando Rd, Los Angeles, CA 91342
Studio
1 bath
$1,550
Apartment for rent
4d ago
14033 Foothill Blvd, Los Angeles, CA 91342
2 beds
1 bath
$2,190
Apartment for rent
1d ago
16601 Foothill Blvd, Los Angeles, CA 91342
1–2 beds
1–2 baths
$2,197–$2,766
Price drop
Apartment for rent


Stay up to date with rental market insights

Are you interested in licensing our current and historical rental real estate data, or do you have custom data requests? Contact datalicensing@zumper.com.
Frequently asked questions for Sylmar, Los Angeles, CA
Quick answers to common questions about the Sylmar rental market.
How much is rent in Sylmar?
The average rent in Sylmar is $2,455 per month as of June 27, 2026.
Is rent up or down in Sylmar?
Average rent prices in Sylmar have decreased by 7% over the last month and have decreased by 10% since last year.
How does Sylmar rent compare to the national average?
Rent in Sylmar is 26% above the national average, which means renters are paying approximately $505 more per month.
What salary do I need to afford rent in Sylmar?
To comfortably afford rent in Sylmar, you'd need to earn approximately $98,000/year, based on spending no more than 30% of your income on rent.
Methodology
Rent prices are based on Zumper's rental listings from the past 30 days. Median rent is calculated across all available listings and property types on the platform. If you filter the page by bedroom count or property type, the pricing throughout the page will update automatically to reflect that segment of the rental market.
Household and population data come from the U.S. Census Bureau. Cost-of-living data is sourced from the Council for Community and Economic Research's Cost of Living Index (COLI).