
Bedroom count
Property type
Last updated on July 30, 2026
Average rent in
Ocean City, Ocean City, NJ
Average rent in
Last updated on July 30, 2026
Bedroom count
Property type
Median rent
Median rent in Ocean City
$4,500/mo
vs previous year
The average rent in Ocean City is $4,500 per month as of July 2026. This is 133% above the national average rent, or $2,570 more per month.
average price per square foot
Total rentals
Available rentals in Ocean City
22
for rent on Zumper.com as of July 2026
Rent price distribution
Share of Ocean City rentals at each price point
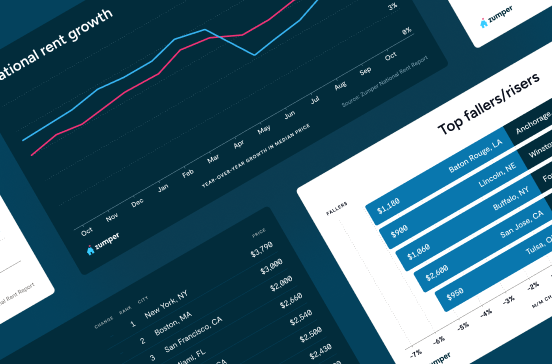
Rent trends in Ocean City, Ocean City, NJ
Average rent prices in Ocean City have decreased by 51% over the last month and have increased by 38% since last year.
Rent trends
Rent prices on this page are calculated on a rolling 30-day basis and updated daily.
Compare rent prices in
Ocean City, Ocean City, NJ
Rent prices in Ocean City vary by bedroom size, rental type, and neighborhood. The average rent for an apartment in Ocean City is $4,500, whereas a house costs $2,950. 1-bedroom apartments in Ocean City run $3,800 on average, while 2-bedroom apartments are $4,992.
Listings | ||||
|---|---|---|---|---|
Studio | $1,500 |  77% | - | |
1 bedroom | $4,650 | 20% |  269% | |
2 bedroom | $2,750 | 49% | 37% | |
3 bedroom | $7,246 | 6% | 3% | |
4 bedroom | $15,000 | 3% | 25% |
Listings | ||
|---|---|---|
Chelsea | $1,925 | |
Lower Chelsea | $3,500 | |
Margate City | $12,250 | |
Somers Point | $4,250 | |
Uptown Atlantic City | $2,000 | |
Ventnor City | $10,000 |
Listings | ||||
|---|---|---|---|---|
Apartments | $4,500 | 14% | No Change | |
Condos | $4,474 | 15% | 138% | |
Houses | $2,950 | 47% | No Change |
Studio
Average rent
$1,500
Last 30 days
77%
1 bedroom
Average rent
$4,650
Last 30 days
20%
Last year
269%
2 bedroom
Average rent
$2,750
Last 30 days
49%
Last year
37%
3 bedroom
Average rent
$7,246
Last 30 days
6%
Last year
3%
4 bedroom
Average rent
$15,000
Last 30 days
3%
Last year
25%
Chelsea
Average rent
$1,925
Lower Chelsea
Average rent
$3,500
Uptown Atlantic City
Average rent
$2,000
Margate City
Average rent
$12,250
Somers Point
Average rent
$4,250
Ventnor City
Average rent
$10,000
Apartments
Average rent
$4,500
Last 30 days
14%
Condos
Average rent
$4,474
Last 30 days
15%
Last year
138%
Houses
Average rent
$2,950
Last 30 days
47%
The table above reflects average rent prices in Ocean City, Ocean City, NJ, broken down by the number of bedrooms, neighborhoods, and property types. The availability of data for each category is dependent on market inventory and will adjust depending on your selected filters.
How does rent in Ocean City, Ocean City, NJ compare to other neighborhoods?
Compare median rent prices in Ocean City and Chelsea by all bedroom counts and property types.
Ocean City
higher than the national median
Equal to the the national median
Takeaway
The median rent for all rentals in Ocean City, Ocean City, NJ is 134% higher than the median rent in Chelsea, Atlantic City, NJ.
Average rent in nearby neighborhoods
Explore rent trends in neighboring markets
Discover rentals in Ocean City, Ocean City, NJ

5d+ ago
House for rent in Ocean City
801 Asbury Ave #200, Ocean City, NJ 08226
Studio
0 baths
$1,300
House for rent

3d ago
Condo for rent in Ocean City
935 Ocean Ave, Ocean City, NJ 08226
3 beds
2.5 baths
$2,200
Condo for rent

5d+ ago
House for rent in Ocean City
509 E 7th St #NA, Ocean City, NJ 08226
2 beds
1 bath
$2,200
House for rent
Available Oct 1

5d+ ago
Condo for rent in Ocean City
509 E 7th St #NA, Ocean City, NJ 08226
2 beds
2 baths
$2,300
Condo for rent
Available Oct 1


8h ago
Verified
5 beds
3 baths
$16,208
$16,063
Price drop
Apartment for rent

3d ago
Condo for rent in Ocean City
935 Ocean Ave #300, Ocean City, NJ 08226
1 bed
1 bath
$8,500
Condo for rent

1d ago
Verified
1140 Simpson Ave, Ocean City, NJ 08226
1–2 beds
1 bath
$3,786–$5,527
Apartment for rent

53m ago
Verified
54 Wesley Rd, Ocean City, NJ 08226
3 beds
2 baths
$6,489
Condo for rent
8h ago
Verified
5 beds
3 baths
$16,208
$16,063
Price drop
Apartment for rent
1d ago
Verified
1140 Simpson Ave, Ocean City, NJ 08226
1–2 beds
1 bath
$3,786–$5,527
Apartment for rent

2d ago
Verified
3 beds
2 baths
$7,409
House for rent


53m ago
Verified
54 Wesley Rd, Ocean City, NJ 08226
3 beds
2 baths
$6,489
Condo for rent
2d ago
Verified
4 beds
3 baths
$8,834
$8,725
Price drop
Apartment for rent

3d ago
Verified
5 beds
3 baths
$13,316
$12,778
Price drop
Condo for rent

5d+ ago
Verified
3 beds
2 baths
$6,636
Condo for rent

8h ago
Verified
5 beds
3 baths
$16,208
$16,063
Price drop
Apartment for rent
1d ago
Verified
1140 Simpson Ave, Ocean City, NJ 08226
1 bed
1 bath
$3,786
Apartment for rent
2d ago
Verified
4 beds
3 baths
$8,834
$8,725
Price drop
Apartment for rent
2d ago
Verified
4 beds
3 baths
$9,850
$9,430
Price drop
House for rent

Stay up to date with rental market insights

Are you interested in licensing our current and historical rental real estate data, or do you have custom data requests? Contact datalicensing@zumper.com.
Frequently asked questions for Ocean City, Ocean City, NJ
Quick answers to common questions about the Ocean City rental market.
How much is rent in Ocean City?
The average rent in Ocean City is $4,500 per month as of July 25, 2026.
Is rent up or down in Ocean City?
Average rent prices in Ocean City have decreased by 51% over the last month and have increased by 38% since last year.
How does Ocean City rent compare to the national average?
Rent in Ocean City is 133% above the national average, which means renters are paying approximately $2,570 more per month.
What salary do I need to afford rent in Ocean City?
To comfortably afford rent in Ocean City, you'd need to earn approximately $180,000/year, based on spending no more than 30% of your income on rent.
Methodology
Rent prices are based on Zumper's rental listings from the past 30 days. Median rent is calculated across all available listings and property types on the platform. If you filter the page by bedroom count or property type, the pricing throughout the page will update automatically to reflect that segment of the rental market.
Household and population data come from the U.S. Census Bureau. Cost-of-living data is sourced from the Council for Community and Economic Research's Cost of Living Index (COLI).