
Bedroom count
Property type
Last updated on May 14, 2026
Average rent in
Montclair Heights, Clifton, NJ
Last updated on May 14, 2026
Last updated on May 14, 2026
Bedroom count
Property type
As of May 2026, the median rent for all bedroom counts and property types in Montclair Heights, Clifton, NJ is $2,500. This is +28%, or $550, higher than the national average.
average price per square foot
Median rent
$2,500
Total rentals
19
for rent on Zumper.com
As of May 2026, the median rent for all bedroom counts and property types in Montclair Heights, Clifton, NJ is $2,500. This is +28%, or $550, higher than the national average.
average price per square foot
Rent ranges
Households
Median rent and rent ranges are based on Zumper inventory in the last 30 days. Household data are provided by the US Census Bureau.
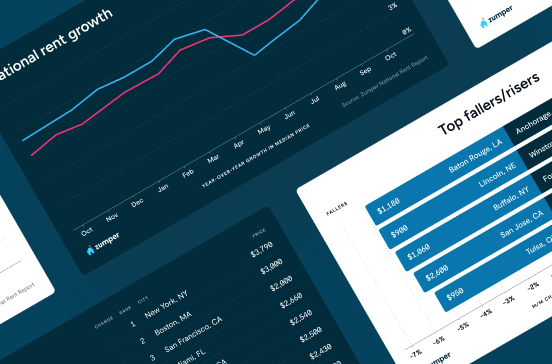
Rent price trends in
Montclair Heights, Clifton, NJ
Rent price trends
Rent prices for all bedroom counts and property types in Montclair Heights, Clifton, NJ have remained the same in the last month and have decreased by 44% in the last year.
Rent prices on this page are calculated on a rolling 30-day basis and updated daily.
Rent comparables in
Montclair Heights, Clifton, NJ
The monthly rent for an apartment in Montclair Heights, Clifton, NJ is $2,400. A 1-bedroom apartment in Montclair Heights, Clifton, NJ costs about $2,052 on average, while a 2-bedroom apartment is $2,700. Houses for rent in Montclair Heights, Clifton, NJ are more expensive, with an average monthly cost of $3,600.
Comparables | ||||
|---|---|---|---|---|
1 bedroom | $2,052 |  8% | - | |
2 bedroom | $3,325 | No Change | 13% | |
3 bedroom | $3,900 | No Change | 36% | |
4 bedroom | $4,500 |  9% | - | |
Studio | $1,777 | No Change | - |
Comparables | ||
|---|---|---|
Delawanna | $2,593 | |
Hillcrest | $2,175 | |
Maple Valley | $2,475 | |
Richfield | $2,500 | |
Riverside | $2,347 | |
South Kearny | $2,475 |
Comparables | ||||
|---|---|---|---|---|
Apartments | $2,400 | No Change | No Change | |
Condos | $2,000 | No Change | No Change | |
Houses | $3,600 | No Change | No Change |
Studio
Average rent
$1,777
1 bedroom
Average rent
$2,052
Last 30 days
8%
2 bedroom
Average rent
$3,325
Last year
13%
3 bedroom
Average rent
$3,900
Last year
36%
4 bedroom
Average rent
$4,500
Last 30 days
9%
Delawanna
Average rent
$2,593
Maple Valley
Average rent
$2,475
Richfield
Average rent
$2,500
South Kearny
Average rent
$2,475
Hillcrest
Average rent
$2,175
Riverside
Average rent
$2,347
Apartments
Average rent
$2,400
Condos
Average rent
$2,000
Houses
Average rent
$3,600
The table above reflects average rent prices in Montclair Heights, Clifton, NJ, broken down by the number of bedrooms, neighborhoods, and property types. The availability of data for each category is dependent on market inventory and will adjust depending on your selected filters.
Compare rent prices in Montclair Heights, Clifton, NJ to other neighborhoods
Median rent prices in Montclair Heights, Clifton, NJ for all bedroom counts and property types compared to Delawanna, Clifton, NJ.
Montclair Heights
higher than the national median
higher than the national median
Takeaway
The median rent for all rentals in Montclair Heights, Clifton, NJ is 4% lower than the median rent in Delawanna, Clifton, NJ.
More data insights and reports

Are you interested in licensing our current and historical rental real estate data, or do you have custom data requests? Contact datalicensing@zumper.com.
Average rent in
Nearby neighborhoods
Explore rent trends in other markets