
Bedroom count
Property type
Last updated on June 13, 2026
Average rent in
San Antonio, TX
Average rent in
Last updated on June 13, 2026
Bedroom count
Property type
Key takeaways for renters
Where San Antonio rent stands today
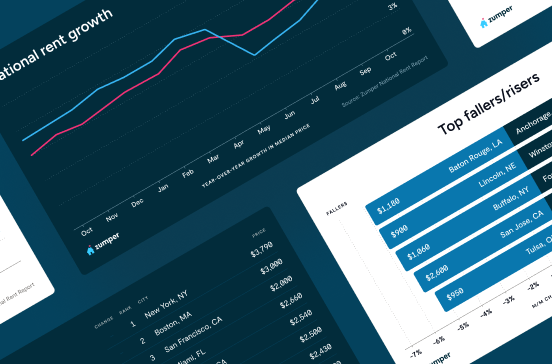
San Antonio, TX rent rose 3.2% year over year, with a current median of $1,542/month. Renters are paying $26 more per month on average than last year, with month-to-month rent essentially unchanged in recent months.
Compared to national trends
San Antonio is 20.9% more affordable than the $1,950/month national median, offering a more accessible market for renters seeking value.
Rent ranges by bedroom
Studios in San Antonio rent for $795/month, 1-bedrooms for $950/month, 2-bedrooms for $1,250/month, 3-bedrooms at $1,650/month, and 4+ bedrooms at $2,099/month. This range reflects the variety of options available across bedroom sizes.
Neighborhood spotlight
Inwood rents fell 76.8% year over year to $1,277/month across 18 rentals, marking a notable local decline against the citywide rise of 3.2%. Elm Creek and Hunters Creek also saw drops of 68.4% and 67.2%, respectively.
Median rent
Median rent in San Antonio
$1,542/mo
vs previous year
The average rent in San Antonio is $1,542 per month as of June 2026. This is 21% below the national average rent, or $407 less per month.
average price per square foot
Total rentals
Available rentals in San Antonio
4,488
for rent on Zumper.com as of June 2026
Rent price distribution
Share of San Antonio rentals at each price point
Rent trends in San Antonio, TX
Average rent prices in San Antonio have remained the same over the last month and have increased by 3% since last year.
Rent trends
Rent prices on this page are calculated on a rolling 30-day basis and updated daily.
Compare rent prices in
San Antonio, TX
Rent prices in San Antonio vary by bedroom size, rental type, and neighborhood. The average rent for an apartment in San Antonio is $1,159, whereas a house costs $1,750. 1-bedroom apartments in San Antonio run $960 on average, while 2-bedroom apartments are $1,225.
Listings | ||||
|---|---|---|---|---|
Studio | $795 | No Change |  17% | |
1 bedroom | $950 | No Change | 6% | |
2 bedroom | $1,250 | No Change | 6% | |
3 bedroom | $1,650 | No Change | 3% | |
4 bedroom | $2,099 |  1% | 1% |
Listings | ||
|---|---|---|
Downtown San Antonio | $1,731 | |
Government Hil | $1,350 | |
Harvard Place Eastlawn | $1,095 | |
Highland Hills | $1,375 | |
Highland Park | $1,297 | |
Medina Valley | $1,749 | |
Southwest San Antonio | $1,650 | |
Stone Oak | $1,964 | |
Tobin Hill | $1,525 | |
Vance Jackson | $1,099 |
Listings | ||||
|---|---|---|---|---|
Apartments | $1,159 | No Change | No Change | |
Condos | $1,350 | 3% | No Change | |
Houses | $1,750 | No Change | No Change | |
Rooms | $572 | 2% | No Change |
Studio
Average rent
$795
Last 30 days
No Change
Last year
17%
1 bedroom
Average rent
$950
Last 30 days
No Change
Last year
6%
2 bedroom
Average rent
$1,250
Last 30 days
No Change
Last year
6%
3 bedroom
Average rent
$1,650
Last 30 days
No Change
Last year
3%
4 bedroom
Average rent
$2,099
Last 30 days
1%
Last year
1%
Medina Valley
Average rent
$1,749
Downtown San Antonio
Average rent
$1,731
Stone Oak
Average rent
$1,964
Highland Hills
Average rent
$1,375
Southwest San Antonio
Average rent
$1,650
Tobin Hill
Average rent
$1,525
Government Hil
Average rent
$1,350
Highland Park
Average rent
$1,297
Vance Jackson
Average rent
$1,099
Harvard Place Eastlawn
Average rent
$1,095
Apartments
Average rent
$1,159
Last 30 days
No Change
Condos
Average rent
$1,350
Last 30 days
3%
Houses
Average rent
$1,750
Last 30 days
No Change
Rooms
Average rent
$572
Last 30 days
2%
The table above reflects average rent prices in San Antonio, TX, broken down by the number of bedrooms, neighborhoods, and property types. The availability of data for each category is dependent on market inventory and will adjust depending on your selected filters.
How does rent in San Antonio, TX compare to other cities?
Compare median rent prices in San Antonio and Alamo Heights by all bedroom counts and property types.
San Antonio
lower than the national median
higher than the national median
Takeaway
The median rent for all rentals in San Antonio, TX is 31% lower than the median rent in Alamo Heights, TX.
Average rent in nearby cities
Explore rent trends in neighboring markets
$2,234
$875
$2,000
$1,697
$1,900
$1,545
$1,600
$1,475
$1,950
$1,598
$1,895
$1,190
Cost of living in San Antonio, TX
Explore the cost of essential expenses, and then use our rent calculator to find out how much rent you can afford.
Expenses accrued by most renters | Average cost compared to national average |
|---|---|
| Goods & Services | 1% higher |
| Groceries | 7% lower |
| Health | 26% higher |
| Housing | 25% lower |
| Transportation | 8% lower |
| Utilities | 15% lower |
Discover rentals in San Antonio, TX

23h ago
7515 Holm Rd, San Antonio, TX 78242
1–3 beds
1–2 baths
$498–$1,199
Price drop
Apartment for rent

15h ago
8506 Wakefield Dr, San Antonio, TX 78216
1–3 beds
1–2 baths
$499–$1,449
Apartment for rent

18h ago
1530 Wild Fire, San Antonio, TX 78251
1 bed
1 bath
$500
Apartment for rent

20h ago
5355 Crestway Dr, San Antonio, TX 78239
1–3 beds
1–2 baths
$510–$1,747
Apartment for rent


5d+ ago
House for rent in San Antonio
3 beds
2 baths
$49,000
House for rent
Available Mar 1

14h ago
Verified
5 beds
2.5 baths
$15,859
Apartment for rent
11h ago
300 N Main Ave, San Antonio, TX 78205
Studio–3 beds
1–2 baths
$1,585–$12,518
Price drop
Apartment for rent
Available Mar 1

5d+ ago
Mahncke Park condo for rent in San Antonio
4242 Broadway, San Antonio, TX 78209
2 beds
2.5 baths
$9,000
Condo for rent


4h ago
Verified
950 E Bitters Rd, San Antonio, TX 78216
1–2 beds
1–2 baths
$681–$1,319
Apartment for rent

10h ago
Verified
7502 Asp Pt, San Antonio, TX 78253
3–4 beds
2–3 baths
$1,689–$2,580
Apartment for rent


1m ago
Verified
17803 La Cantera Ter, San Antonio, TX 78256
Studio–2 beds
1–2 baths
$983–$3,292
Apartment for rent


1d ago
Verified
1700 S Hamilton St, San Antonio, TX 78207
1–4 beds
1–2 baths
$726–$1,545
Price drop
Apartment for rent
1m ago
Verified
17803 La Cantera Ter, San Antonio, TX 78256
Studio–2 beds
1–2 baths
$983–$3,292
Apartment for rent
21m ago
Verified
7940 Pipers Creek St, San Antonio, TX 78251
1–3 beds
1–2 baths
$650–$1,148
Apartment for rent

15h ago
Verified
1530 Nw Crossroads, San Antonio, TX 78251
1–2 beds
1–2 baths
$867–$1,454
Price drop
Apartment for rent


4h ago
Verified
950 E Bitters Rd, San Antonio, TX 78216
1–2 beds
1–2 baths
$681–$1,319
Apartment for rent
10h ago
Verified
7502 Asp Pt, San Antonio, TX 78253
3–4 beds
2–3 baths
$1,689–$2,580
Apartment for rent
1m ago
Verified
17803 La Cantera Ter, San Antonio, TX 78256
Studio–2 beds
1–2 baths
$983–$3,292
Apartment for rent

Stay up to date with rental market insights

Are you interested in licensing our current and historical rental real estate data, or do you have custom data requests? Contact datalicensing@zumper.com.
Frequently asked questions for San Antonio, TX
Quick answers to common questions about the San Antonio rental market.
How much is rent in San Antonio?
The average rent in San Antonio is $1,542 per month as of June 6, 2026.
Is rent up or down in San Antonio?
Average rent prices in San Antonio have remained the same over the last month and have increased by 3% since last year.
How does San Antonio rent compare to the national average?
Rent in San Antonio is 21% below the national average, which means renters are paying approximately $407 less per month.
Which neighborhoods are most affordable in San Antonio?
The most affordable neighborhoods in San Antonio are Harvard Place Eastlawn ($1,095/mo), Vance Jackson ($1,099/mo), and Highland Park ($1,297/mo).
What salary do I need to afford rent in San Antonio?
To comfortably afford rent in San Antonio, you'd need to earn approximately $62,000/year, based on spending no more than 30% of your income on rent.
When is the best time of year to rent in San Antonio?
San Antonio's 2025 rental market shows one-bedroom apartments averaging around $1,100 per month, while two-bedroom units average around $1,400 per month. Both bedroom types remained relatively stable compared to the previous year.
Methodology
Rent prices are based on Zumper's rental listings from the past 30 days. Median rent is calculated across all available listings and property types on the platform. If you filter the page by bedroom count or property type, the pricing throughout the page will update automatically to reflect that segment of the rental market.
Household and population data come from the U.S. Census Bureau. Cost-of-living data is sourced from the Council for Community and Economic Research's Cost of Living Index (COLI).