
Bedroom count
Property type
Last updated on July 1, 2026
Average rent in
Brighton Heights, Pittsburgh, PA
Average rent in
Last updated on July 1, 2026
Bedroom count
Property type
Median rent
Median rent in Brighton Heights
$1,300/mo
vs previous year
The average rent in Brighton Heights is $1,300 per month as of June 2026. This is 33% below the national average rent, or $650 less per month.
average price per square foot
Total rentals
Available rentals in Brighton Heights
14
for rent on Zumper.com as of June 2026
Rent price distribution
Share of Brighton Heights rentals at each price point
This report has limited data.Due a shortage of data for this selected bedroom and/or property type in Brighton Heights, Pittsburgh, PA, in the last 30 days, rent estimates may not represent the actual market.
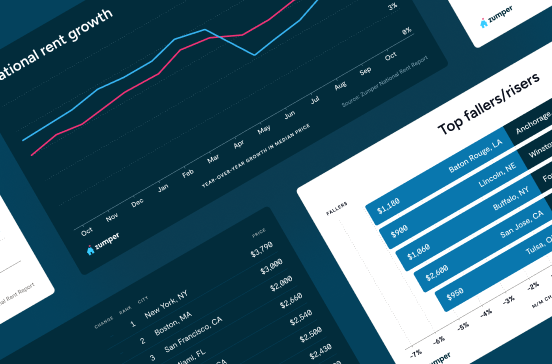
Rent trends in Brighton Heights, Pittsburgh, PA
Average rent prices in Brighton Heights have increased by 4% over the last month and have increased by 3% since last year.
Rent trends
Rent prices on this page are calculated on a rolling 30-day basis and updated daily.
Compare rent prices in
Brighton Heights, Pittsburgh, PA
Rent prices in Brighton Heights vary by bedroom size, rental type, and neighborhood. The average rent for an apartment in Brighton Heights is $1,300, whereas a house costs $1,460. 1-bedroom apartments in Brighton Heights run $950 on average, while 2-bedroom apartments are $1,300.
Listings | ||||
|---|---|---|---|---|
Studio | $812 | No Change |  10% | |
1 bedroom | $944 | 10% | 2% | |
2 bedroom | $1,295 |  3% | 10% | |
3 bedroom | $1,495 | 16% | No Change | |
4 bedroom | $1,800 | 13% | 52% |
Listings | ||
|---|---|---|
Avalon Bellevue Ben Avon | $1,075 | |
Central Northside | $1,425 | |
Manchester | $1,406 | |
Marshall Shadeland | $1,350 | |
Mckees Rocks | $1,100 | |
Perry North | $1,314 |
Listings | ||||
|---|---|---|---|---|
Apartments | $1,300 | 8% | No Change | |
Houses | $1,460 | 9% | No Change |
Studio
Average rent
$812
Last year
10%
1 bedroom
Average rent
$944
Last 30 days
10%
Last year
2%
2 bedroom
Average rent
$1,295
Last 30 days
3%
Last year
10%
3 bedroom
Average rent
$1,495
Last 30 days
16%
Last year
No Change
4 bedroom
Average rent
$1,800
Last 30 days
13%
Last year
52%
Avalon Bellevue Ben Avon
Average rent
$1,075
Mckees Rocks
Average rent
$1,100
Central Northside
Average rent
$1,425
Manchester
Average rent
$1,406
Marshall Shadeland
Average rent
$1,350
Perry North
Average rent
$1,314
Apartments
Average rent
$1,300
Last 30 days
8%
Houses
Average rent
$1,460
Last 30 days
9%
The table above reflects average rent prices in Brighton Heights, Pittsburgh, PA, broken down by the number of bedrooms, neighborhoods, and property types. The availability of data for each category is dependent on market inventory and will adjust depending on your selected filters.
How does rent in Brighton Heights, Pittsburgh, PA compare to other neighborhoods?
Compare median rent prices in Brighton Heights and Avalon Bellevue Ben Avon by all bedroom counts and property types.
Brighton Heights
lower than the national median
lower than the national median
Takeaway
The median rent for all rentals in Brighton Heights, Pittsburgh, PA is 21% higher than the median rent in Avalon Bellevue Ben Avon, Bellevue, PA.
Average rent in nearby neighborhoods
Explore rent trends in neighboring markets
Discover rentals in Brighton Heights, Pittsburgh, PA

4d ago
1316 Woods Run Ave, Pittsburgh, PA 15212
2 beds
1 bath
$900
Apartment for rent

5d+ ago
Brighton Heights house for rent in Pittsburgh
1502 Davis Ave, Pittsburgh, PA 15212
2 beds
1 bath
$1,090
House for rent

1d ago
3805 California Ave, Pittsburgh, PA 15212
2–3 beds
1–2 baths
$1,295–$1,395
Apartment for rent

11h ago
Brighton Heights house for rent in Pittsburgh
4 beds
1.5 baths
$1,595
$1,495
Price drop
House for rent


5d+ ago
Brighton Heights apartment for rent in Pittsburgh
2 beds
1 bath
$1,400
Apartment for rent
Available Jun 1

5d+ ago
Brighton Heights apartment for rent in Pittsburgh
3157 Shadeland Ave, Pittsburgh, PA 15212
1 bed
1 bath
$1,195
Apartment for rent

5d+ ago
Brighton Heights house for rent in Pittsburgh
1 bed
1 bath
$1,025
House for rent
11h ago
Brighton Heights house for rent in Pittsburgh
4 beds
1.5 baths
$1,595
$1,495
Price drop
House for rent
5d+ ago
Brighton Heights house for rent in Pittsburgh
3230 California Ave, Pittsburgh, PA 15212
3 beds
1 bath
$1,500
House for rent
5d+ ago
Brighton Heights apartment for rent in Pittsburgh
3157 Shadeland Ave, Pittsburgh, PA 15212
1 bed
1 bath
$1,195
Apartment for rent
5d+ ago
Brighton Heights house for rent in Pittsburgh
1 bed
1 bath
$1,025
House for rent


5d+ ago
3407 Gass Ave, Pittsburgh, PA 15212
2 beds
1 bath
$1,150
Apartment for rent
5d+ ago
Brighton Heights house for rent in Pittsburgh
1214 Goe Ave, Pittsburgh, PA 15212
3 beds
0 baths
$1,500
House for rent
1d ago
3805 California Ave, Pittsburgh, PA 15212
2–3 beds
1–2 baths
$1,295–$1,395
Apartment for rent
11h ago
Brighton Heights house for rent in Pittsburgh
4 beds
1.5 baths
$1,595
$1,495
Price drop
House for rent

11h ago
Brighton Heights house for rent in Pittsburgh
4 beds
1.5 baths
$1,595
$1,495
Price drop
House for rent
4d ago
1316 Woods Run Ave, Pittsburgh, PA 15212
2 beds
1 bath
$900
Apartment for rent
5d+ ago
Brighton Heights house for rent in Pittsburgh
1 bed
1 bath
$1,025
House for rent
5d+ ago
Brighton Heights house for rent in Pittsburgh
1502 Davis Ave, Pittsburgh, PA 15212
2 beds
1 bath
$1,090
House for rent
Stay up to date with rental market insights

Are you interested in licensing our current and historical rental real estate data, or do you have custom data requests? Contact datalicensing@zumper.com.
Frequently asked questions for Brighton Heights, Pittsburgh, PA
Quick answers to common questions about the Brighton Heights rental market.
How much is rent in Brighton Heights?
The average rent in Brighton Heights is $1,300 per month as of June 27, 2026.
Is rent up or down in Brighton Heights?
Average rent prices in Brighton Heights have increased by 4% over the last month and have increased by 3% since last year.
How does Brighton Heights rent compare to the national average?
Rent in Brighton Heights is 33% below the national average, which means renters are paying approximately $650 less per month.
What salary do I need to afford rent in Brighton Heights?
To comfortably afford rent in Brighton Heights, you'd need to earn approximately $52,000/year, based on spending no more than 30% of your income on rent.
Methodology
Rent prices are based on Zumper's rental listings from the past 30 days. Median rent is calculated across all available listings and property types on the platform. If you filter the page by bedroom count or property type, the pricing throughout the page will update automatically to reflect that segment of the rental market.
Household and population data come from the U.S. Census Bureau. Cost-of-living data is sourced from the Council for Community and Economic Research's Cost of Living Index (COLI).