
Bedroom count
Property type
Last updated on July 12, 2026
Average rent in
Waban, Newton, MA
Average rent in
Last updated on July 12, 2026
Bedroom count
Property type
Median rent
Median rent in Waban
$3,600/mo
vs previous year
The average rent in Waban is $3,600 per month as of July 2026. This is 85% above the national average rent, or $1,650 more per month.
average price per square foot
Total rentals
Available rentals in Waban
14
for rent on Zumper.com as of July 2026
Rent price distribution
Share of Waban rentals at each price point
This report has limited data.Due a shortage of data for this selected bedroom and/or property type in Waban, Newton, MA, in the last 30 days, rent estimates may not represent the actual market.
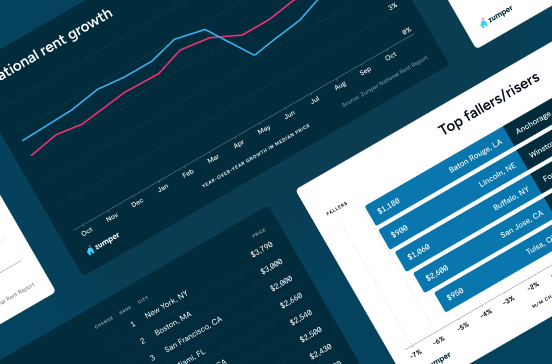
Rent trends in Waban, Newton, MA
Average rent prices in Waban have decreased by 4% over the last month and have decreased by 19% since last year.
Rent trends
Rent prices on this page are calculated on a rolling 30-day basis and updated daily.
Compare rent prices in
Waban, Newton, MA
Rent prices in Waban vary by bedroom size, rental type, and neighborhood. The average rent for an apartment in Waban is $3,595, whereas a house costs $5,200. 1-bedroom apartments in Waban run $2,750 on average, while 2-bedroom apartments are $3,100.
Listings | ||||
|---|---|---|---|---|
Studio | $2,300 | No Change | - | |
1 bedroom | $2,753 | No Change | - | |
2 bedroom | $3,350 |  1% |  62% | |
3 bedroom | $4,000 | No Change | 32% | |
4 bedroom | $7,000 | 7% | 22% |
Listings | ||
|---|---|---|
Auburndale | $2,700 | |
Bank Square | $3,285 | |
Newton Highlands | $4,155 | |
Newton Lower Falls | $2,975 | |
Newton Upper Falls | $3,612 | |
Upper Washington Spring Street | $2,750 |
Listings | ||||
|---|---|---|---|---|
Apartments | $3,595 | 6% | No Change | |
Condos | $3,050 | 3% | No Change | |
Houses | $5,200 | 7% | No Change | |
Rooms | $1,150 | 9% | - |
Studio
Average rent
$2,300
1 bedroom
Average rent
$2,753
2 bedroom
Average rent
$3,350
Last 30 days
1%
Last year
62%
3 bedroom
Average rent
$4,000
Last 30 days
No Change
Last year
32%
4 bedroom
Average rent
$7,000
Last 30 days
7%
Last year
22%
Upper Washington Spring Street
Average rent
$2,750
Auburndale
Average rent
$2,700
Newton Highlands
Average rent
$4,155
Newton Lower Falls
Average rent
$2,975
Newton Upper Falls
Average rent
$3,612
Bank Square
Average rent
$3,285
Apartments
Average rent
$3,595
Last 30 days
6%
Condos
Average rent
$3,050
Last 30 days
3%
Houses
Average rent
$5,200
Last 30 days
7%
Rooms
Average rent
$1,150
Last 30 days
9%
The table above reflects average rent prices in Waban, Newton, MA, broken down by the number of bedrooms, neighborhoods, and property types. The availability of data for each category is dependent on market inventory and will adjust depending on your selected filters.
How does rent in Waban, Newton, MA compare to other neighborhoods?
Compare median rent prices in Waban and Upper Washington Spring Street by all bedroom counts and property types.
Waban
higher than the national median
higher than the national median
Takeaway
The median rent for all rentals in Waban, Newton, MA is 31% higher than the median rent in Upper Washington Spring Street, Boston, MA.
Average rent in nearby neighborhoods
Explore rent trends in neighboring markets
Discover rentals in Waban, Newton, MA

5d+ ago
Waban house for rent in Newton
17 Cotter Rd #NA, Newton, MA 02468
3 beds
1 bath
$3,295
The price shown reflects a 12-month lease and includes base rent plus all required monthly fees provided by the property.House for rent
Available Aug 7

5d+ ago
Waban house for rent in Newton
5 beds
4.5 baths
$15,000
The price shown reflects a 12-month lease. Fees may apply.House for rent

5d+ ago
Waban condo for rent in Newton
52 Troy Ln #52, Newton, MA 02468
2 beds
2 baths
$4,750
$4,450
Price drop
The price shown reflects a 12-month lease and includes base rent plus all required monthly fees provided by the property.Condo for rent
Available Sep 1

3d ago
1482 Beacon St, Newton, MA 02468
Studio–1 bed
1 bath
$2,050–$2,750
The price shown reflects a 12-month lease and includes base rent plus all required monthly fees provided by the property.Apartment for rent
5d+ ago
Waban condo for rent in Newton
52 Troy Ln #52, Newton, MA 02468
2 beds
2 baths
$4,750
$4,450
Price drop
The price shown reflects a 12-month lease and includes base rent plus all required monthly fees provided by the property.Condo for rent
Available Sep 1
5d+ ago
Waban house for rent in Newton
5 beds
4.5 baths
$15,000
The price shown reflects a 12-month lease. Fees may apply.House for rent

5d+ ago
Waban apartment for rent in Newton
2 beds
1 bath
$2,900
The price shown reflects a 12-month lease. Fees may apply.Apartment for rent
Available Sep 1

5d+ ago
Waban townhouse for rent in Newton
4 beds
4 baths
$5,200
The price shown reflects a 12-month lease. Fees may apply.House for rent

2d ago
Waban townhouse for rent in Newton
4 beds
4 baths
$5,200
The price shown reflects a 12-month lease. Fees may apply.House for rent
Available Jun 1
3d ago
1482 Beacon St, Newton, MA 02468
Studio–1 bed
1 bath
$2,050–$2,750
The price shown reflects a 12-month lease and includes base rent plus all required monthly fees provided by the property.Apartment for rent
5d+ ago
Waban house for rent in Newton
5 beds
4.5 baths
$15,000
The price shown reflects a 12-month lease. Fees may apply.House for rent
5d+ ago
Waban townhouse for rent in Newton
4 beds
4 baths
$5,200
The price shown reflects a 12-month lease. Fees may apply.House for rent


5d+ ago
Waban house for rent in Newton
17 Cotter Rd #NA, Newton, MA 02468
3 beds
1 bath
$3,295
The price shown reflects a 12-month lease and includes base rent plus all required monthly fees provided by the property.House for rent
Available Aug 7
5d+ ago
Waban condo for rent in Newton
52 Troy Ln #52, Newton, MA 02468
2 beds
2 baths
$4,750
$4,450
Price drop
The price shown reflects a 12-month lease and includes base rent plus all required monthly fees provided by the property.Condo for rent
Available Sep 1
5d+ ago
Waban condo for rent in Newton
2 beds
1.5 baths
$3,500
The price shown reflects a 12-month lease. Fees may apply.Condo for rent
Available Aug 1
5d+ ago
Waban apartment for rent in Newton
2 beds
1 bath
$2,900
The price shown reflects a 12-month lease. Fees may apply.Apartment for rent
Available Sep 1

Stay up to date with rental market insights

Are you interested in licensing our current and historical rental real estate data, or do you have custom data requests? Contact datalicensing@zumper.com.
Frequently asked questions for Waban, Newton, MA
Quick answers to common questions about the Waban rental market.
How much is rent in Waban?
The average rent in Waban is $3,600 per month as of July 11, 2026.
Is rent up or down in Waban?
Average rent prices in Waban have decreased by 4% over the last month and have decreased by 19% since last year.
How does Waban rent compare to the national average?
Rent in Waban is 85% above the national average, which means renters are paying approximately $1,650 more per month.
What salary do I need to afford rent in Waban?
To comfortably afford rent in Waban, you'd need to earn approximately $144,000/year, based on spending no more than 30% of your income on rent.
Methodology
Rent prices are based on Zumper's rental listings from the past 30 days. Median rent is calculated across all available listings and property types on the platform. If you filter the page by bedroom count or property type, the pricing throughout the page will update automatically to reflect that segment of the rental market.
Household and population data come from the U.S. Census Bureau. Cost-of-living data is sourced from the Council for Community and Economic Research's Cost of Living Index (COLI).