
Bedroom count
Property type
Last updated on July 30, 2026
Average rent in
Marigny, New Orleans, LA
Average rent in
Last updated on July 30, 2026
Bedroom count
Property type
Median rent
Median rent in Marigny
$1,875/mo
vs previous year
The average rent in Marigny is $1,875 per month as of July 2026. This is 3% below the national average rent, or $55 less per month.
average price per square foot
Total rentals
Available rentals in Marigny
18
for rent on Zumper.com as of July 2026
Rent price distribution
Share of Marigny rentals at each price point
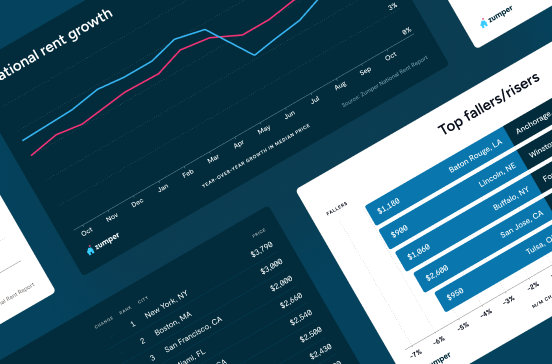
Rent trends in Marigny, New Orleans, LA
Average rent prices in Marigny have decreased by 11% over the last month and have increased by 3% since last year.
Rent trends
Rent prices on this page are calculated on a rolling 30-day basis and updated daily.
Compare rent prices in
Marigny, New Orleans, LA
Rent prices in Marigny vary by bedroom size, rental type, and neighborhood. The average rent for an apartment in Marigny is $1,650, whereas a house costs $2,475. 1-bedroom apartments in Marigny run $1,450 on average, while 2-bedroom apartments are $1,875.
Listings | ||||
|---|---|---|---|---|
Studio | $1,082 |  17% | - | |
1 bedroom | $1,446 | 1% | 26% | |
2 bedroom | $2,200 | 18% |  18% | |
3 bedroom | $3,200 | No Change | 54% | |
4 bedroom | $7,000 | 1% | - |
Listings | ||
|---|---|---|
Algiers Point | $1,687 | |
Bayou St John | $1,787 | |
Bywater | $1,275 | |
Fairgrounds | $1,597 | |
St Claude | $1,425 | |
Whitney | $1,950 |
Listings | ||||
|---|---|---|---|---|
Apartments | $1,650 | 14% | No Change | |
Condos | $2,186 | No Change | No Change | |
Houses | $2,475 | 6% | No Change |
Studio
Average rent
$1,082
Last 30 days
17%
1 bedroom
Average rent
$1,446
Last 30 days
1%
Last year
26%
2 bedroom
Average rent
$2,200
Last 30 days
18%
Last year
18%
3 bedroom
Average rent
$3,200
Last 30 days
No Change
Last year
54%
4 bedroom
Average rent
$7,000
Last 30 days
1%
Algiers Point
Average rent
$1,687
Bayou St John
Average rent
$1,787
Bywater
Average rent
$1,275
Fairgrounds
Average rent
$1,597
St Claude
Average rent
$1,425
Whitney
Average rent
$1,950
Apartments
Average rent
$1,650
Last 30 days
14%
Condos
Average rent
$2,186
Houses
Average rent
$2,475
Last 30 days
6%
The table above reflects average rent prices in Marigny, New Orleans, LA, broken down by the number of bedrooms, neighborhoods, and property types. The availability of data for each category is dependent on market inventory and will adjust depending on your selected filters.
How does rent in Marigny, New Orleans, LA compare to other neighborhoods?
Compare median rent prices in Marigny and Algiers Point by all bedroom counts and property types.
Marigny
lower than the national median
lower than the national median
Takeaway
The median rent for all rentals in Marigny, New Orleans, LA is 11% higher than the median rent in Algiers Point, New Orleans, LA.
Average rent in nearby neighborhoods
Explore rent trends in neighboring markets
Discover rentals in Marigny, New Orleans, LA

5d+ ago
Marigny apartment for rent in New Orleans
1 bed
1 bath
$995
Apartment for rent

3d ago
Marigny apartment for rent in New Orleans
2320 Chartres St #B, New Orleans, LA 70117
2 beds
1 bath
$1,350
Apartment for rent

5d+ ago
Marigny apartment for rent in New Orleans
2 beds
2 baths
$1,875
Apartment for rent

5d+ ago
Marigny condo for rent in New Orleans
2 beds
1 bath
$1,900
Condo for rent


5d+ ago
Marigny apartment for rent in New Orleans
600 Marigny St, New Orleans, LA 70117
1 bed
1 bath
$1,750
Apartment for rent

5d+ ago
Marigny apartment for rent in New Orleans
2327 Dauphine St, New Orleans, LA 70117
1 bed
1 bath
$1,700
Apartment for rent

5d+ ago
Verified
2433 Chartres St #2433, New Orleans, LA 70117
1 bed
2 baths
$1,650
Apartment for rent
Available Aug 1

5d+ ago
Marigny apartment for rent in New Orleans
1 bed
1 bath
$1,450
Apartment for rent


5d+ ago
Verified
2433 Chartres St #2433, New Orleans, LA 70117
1 bed
2 baths
$1,650
Apartment for rent
Available Aug 1

13h ago
Verified
2317 N Rampart St, New Orleans, LA 70117
2–4 beds
2–3 baths
$1,809–$5,621
Apartment for rent

1d ago
2221 Burgundy St, New Orleans, LA 70117
1 bed
1 bath
$1,295
Apartment for rent
5d+ ago
2322 Burgundy Street ##D, New Orleans, LA 70117
3 beds
3 baths
$2,390
Apartment for rent
Available Jan 18
13h ago
Verified
2317 N Rampart St, New Orleans, LA 70117
2–4 beds
2–3 baths
$1,809–$5,621
Apartment for rent
5d+ ago
Verified
2433 Chartres St #2433, New Orleans, LA 70117
1 bed
2 baths
$1,650
Apartment for rent
Available Aug 1
5d+ ago
Marigny condo for rent in New Orleans
2 beds
1 bath
$1,900
Condo for rent
5d+ ago
Marigny apartment for rent in New Orleans
2 beds
2 baths
$1,875
Apartment for rent
5d+ ago
Verified
2433 Chartres St #2433, New Orleans, LA 70117
1 bed
2 baths
$1,650
Apartment for rent
Available Aug 1
5d+ ago
Marigny apartment for rent in New Orleans
939 Elysian Fields Ave #6, New Orleans, LA 70117
Studio
1 bath
$1,000
Apartment for rent
Available Jul 6
5d+ ago
Marigny apartment for rent in New Orleans
600 Marigny St, New Orleans, LA 70117
1 bed
1 bath
$1,750
Apartment for rent
5d+ ago
Marigny apartment for rent in New Orleans
939 Elysian Fields Ave #5, New Orleans, LA 70117
Studio
1 bath
$1,000
Apartment for rent
Available Jul 6
Stay up to date with rental market insights

Are you interested in licensing our current and historical rental real estate data, or do you have custom data requests? Contact datalicensing@zumper.com.
Frequently asked questions for Marigny, New Orleans, LA
Quick answers to common questions about the Marigny rental market.
How much is rent in Marigny?
The average rent in Marigny is $1,875 per month as of July 25, 2026.
Is rent up or down in Marigny?
Average rent prices in Marigny have decreased by 11% over the last month and have increased by 3% since last year.
How does Marigny rent compare to the national average?
Rent in Marigny is 3% below the national average, which means renters are paying approximately $55 less per month.
What salary do I need to afford rent in Marigny?
To comfortably afford rent in Marigny, you'd need to earn approximately $75,000/year, based on spending no more than 30% of your income on rent.
Methodology
Rent prices are based on Zumper's rental listings from the past 30 days. Median rent is calculated across all available listings and property types on the platform. If you filter the page by bedroom count or property type, the pricing throughout the page will update automatically to reflect that segment of the rental market.
Household and population data come from the U.S. Census Bureau. Cost-of-living data is sourced from the Council for Community and Economic Research's Cost of Living Index (COLI).