
Bedroom count
Property type
Last updated on June 27, 2026
Average rent in
Chicago, IL
Average rent in
Last updated on June 27, 2026
Bedroom count
Property type
Key takeaways for renters
The bottom line
Chicago, IL rent rose 7.5% year over year, with a current median of $2,257/month. Renters are paying $151 more per month on average than last year, despite a slight 1.1% month-over-month decline from the recent peak in May 2026.
Compared to national trends
Chicago runs 15.7% more expensive than the $1,950/month national median, positioning it as a pricier major metro with 10,102 total rentals available across the city.
Price ranges
Studios in Chicago rent for $1,675/month, 1-bedrooms for $2,195/month, and 2-bedrooms for $2,569/month, with 4+ bedrooms reaching $4,000/month. Houses command a median of $2,500/month compared to $2,200/month for apartments, reflecting distinct price tiers across property types.
Neighborhood spotlight
Fuller Park rents fell 68.2% year over year to $1,905/month across 27 rentals, a stark contrast to the citywide 7.5% rise. River North leads the market at $3,673/month, up 19.2%, showing wide local variation in Chicago's rental market.
Median rent
Median rent in Chicago
$2,257/mo
vs previous year
The average rent in Chicago is $2,257 per month as of June 2026. This is 16% above the national average rent, or $307 more per month.
average price per square foot
Total rentals
Available rentals in Chicago
10,102
for rent on Zumper.com as of June 2026
Rent price distribution
Share of Chicago rentals at each price point
Rent trends in Chicago, IL
Average rent prices in Chicago have decreased by 1% over the last month and have increased by 7% since last year.
Rent trends
Rent prices on this page are calculated on a rolling 30-day basis and updated daily.
Compare rent prices in
Chicago, IL
Rent prices in Chicago vary by bedroom size, rental type, and neighborhood. The average rent for an apartment in Chicago is $2,200, whereas a house costs $2,500. 1-bedroom apartments in Chicago run $2,150 on average, while 2-bedroom apartments are $2,500.
Listings | ||||
|---|---|---|---|---|
Studio | $1,675 |  2% | 9% | |
1 bedroom | $2,195 | 1% | 8% | |
2 bedroom | $2,569 | 1% | 5% | |
3 bedroom | $3,000 | 1% | 7% | |
4 bedroom | $4,000 |  4% | 9% |
Listings | ||
|---|---|---|
Evanston | $2,295 | |
Hyde Park | $2,087 | |
Lakeview | $2,295 | |
Lincoln Park | $2,674 | |
Loop | $2,800 | |
Near North Side | $3,000 | |
Near West Side | $3,000 | |
Rogers Park | $1,675 | |
Uptown | $1,875 | |
West Town | $2,750 |
Listings | ||||
|---|---|---|---|---|
Apartments | $2,200 | 1% | No Change | |
Condos | $2,550 | No Change | No Change | |
Houses | $2,500 | No Change | No Change | |
Rooms | $1,695 | 9% | No Change |
Studio
Average rent
$1,675
Last 30 days
2%
Last year
9%
1 bedroom
Average rent
$2,195
Last 30 days
1%
Last year
8%
2 bedroom
Average rent
$2,569
Last 30 days
1%
Last year
5%
3 bedroom
Average rent
$3,000
Last 30 days
1%
Last year
7%
4 bedroom
Average rent
$4,000
Last 30 days
4%
Last year
9%
Lakeview
Average rent
$2,295
Near North Side
Average rent
$3,000
Near West Side
Average rent
$3,000
Rogers Park
Average rent
$1,675
Loop
Average rent
$2,800
Lincoln Park
Average rent
$2,674
West Town
Average rent
$2,750
Uptown
Average rent
$1,875
Evanston
Average rent
$2,295
Hyde Park
Average rent
$2,087
Apartments
Average rent
$2,200
Last 30 days
1%
Condos
Average rent
$2,550
Last 30 days
No Change
Houses
Average rent
$2,500
Last 30 days
No Change
Rooms
Average rent
$1,695
Last 30 days
9%
The table above reflects average rent prices in Chicago, IL, broken down by the number of bedrooms, neighborhoods, and property types. The availability of data for each category is dependent on market inventory and will adjust depending on your selected filters.
How does rent in Chicago, IL compare to other cities?
Compare median rent prices in Chicago and Alsip by all bedroom counts and property types.
Chicago
higher than the national median
lower than the national median
Takeaway
The median rent for all rentals in Chicago, IL is 61% higher than the median rent in Alsip, IL.
Average rent in nearby cities
Explore rent trends in neighboring markets
$1,400
$1,295
$1,400
$1,200
$2,110
$1,495
$1,699
$1,600
$1,355
$1,650
$2,080
$2,299
Cost of living in Chicago, IL
Explore the cost of essential expenses, and then use our rent calculator to find out how much rent you can afford.
Expenses accrued by most renters | Average cost compared to national average |
|---|---|
| Goods & Services | 11% higher |
| Groceries | 4% higher |
| Health | 15% higher |
| Housing | 45% higher |
| Transportation | 3% higher |
| Utilities | 4% lower |
Discover rentals in Chicago, IL

4d ago
Verified
1209 East Madison Park, Chicago, IL 60615
4–5 beds
2–3 baths
Call for price
Apartment for rent

4d ago
Verified
532 Hinman Avenue, Chicago, IL 60202
1–2 beds
1 bath
Call for price
Apartment for rent

4d ago
Verified
5111 West Montrose Avenue, Chicago, IL 60641
1–3 beds
1–2 baths
Call for price
Apartment for rent

5d+ ago
West Englewood house for rent in Chicago
6012 S Honore St, Chicago, IL 60636
1 bed
1 bath
$600
House for rent
Available Jun 5


4d ago
6858 S Halsted St, Chicago, IL 60621
2 beds
2 baths
$58,000
Condo for rent
Available Jun 27

19h ago
1140 N Wells St, Chicago, IL 60610
Studio–4 beds
1–4 baths
$1,896–$45,000
Apartment for rent

5d+ ago
Verified
3923 N Ashland Ave #B, Chicago, IL 60613
3 beds
2 baths
$40,000
Apartment for rent
Available Apr 15

5d+ ago
Verified
3923 N Ashland Ave #A, Chicago, IL 60613
3 beds
2 baths
$40,000
Apartment for rent
Available Apr 15


8h ago
Verified
4726 S Woodlawn Ave, Chicago, IL 60615
Studio–2 beds
1 bath
$1,170–$2,154
Apartment for rent

11h ago
Verified
5200 S Blackstone Ave, Chicago, IL 60615
1–2 beds
1–2 baths
$1,685–$2,370
Apartment for rent

2h ago
Verified
29 S La Salle St, Chicago, IL 60603
Studio–2 beds
1–2 baths
$2,577–$4,959
Apartment for rent

13h ago
Verified
5035 S East End Ave, Chicago, IL 60615
Studio–3 beds
1–9 baths
$1,740–$3,505
Apartment for rent


11h ago
Verified
5200 S Blackstone Ave, Chicago, IL 60615
1–2 beds
1–2 baths
$1,685–$2,370
Apartment for rent
2h ago
Verified
29 S La Salle St, Chicago, IL 60603
Studio–2 beds
1–2 baths
$2,577–$4,959
Apartment for rent

2d ago
Verified
5633 N Winthrop Ave, Chicago, IL 60660
Studio–1 bed
1 bath
$1,275–$1,595
Apartment for rent

3d ago
Verified
5300 N Sheridan Rd, Chicago, IL 60640
Studio–1 bed
1 bath
$1,275–$1,695
Apartment for rent


8h ago
Verified
4726 S Woodlawn Ave, Chicago, IL 60615
Studio–2 beds
1 bath
$1,170–$2,154
Apartment for rent
11h ago
Verified
5200 S Blackstone Ave, Chicago, IL 60615
1–2 beds
1–2 baths
$1,685–$2,370
Apartment for rent
2h ago
Verified
29 S La Salle St, Chicago, IL 60603
Studio–2 beds
1–2 baths
$2,577–$4,959
Apartment for rent
13h ago
Verified
5035 S East End Ave, Chicago, IL 60615
Studio–3 beds
1–9 baths
$1,740–$3,505
Apartment for rent

Stay up to date with rental market insights


Are you interested in licensing our current and historical rental real estate data, or do you have custom data requests? Contact datalicensing@zumper.com.
Frequently asked questions for Chicago, IL
Quick answers to common questions about the Chicago rental market.
How much is rent in Chicago?
The average rent in Chicago is $2,257 per month as of June 27, 2026.
Is rent up or down in Chicago?
Average rent prices in Chicago have decreased by 1% over the last month and have increased by 7% since last year.
How does Chicago rent compare to the national average?
Rent in Chicago is 16% above the national average, which means renters are paying approximately $307 more per month.
Which neighborhoods are most affordable in Chicago?
The most affordable neighborhoods in Chicago are Rogers Park ($1,675/mo), Uptown ($1,875/mo), and Hyde Park ($2,087/mo).
What salary do I need to afford rent in Chicago?
To comfortably afford rent in Chicago, you'd need to earn approximately $90,000/year, based on spending no more than 30% of your income on rent.
When is the best time of year to rent in Chicago?
Chicago's 2025 rental market shows one-bedroom apartments averaging around $2,000 per month, while two-bedroom units rent for around $2,500 monthly. These figures reflect the current market conditions across the city's diverse neighborhoods and building types.
Methodology
Rent prices are based on Zumper's rental listings from the past 30 days. Median rent is calculated across all available listings and property types on the platform. If you filter the page by bedroom count or property type, the pricing throughout the page will update automatically to reflect that segment of the rental market.
Household and population data come from the U.S. Census Bureau. Cost-of-living data is sourced from the Council for Community and Economic Research's Cost of Living Index (COLI).
For additional insights into rental trends, including month-over-month changes and historical comparisons, see Zumper's Monthly Metro Report.
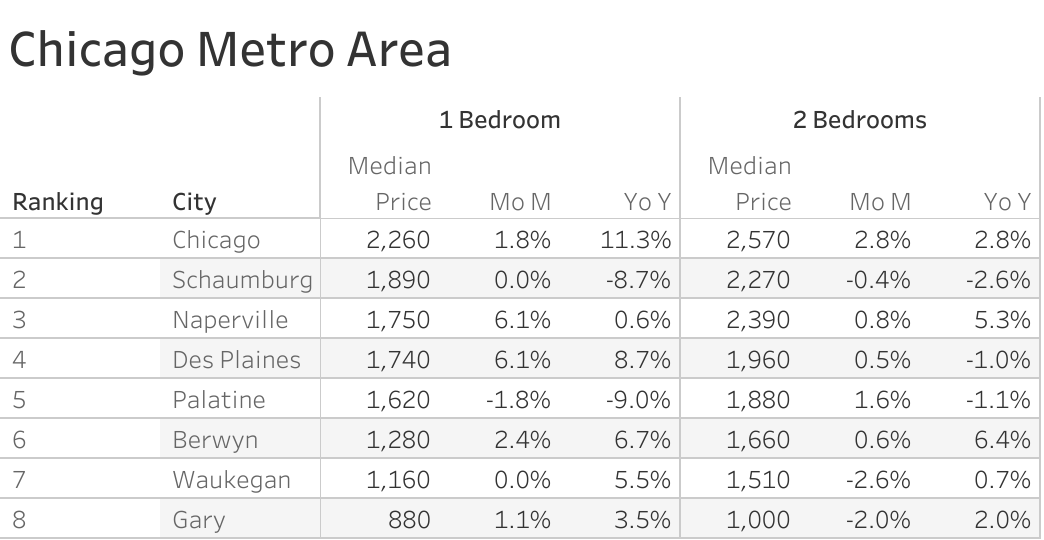
Chicago Metro Report
The Zumper Chicago Metro Area Report analyzed active listings last month across metro cities to highlight the most and least expensive cities and cities with the fastest growing rents. The Illinois one bedroom median rent was $1,489 last month.
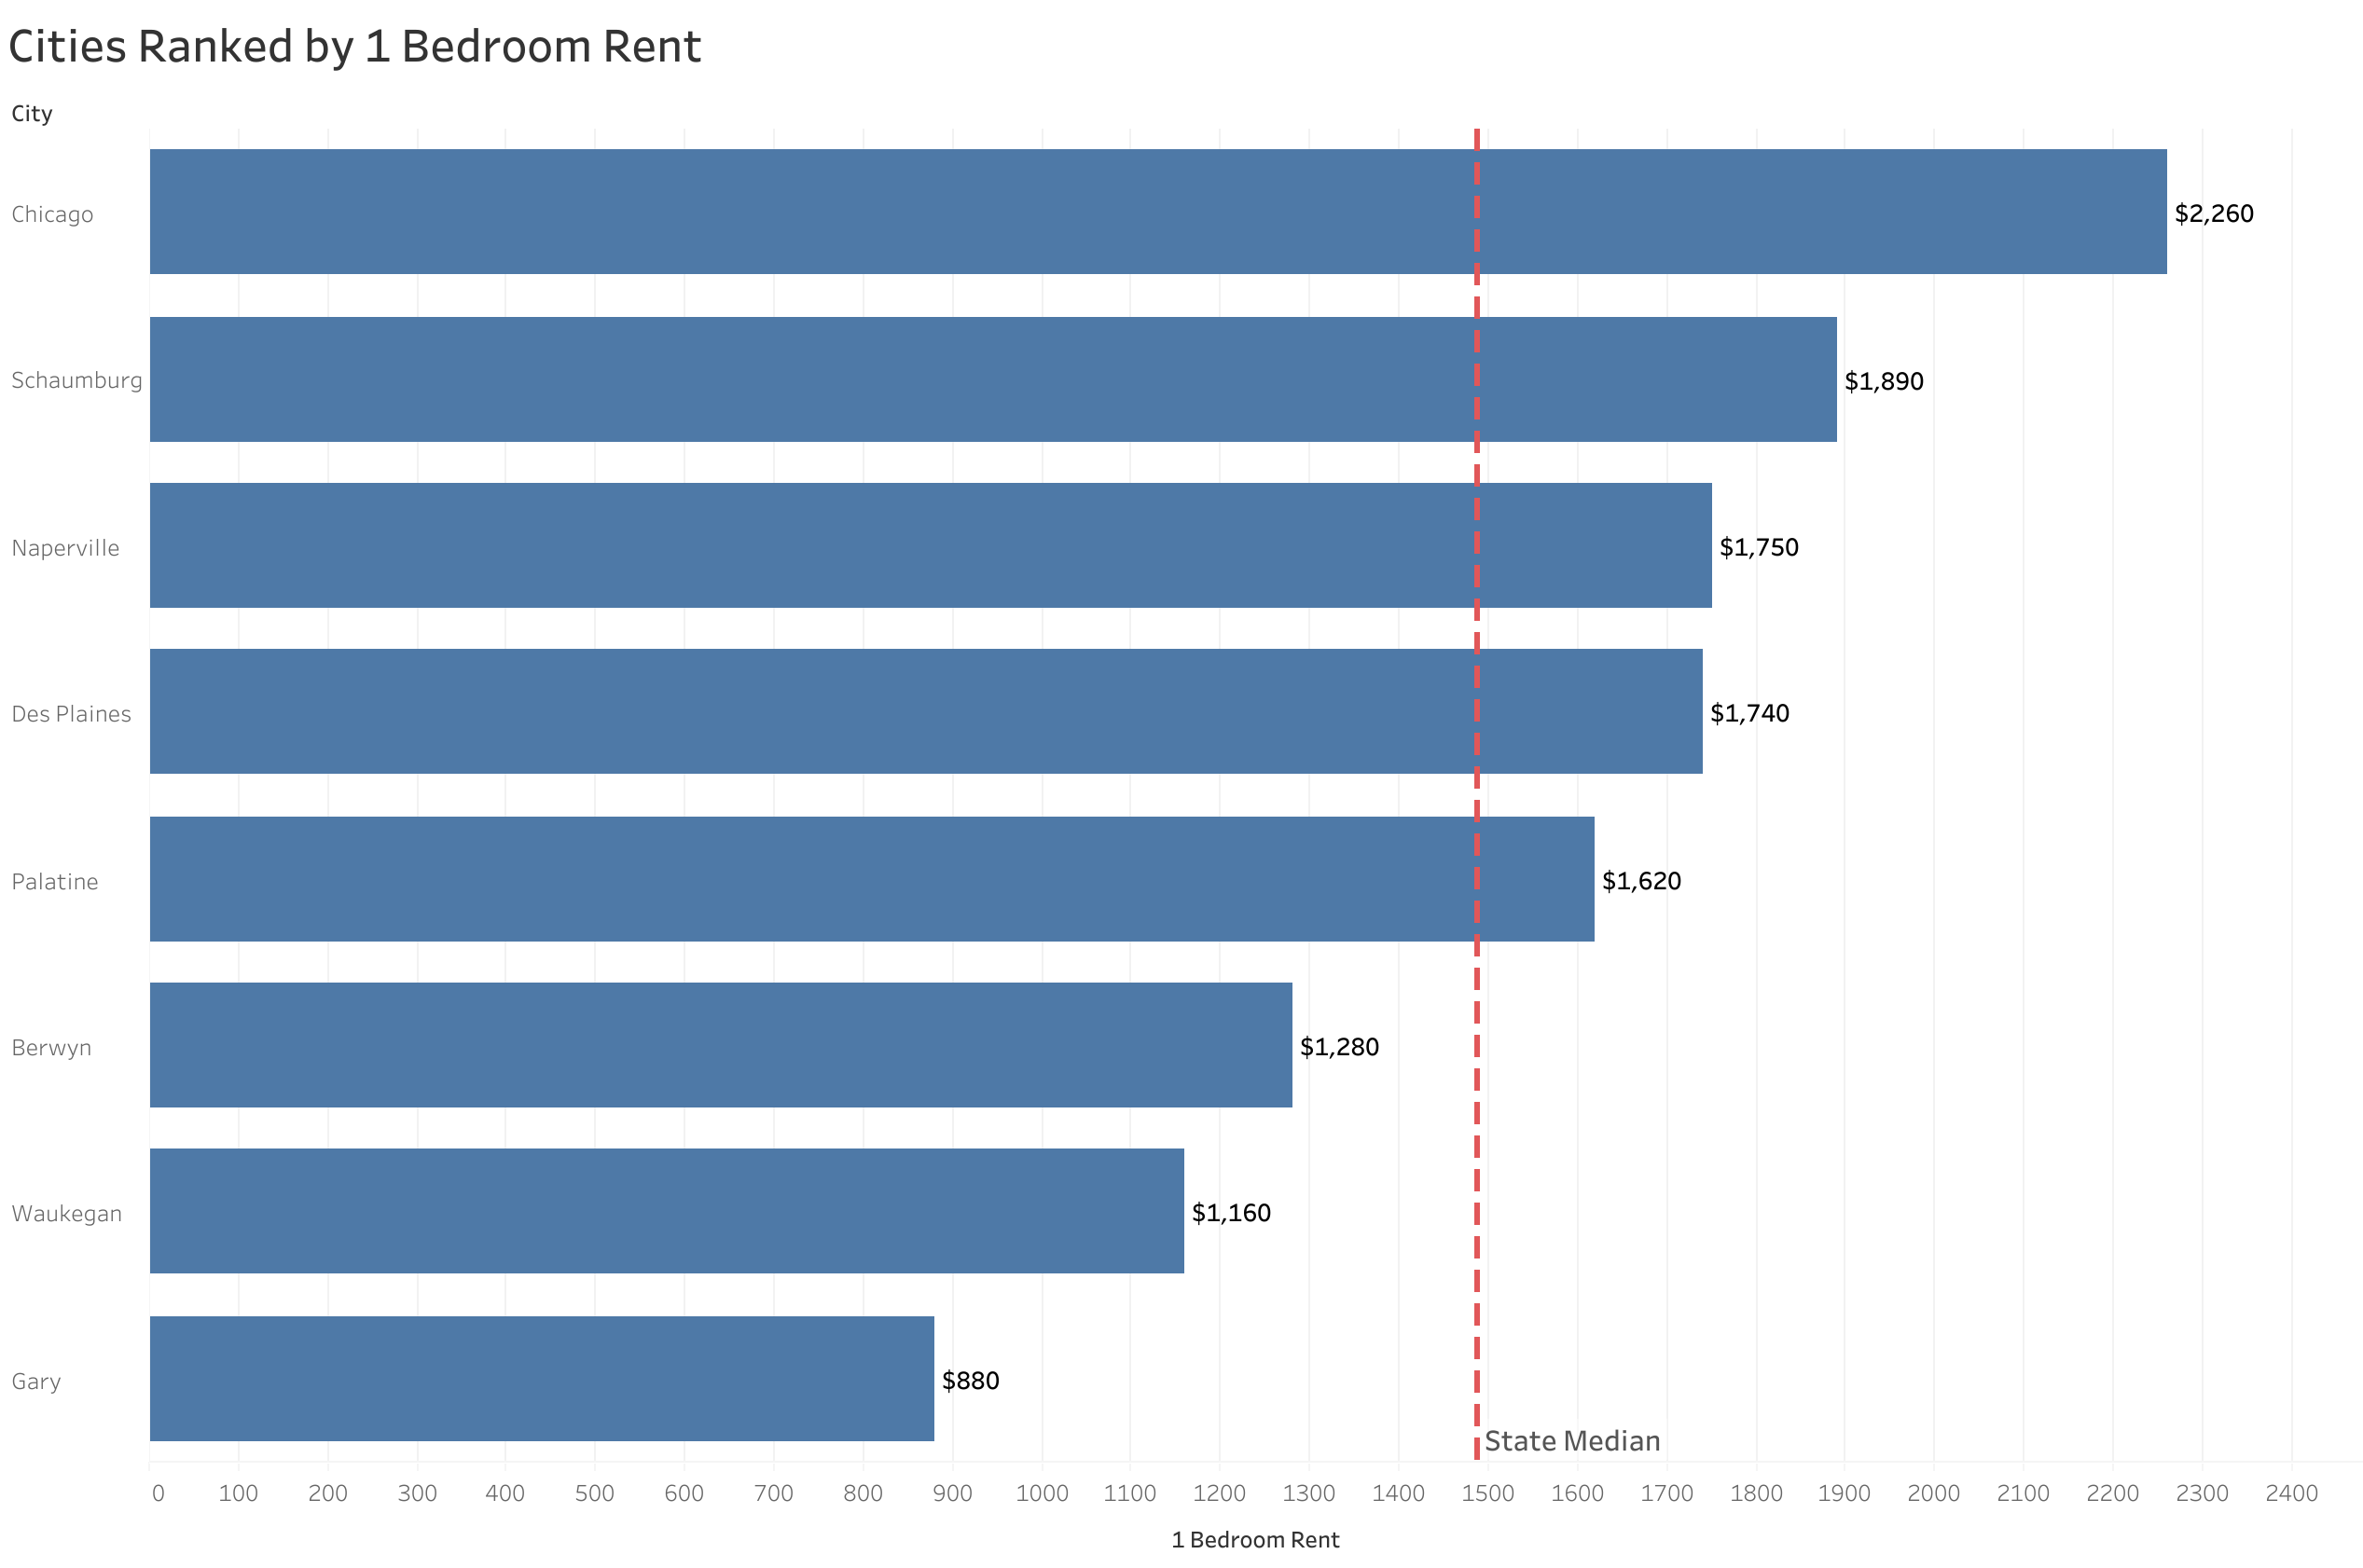
The Most Expensive
- Chicago was the most expensive city with one-bedroom rent priced at $2,260.
- Schaumburg ranked as the second priciest with rent at $1,890.
- Naperville placed third with rent at $1,750.
The Least Expensive
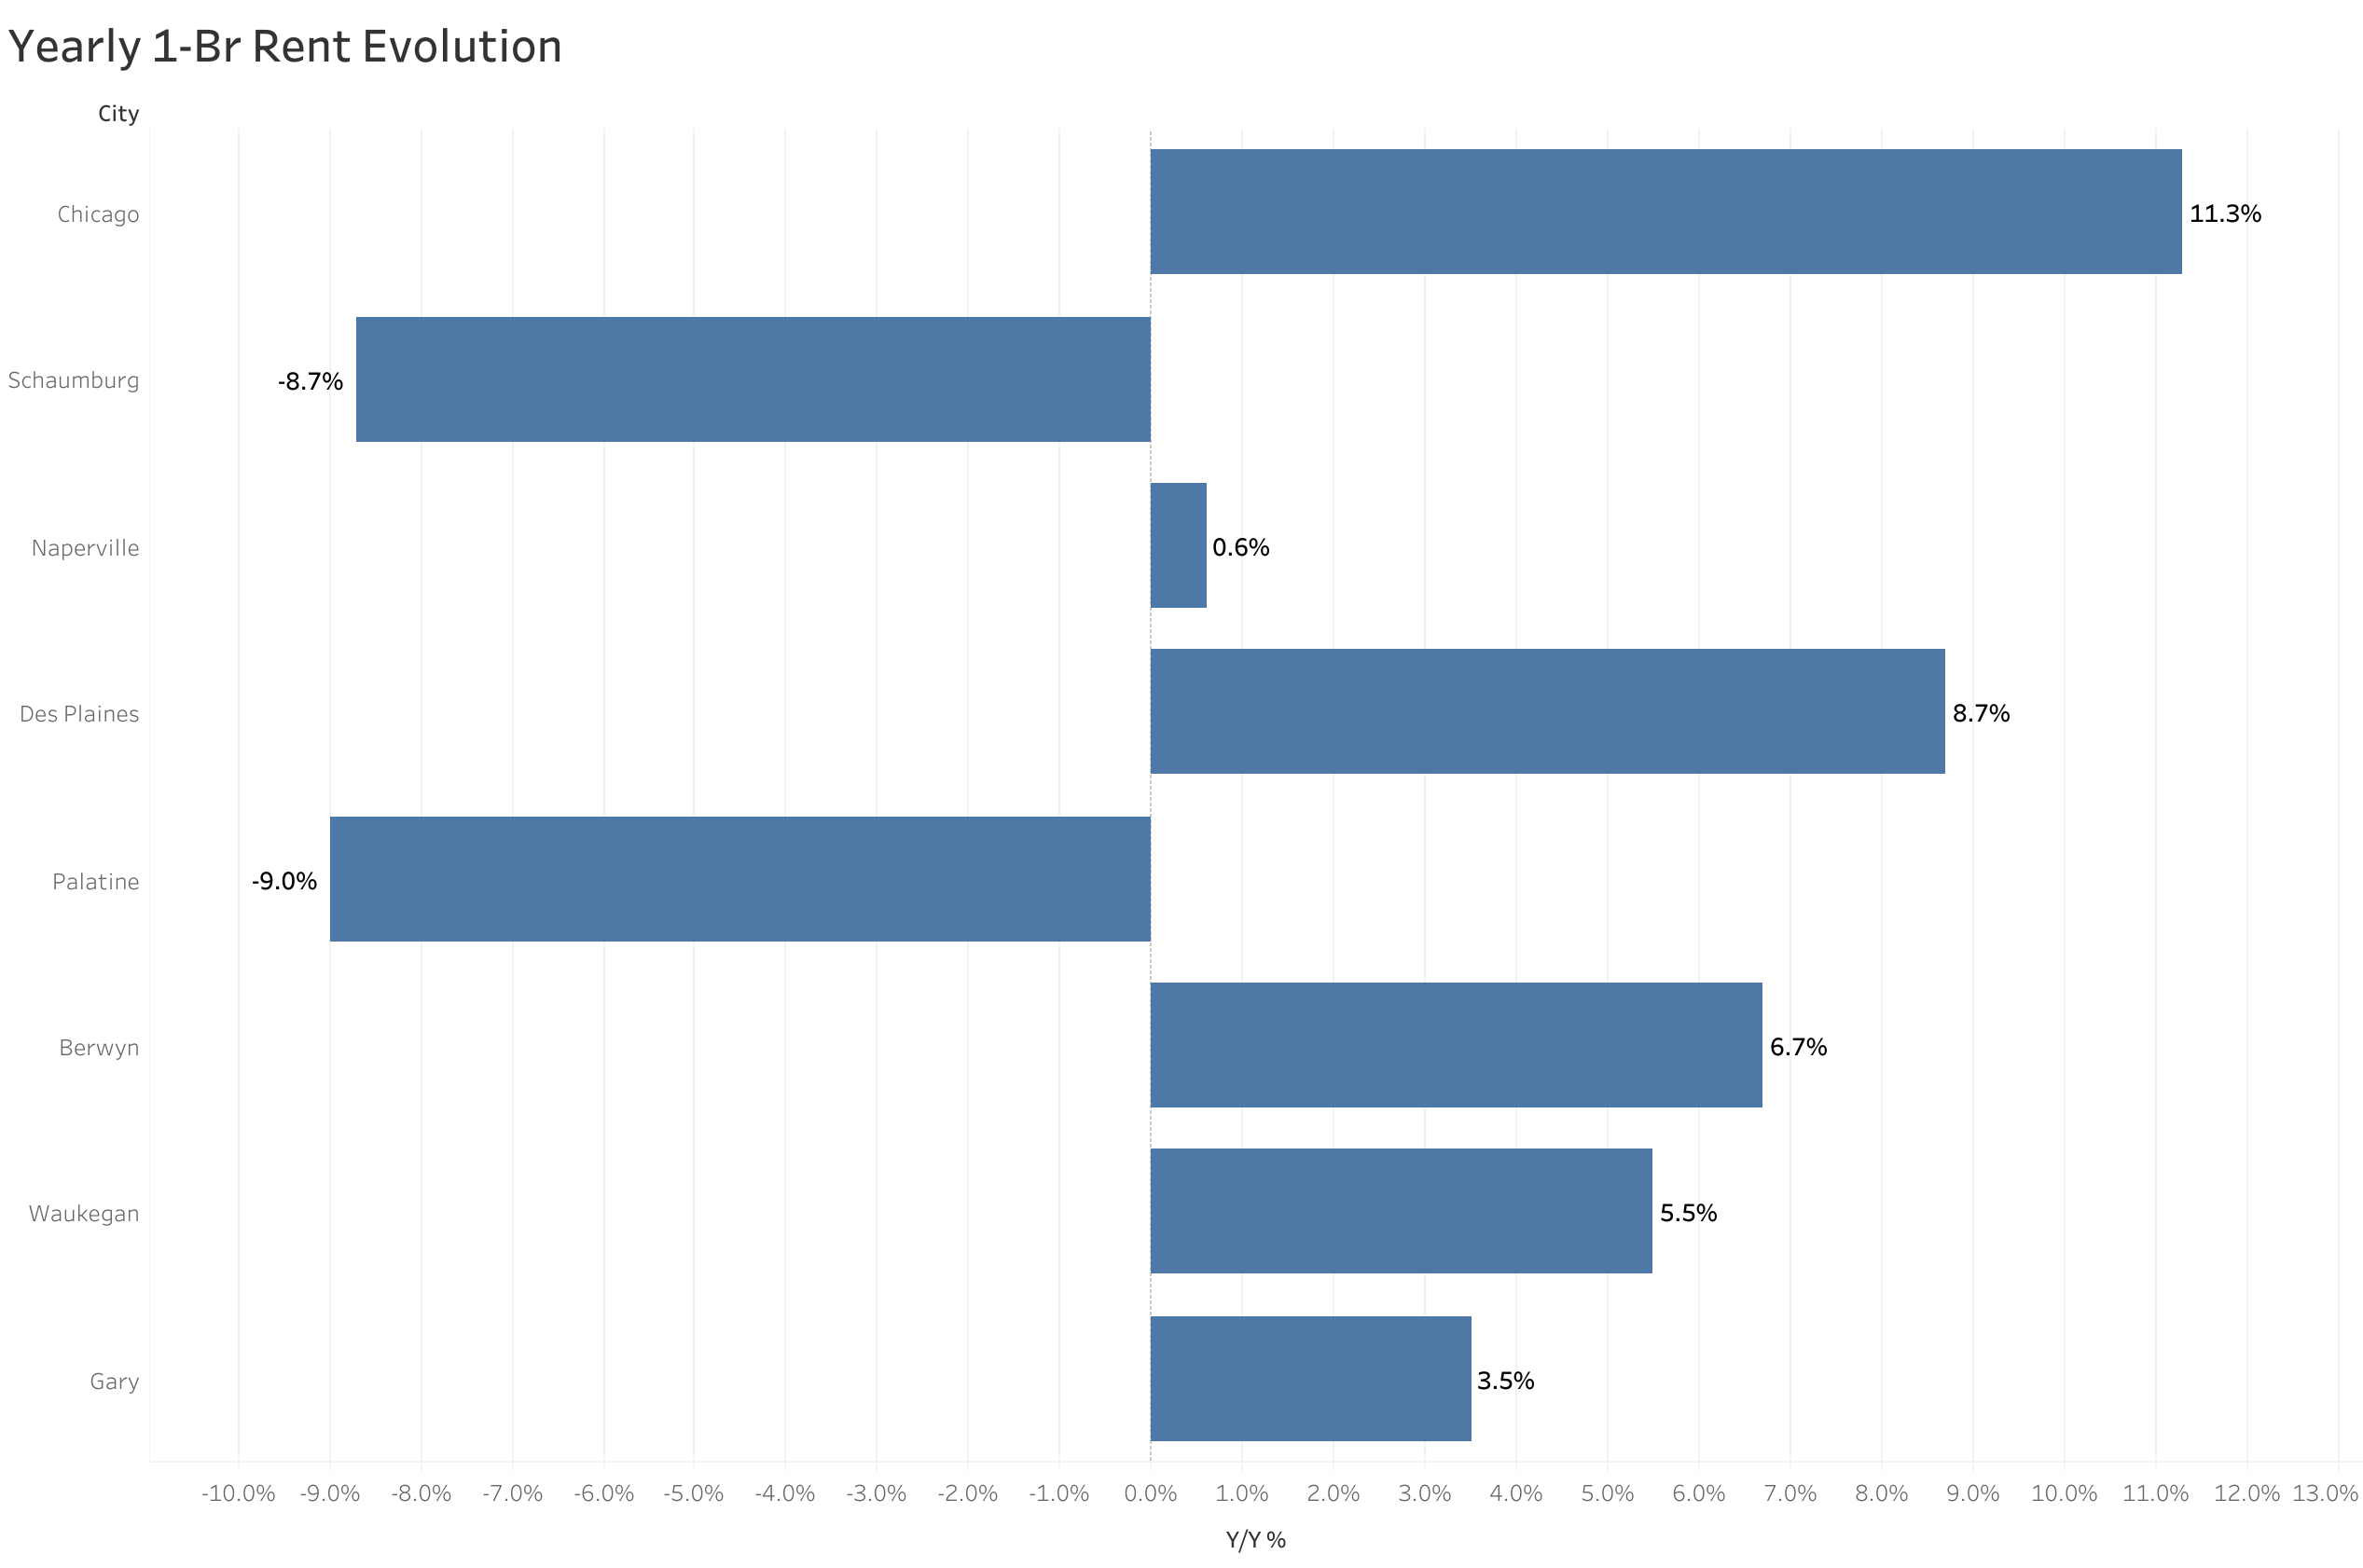
The Fastest Growing (Y/Y%)
- Chicago had the fastest growing rent, up 11.3% since this time last year.
- Des Plaines saw rent climb 8.7%, making it the second fastest growing.
- Berwyn was third with rent increasing 6.7%.
The Fastest Growing (M/M%)
- Naperville & Des Plaines tied for the city with the fastest growing rent, both up 6.1% last month.
- Berwyn was second with rent climbing 2.4%.
- Chicago placed third with rent increasing 1.8%.
About
The Zumper Chicago Metro Area Report analyzed active listings that hit the market last month. Listings are aggregated by city to calculate median asking rents.
Words by
Crystal ChenCrystal Chen is a seasoned real estate and housing market expert with more than a decade of experience analyzing rental trends, housing affordability, and urban living. At Zumper, she leads data storytelling as well as press and media relations, where she translates complex housing research into easily digestible insights for renters, industry professionals, and journalists. Her reports can be seen cited in national outlets like The New York Times, The Wall Street Journal, and CNBC. She is passionate about helping renters navigate today’s evolving housing landscape with clarity and confidence. Living in New York City herself, she knows firsthand the chaos and challenges of navigating a competitive rental market.