
Bedroom count
Property type
Last updated on July 29, 2026
Average rent in
Alpharetta, GA
Average rent in
Last updated on July 29, 2026
Bedroom count
Property type
Key takeaways for renters
Where Alpharetta rent stands today
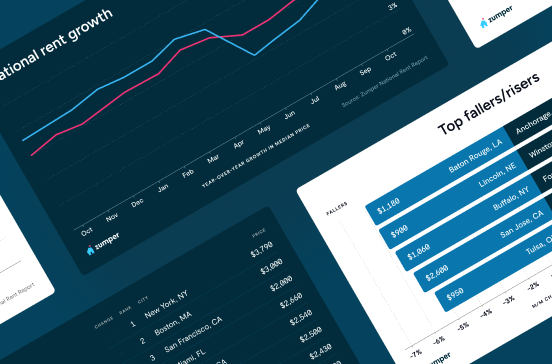
Alpharetta, GA rent rose 10.4% year over year, with a current median of $2,650/month. Renters today are paying $107 more per month on average than last year, reaching the peak median rent of $2,450/month in July 2026.
Vs. national rents
Alpharetta runs roughly 1.4× the $1,930/month national median, placing it among pricier suburban markets with a strong presence of houses making up 79.4% of total rentals.
Price ranges
Studios in Alpharetta sit at $2,650/month, 1-bedrooms at $1,629/month, and 4+ bedrooms at $3,550/month. Houses rent for a median of $3,000/month while apartments sit at $2,122/month, reflecting distinct price tiers for renters.
Neighborhood spotlight
Crabapple rents fell 33.3% year over year to $3,250/month across 15 rentals. This contrasts with the citywide 10.4% rise and shows a notable local cooldown in this neighborhood.
Median rent
Median rent in Alpharetta
$2,650/mo
vs previous year
The average rent in Alpharetta is $2,650 per month as of July 2026. This is 37% above the national average rent, or $720 more per month.
average price per square foot
Total rentals
Available rentals in Alpharetta
164
for rent on Zumper.com as of July 2026
Rent price distribution
Share of Alpharetta rentals at each price point
Rent trends in Alpharetta, GA
Average rent prices in Alpharetta have increased by 2% over the last month and have increased by 10% since last year.
Rent trends
Rent prices on this page are calculated on a rolling 30-day basis and updated daily.
Compare rent prices in
Alpharetta, GA
Rent prices in Alpharetta vary by bedroom size, rental type, and neighborhood. The average rent for an apartment in Alpharetta is $2,122, whereas a house costs $3,000. 1-bedroom apartments in Alpharetta run $1,629 on average, while 2-bedroom apartments are $2,181.
Listings | ||||
|---|---|---|---|---|
Studio | $2,650 | No Change |  25% | |
1 bedroom | $1,629 |  1% | 1% | |
2 bedroom | $2,100 | No Change | No Change | |
3 bedroom | $2,704 | 2% | 12% | |
4 bedroom | $3,550 | 2% | 9% |
Listings | ||
|---|---|---|
Crabapple | $3,250 | |
Glen Abbey | $2,627 | |
Hampton Hall | $2,300 | |
Nortpoint Commons | $2,277 | |
Royal | $2,950 |
Listings | ||||
|---|---|---|---|---|
Apartments | $2,122 | No Change | No Change | |
Condos | $2,010 | 3% | No Change | |
Houses | $3,000 | 2% | No Change |
Studio
Average rent
$2,650
Last year
25%
1 bedroom
Average rent
$1,629
Last 30 days
1%
Last year
1%
2 bedroom
Average rent
$2,100
Last 30 days
No Change
Last year
No Change
3 bedroom
Average rent
$2,704
Last 30 days
2%
Last year
12%
4 bedroom
Average rent
$3,550
Last 30 days
2%
Last year
9%
Nortpoint Commons
Average rent
$2,277
Crabapple
Average rent
$3,250
Hampton Hall
Average rent
$2,300
Royal
Average rent
$2,950
Glen Abbey
Average rent
$2,627
Apartments
Average rent
$2,122
Last 30 days
No Change
Condos
Average rent
$2,010
Last 30 days
3%
Houses
Average rent
$3,000
Last 30 days
2%
The table above reflects average rent prices in Alpharetta, GA, broken down by the number of bedrooms, neighborhoods, and property types. The availability of data for each category is dependent on market inventory and will adjust depending on your selected filters.
How does rent in Alpharetta, GA compare to other cities?
Compare median rent prices in Alpharetta and Buford by all bedroom counts and property types.
Alpharetta
higher than the national median
higher than the national median
Takeaway
The median rent for all rentals in Alpharetta, GA is 10% higher than the median rent in Buford, GA.
Average rent in nearby cities
Explore rent trends in neighboring markets
$2,400
$2,565
$1,970
$2,150
$2,195
$2,250
$2,000
$2,600
$1,842
$2,200
$2,095
$2,390
Discover rentals in Alpharetta, GA

2h ago
1001 Champions Green Pkwy, Alpharetta, GA 30022
1–3 beds
1–2 baths
$1,212–$2,741
Apartment for rent

5d+ ago
Condo for rent in Alpharetta
106 Sterling Ct, Alpharetta, GA 30004
2 beds
2 baths
$1,720
Condo for rent
Available Apr 8

5d+ ago
House for rent in Alpharetta
310 Big Creek Way #A, Alpharetta, GA 30004
2 beds
1 bath
$1,800
House for rent

4d ago
House for rent in Alpharetta
3151 Serenade Ct, Alpharetta, GA 30004
3 beds
2 baths
$1,860
House for rent


5d+ ago
Townhouse for rent in Alpharetta
4 beds
4 baths
$9,800
House for rent

5d+ ago
Townhouse for rent in Alpharetta
357 S Esplanade, Alpharetta, GA 30009
4 beds
3.5 baths
$9,800
House for rent

5d+ ago
House for rent in Alpharetta
5590 Cannonero Dr, Alpharetta, GA 30005
4 beds
2.5 baths
$8,025
House for rent

5d+ ago
House for rent in Alpharetta
11037 Estates Cir, Alpharetta, GA 30022
5 beds
5.5 baths
$8,000
House for rent


16h ago
Verified
101 Porter Ln, Alpharetta, GA 30022
2–4 beds
2–3 baths
$3,220–$4,281
Apartment for rent
Available Jul 28

13h ago
Verified
13125 Morris Rd, Alpharetta, GA 30004
1–3 beds
1–2 baths
$1,520–$2,743
Apartment for rent

13h ago
Verified
15000 Parkview Ln, Alpharetta, GA 30005
1–3 beds
1–2 baths
$1,458–$3,439
Apartment for rent

16h ago
Verified
3080 Market Pl, Alpharetta, GA 30005
1–3 beds
1–2 baths
$1,459–$3,906
Apartment for rent


13h ago
Verified
13125 Morris Rd, Alpharetta, GA 30004
1–3 beds
1–2 baths
$1,520–$2,743
Apartment for rent
13h ago
Verified
15000 Parkview Ln, Alpharetta, GA 30005
1–3 beds
1–2 baths
$1,458–$3,439
Apartment for rent
16h ago
Verified
3080 Market Pl, Alpharetta, GA 30005
1–3 beds
1–2 baths
$1,459–$3,906
Apartment for rent
16h ago
Verified
13201 Deerfield Pkwy, Alpharetta, GA 30004
1–2 beds
1–2 baths
$1,479–$2,456
Apartment for rent


16h ago
Verified
101 Porter Ln, Alpharetta, GA 30022
2–4 beds
2–3 baths
$3,220–$4,281
Apartment for rent
Available Jul 28
13h ago
Verified
13125 Morris Rd, Alpharetta, GA 30004
1–3 beds
1–2 baths
$1,520–$2,743
Apartment for rent
16h ago
Verified
26000 Mill Creek Ave, Alpharetta, GA 30022
1–2 beds
1–2 baths
$1,515–$3,041
Apartment for rent
16h ago
Verified
13201 Deerfield Pkwy, Alpharetta, GA 30004
1–2 beds
1–2 baths
$1,479–$2,456
Apartment for rent


Stay up to date with rental market insights

Are you interested in licensing our current and historical rental real estate data, or do you have custom data requests? Contact datalicensing@zumper.com.
Frequently asked questions for Alpharetta, GA
Quick answers to common questions about the Alpharetta rental market.
How much is rent in Alpharetta?
The average rent in Alpharetta is $2,650 per month as of July 25, 2026.
Is rent up or down in Alpharetta?
Average rent prices in Alpharetta have increased by 2% over the last month and have increased by 10% since last year.
How does Alpharetta rent compare to the national average?
Rent in Alpharetta is 37% above the national average, which means renters are paying approximately $720 more per month.
Which neighborhoods are most affordable in Alpharetta?
The most affordable neighborhoods in Alpharetta are Nortpoint Commons ($2,277/mo), Hampton Hall ($2,300/mo), and Glen Abbey ($2,627/mo).
What salary do I need to afford rent in Alpharetta?
To comfortably afford rent in Alpharetta, you'd need to earn approximately $106,000/year, based on spending no more than 30% of your income on rent.
When is the best time of year to rent in Alpharetta?
Based on Zumper's July 2026 data, one-bedroom apartments in Alpharetta average around $1,680/month and two-bedrooms approximately $2,130/month.
Methodology
Rent prices are based on Zumper's rental listings from the past 30 days. Median rent is calculated across all available listings and property types on the platform. If you filter the page by bedroom count or property type, the pricing throughout the page will update automatically to reflect that segment of the rental market.
Household and population data come from the U.S. Census Bureau. Cost-of-living data is sourced from the Council for Community and Economic Research's Cost of Living Index (COLI).