
Bedroom count
Property type
Last updated on June 25, 2026
Average rent in
New Orleans, LA
Average rent in
Last updated on June 25, 2026
Bedroom count
Property type
Key takeaways for renters
The bottom line
New Orleans, LA rent slipped 8.3% year over year, with a current median of $1,650/month. Renters today are paying $167 less per month on average than last year, although the month-over-month rent increased 3.0% in June 2026.
Compared to national trends
New Orleans sits 15.4% more affordable than the $1,950/month national median, with 1,122 total rentals offering a moderate supply for renters in this market.
Price ranges
Studios in New Orleans run around $1,125/month, 1-bedrooms around $1,432/month, and 2-bedrooms around $1,650/month. Larger units reach $3,600/month for 4+ bedrooms, while houses have a median rent of $2,000/month compared to $1,600/month for apartments.
Neighborhood spotlight
English Turn rents fell 57.8% year over year to $1,350/month across 11 rentals, marking a local cooldown compared to the citywide 8.3% decline. Mcdonough saw rents rise 84.0% year over year to $2,300/month, contrasting with the broader market trend.
Median rent
Median rent in New Orleans
$1,650/mo
vs previous year
The average rent in New Orleans is $1,650 per month as of June 2026. This is 15% below the national average rent, or $300 less per month.
average price per square foot
Total rentals
Available rentals in New Orleans
1,122
for rent on Zumper.com as of June 2026
Rent price distribution
Share of New Orleans rentals at each price point
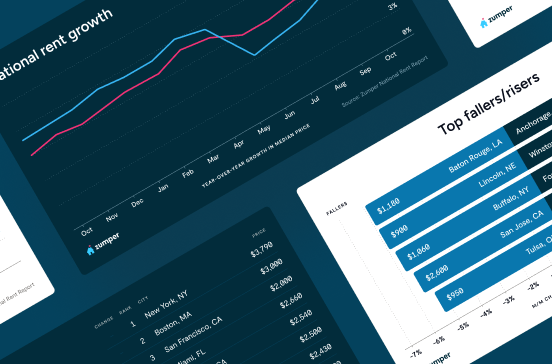
Rent trends in New Orleans, LA
Average rent prices in New Orleans have increased by 3% over the last month and have decreased by 8% since last year.
Rent trends
Rent prices on this page are calculated on a rolling 30-day basis and updated daily.
Compare rent prices in
New Orleans, LA
Rent prices in New Orleans vary by bedroom size, rental type, and neighborhood. The average rent for an apartment in New Orleans is $1,600, whereas a house costs $2,000. 1-bedroom apartments in New Orleans run $1,445 on average, while 2-bedroom apartments are $1,600.
Listings | ||||
|---|---|---|---|---|
Studio | $1,125 |  3% | 34% | |
1 bedroom | $1,432 | 2% |  4% | |
2 bedroom | $1,650 | 2% | 4% | |
3 bedroom | $2,100 | 2% | 2% | |
4 bedroom | $3,600 | 1% | 20% |
Listings | ||
|---|---|---|
Audubon | $2,899 | |
Broadmoor | $1,650 | |
Central Business District | $1,700 | |
Central City | $1,450 | |
East Carrollton | $2,000 | |
French Quarter | $2,000 | |
Little Woods | $1,300 | |
Lower Garden District | $2,250 | |
Mid City | $1,657 | |
Seventh Ward | $1,400 |
Listings | ||||
|---|---|---|---|---|
Apartments | $1,600 | 1% | No Change | |
Condos | $2,000 | No Change | No Change | |
Houses | $2,000 | 4% | No Change | |
Rooms | $844 | 2% | No Change |
Studio
Average rent
$1,125
Last 30 days
3%
Last year
34%
1 bedroom
Average rent
$1,432
Last 30 days
2%
Last year
4%
2 bedroom
Average rent
$1,650
Last 30 days
2%
Last year
4%
3 bedroom
Average rent
$2,100
Last 30 days
2%
Last year
2%
4 bedroom
Average rent
$3,600
Last 30 days
1%
Last year
20%
Central Business District
Average rent
$1,700
Mid City
Average rent
$1,657
Lower Garden District
Average rent
$2,250
Central City
Average rent
$1,450
Audubon
Average rent
$2,899
French Quarter
Average rent
$2,000
East Carrollton
Average rent
$2,000
Little Woods
Average rent
$1,300
Seventh Ward
Average rent
$1,400
Broadmoor
Average rent
$1,650
Apartments
Average rent
$1,600
Last 30 days
1%
Condos
Average rent
$2,000
Last 30 days
No Change
Houses
Average rent
$2,000
Last 30 days
4%
Rooms
Average rent
$844
Last 30 days
2%
The table above reflects average rent prices in New Orleans, LA, broken down by the number of bedrooms, neighborhoods, and property types. The availability of data for each category is dependent on market inventory and will adjust depending on your selected filters.
How does rent in New Orleans, LA compare to other cities?
Compare median rent prices in New Orleans and Belle Chasse by all bedroom counts and property types.
New Orleans
lower than the national median
lower than the national median
Takeaway
The median rent for all rentals in New Orleans, LA is 10% higher than the median rent in Belle Chasse, LA.
Average rent in nearby cities
Explore rent trends in neighboring markets
$1,500
$1,500
$1,450
$1,400
$1,380
$1,500
$1,437
$1,450
$1,800
$1,430
$1,425
$1,477
Cost of living in New Orleans, LA
Explore the cost of essential expenses, and then use our rent calculator to find out how much rent you can afford.
Expenses accrued by most renters | Average cost compared to national average |
|---|---|
| Goods & Services | 3% higher |
| Groceries | 1% lower |
| Health | 2% higher |
| Housing | 52% higher |
| Transportation | 4% lower |
| Utilities | 27% lower |
Discover rentals in New Orleans, LA

5d+ ago
Dillard house for rent in New Orleans
3024 Gentilly Blvd #4, New Orleans, LA 70122
Studio
0 baths
$250
House for rent

5d+ ago
Dillard house for rent in New Orleans
3024 Gentilly Blvd #6, New Orleans, LA 70122
Studio
0 baths
$250
House for rent

5d+ ago
Dillard house for rent in New Orleans
3024 Gentilly Blvd #5, New Orleans, LA 70122
Studio
0 baths
$250
House for rent

5d+ ago
Dillard house for rent in New Orleans
3024 Gentilly Blvd #1, New Orleans, LA 70122
Studio
0 baths
$250
House for rent


5d+ ago
Audubon house for rent in New Orleans
249 Walnut St, New Orleans, LA 70118
4 beds
4 baths
$22,000
House for rent

5d+ ago
Lower Garden District house for rent in New Orleans
1435 Euterpe St, New Orleans, LA 70130
4 beds
3.5 baths
$16,000
House for rent

1d ago
Verified
4 beds
2 baths
$17,263
$15,871
Price drop
Apartment for rent

5d+ ago
Central Business District condo for rent in New Orleans
801 Saint Joseph St #PH1, New Orleans, LA 70113
2 beds
2.5 baths
$14,000
Condo for rent


1d ago
818 Dauphine St, New Orleans, LA 70116
1 bed
1 bath
$2,135
Apartment for rent

2d ago
Central City apartment for rent in New Orleans
1 bed
1 bath
$1,750
Apartment for rent


21h ago
Verified
925 Common St, New Orleans, LA 70112
Studio–3 beds
1–3 baths
$1,259–$4,290
Apartment for rent
21h ago
Verified
822 Perdido St, New Orleans, LA 70112
1–4 beds
1–4 baths
$1,840–$4,373
Apartment for rent

5d+ ago
Verified
Studio
1 bath
$1,379
Apartment for rent

23h ago
Verified
200 Carondelet St, New Orleans, LA 70130
Studio–1 bed
1 bath
$246–$1,450
Apartment for rent

5d+ ago
Verified
1535 Canal St, New Orleans, LA 70112
1 bed
1 bath
$1,972–$2,111
Apartment for rent
21h ago
Verified
925 Common St, New Orleans, LA 70112
3 beds
3 baths
$4,290
Apartment for rent

21h ago
Verified
4 beds
2 baths
$5,494
$4,503
Price drop
Apartment for rent

21h ago
Verified
2 beds
2 baths
$6,188
$6,012
Price drop
Apartment for rent


Stay up to date with rental market insights

Are you interested in licensing our current and historical rental real estate data, or do you have custom data requests? Contact datalicensing@zumper.com.
Frequently asked questions for New Orleans, LA
Quick answers to common questions about the New Orleans rental market.
How much is rent in New Orleans?
The average rent in New Orleans is $1,650 per month as of June 20, 2026.
Is rent up or down in New Orleans?
Average rent prices in New Orleans have increased by 3% over the last month and have decreased by 8% since last year.
How does New Orleans rent compare to the national average?
Rent in New Orleans is 15% below the national average, which means renters are paying approximately $300 less per month.
Which neighborhoods are most affordable in New Orleans?
The most affordable neighborhoods in New Orleans are Little Woods ($1,300/mo), Seventh Ward ($1,400/mo), and Central City ($1,450/mo).
What salary do I need to afford rent in New Orleans?
To comfortably afford rent in New Orleans, you'd need to earn approximately $66,000/year, based on spending no more than 30% of your income on rent.
When is the best time of year to rent in New Orleans?
New Orleans one-bedroom apartments averaged around $1,500 per month in 2025, while two-bedroom units averaged around $1,800 per month. These figures reflect the current rental market across Louisiana's most distinctive city.
Methodology
Rent prices are based on Zumper's rental listings from the past 30 days. Median rent is calculated across all available listings and property types on the platform. If you filter the page by bedroom count or property type, the pricing throughout the page will update automatically to reflect that segment of the rental market.
Household and population data come from the U.S. Census Bureau. Cost-of-living data is sourced from the Council for Community and Economic Research's Cost of Living Index (COLI).