
Bedroom count
Property type
Last updated on July 1, 2026
Average rent in
Waterbury, CT
Average rent in
Last updated on July 1, 2026
Bedroom count
Property type
Key takeaways for renters
The bottom line
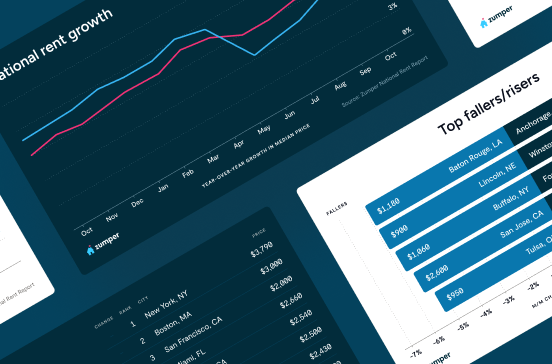
Waterbury, CT rent slipped 3.1% year over year to a current median of $1,550/month. The $7 monthly decrease is negligible, while rent ticked up 1.6% month to month following a peak of $1,650/month in August 2025.
Compared to national trends
Waterbury's median rent is 20.5% more affordable than the $1,950/month national median. The city has 137 total rentals and an average rent per square foot of $1.29.
Rent ranges by bedroom
Studios and 1-bedrooms in Waterbury rent for about $1,250 to $1,275/month, while 2-bedrooms sit at $1,550/month. Larger units cost more, with 3-bedrooms at $1,750 and 4+ bedrooms at $2,050/month.
Median rent
Median rent in Waterbury
$1,550/mo
vs previous year
The average rent in Waterbury is $1,550 per month as of June 2026. This is 21% below the national average rent, or $400 less per month.
average price per square foot
Total rentals
Available rentals in Waterbury
137
for rent on Zumper.com as of June 2026
Rent price distribution
Share of Waterbury rentals at each price point
Rent trends in Waterbury, CT
Average rent prices in Waterbury have increased by 2% over the last month and have decreased by 3% since last year.
Rent trends
Rent prices on this page are calculated on a rolling 30-day basis and updated daily.
Compare rent prices in
Waterbury, CT
Rent prices in Waterbury vary by bedroom size, rental type, and neighborhood. The average rent for an apartment in Waterbury is $1,500, whereas a house costs $2,250. 1-bedroom apartments in Waterbury run $1,250 on average, while 2-bedroom apartments are $1,500.
Listings | ||||
|---|---|---|---|---|
Studio | $1,275 |  18% | 26% | |
1 bedroom | $1,250 | No Change |  1% | |
2 bedroom | $1,550 | 2% | 2% | |
3 bedroom | $1,750 | No Change | 2% | |
4 bedroom | $2,050 | 3% | 13% |
At this time, we don't have enough active inventory for all rentals to generate data. Please check back soon to see neighborhood rent prices in Waterbury, CT.
Listings | ||||
|---|---|---|---|---|
Apartments | $1,500 | 2% | No Change | |
Condos | $1,600 | 6% | No Change | |
Houses | $2,250 | 1% | No Change |
Studio
Average rent
$1,275
Last 30 days
18%
Last year
26%
1 bedroom
Average rent
$1,250
Last 30 days
No Change
Last year
1%
2 bedroom
Average rent
$1,550
Last 30 days
2%
Last year
2%
3 bedroom
Average rent
$1,750
Last 30 days
No Change
Last year
2%
4 bedroom
Average rent
$2,050
Last 30 days
3%
Last year
13%
At this time, we don't have enough active inventory for all rentals to generate data. Please check back soon to see neighborhood rent prices in Waterbury, CT.
Apartments
Average rent
$1,500
Last 30 days
2%
Condos
Average rent
$1,600
Last 30 days
6%
Houses
Average rent
$2,250
Last 30 days
1%
The table above reflects average rent prices in Waterbury, CT, broken down by the number of bedrooms, neighborhoods, and property types. The availability of data for each category is dependent on market inventory and will adjust depending on your selected filters.
How does rent in Waterbury, CT compare to other cities?
Compare median rent prices in Waterbury and Branford by all bedroom counts and property types.
Waterbury
lower than the national median
higher than the national median
Takeaway
The median rent for all rentals in Waterbury, CT is 38% lower than the median rent in Branford, CT.
Average rent in nearby cities
Explore rent trends in neighboring markets
$2,500
$1,750
$2,225
$2,415
$2,215
$1,600
$1,610
$2,100
$2,689
$1,500
$2,485
$1,995
Discover rentals in Waterbury, CT

23h ago
337 Congress Ave Apt 3b, Waterbury, CT 06708
2 beds
1 bath
$950
The price shown reflects a 12-month lease and includes base rent plus all required monthly fees provided by the property.Apartment for rent

4d ago
Apartment for rent in Waterbury
121 Lounsbury St #3E, Waterbury, CT 06706
2 beds
1 bath
$1,150
The price shown reflects a 12-month lease. Fees may apply.Apartment for rent

5d+ ago
Apartment for rent in Waterbury
132 Locust St #6, Waterbury, CT 06704
2 beds
1 bath
$1,150
The price shown reflects a 12-month lease. Fees may apply.Apartment for rent

2d ago
125 Hillside Ave, Waterbury, CT 06710
2 beds
1 bath
$1,200
Price drop
The price shown reflects a 12-month lease. Fees may apply.Apartment for rent


5d+ ago
Apartment for rent in Waterbury
13 Woodcrest Dr #1, Waterbury, CT 06708
4 beds
3 baths
$3,500
The price shown reflects a 12-month lease. Fees may apply.Apartment for rent
Available Jun 11

2d ago
House for rent in Waterbury
163 Alder St, Waterbury, CT 06708
3 beds
1.5 baths
$3,000
The price shown reflects a 12-month lease. Fees may apply.House for rent

5d+ ago
House for rent in Waterbury
181 Hubbell Ave, Waterbury, CT 06708
3 beds
2 baths
$2,800
The price shown reflects a 12-month lease. Fees may apply.House for rent
Available Aug 1

5d+ ago
House for rent in Waterbury
151 Martone St, Waterbury, CT 06708
3 beds
2 baths
$2,600
The price shown reflects a 12-month lease. Fees may apply.House for rent


3h ago
222 Bradley Ave, Waterbury, CT 06708
1 bed
1 bath
$1,500–$1,625
The price shown reflects a 12-month lease. Fees may apply.Apartment for rent

3h ago
96 Hill St, Waterbury, CT 06704
2 beds
1 bath
$1,350
The price shown reflects a 12-month lease and includes base rent plus all required monthly fees provided by the property.Apartment for rent

15h ago
41 Putnam St, Waterbury, CT 06704
2 beds
1 bath
$1,750
The price shown reflects a 12-month lease and includes base rent plus all required monthly fees provided by the property.Apartment for rent

1d ago
200 Hill St, Waterbury, CT 06704
2 beds
1 bath
$1,550
The price shown reflects a 12-month lease and includes base rent plus all required monthly fees provided by the property.Apartment for rent


1d ago
136 Jersey St, Waterbury, CT 06706
2 beds
1 bath
$1,550–$1,700
The price shown reflects a 12-month lease. Fees may apply.Apartment for rent

5d+ ago
Apartment for rent in Waterbury
3 beds
1 bath
$1,700
The price shown reflects a 12-month lease. Fees may apply.Apartment for rent

2h ago
105 Bank St, Waterbury, CT 06702
Studio–2 beds
0–1 bath
$1,000–$1,250
The price shown reflects a 12-month lease. Fees may apply.Apartment for rent
19h ago
227 Hillside Ave, Waterbury, CT 06710
2 beds
1 bath
$1,250
The price shown reflects a 12-month lease and includes base rent plus all required monthly fees provided by the property.Apartment for rent


2d ago
125 Hillside Ave, Waterbury, CT 06710
2 beds
1 bath
$1,200
Price drop
The price shown reflects a 12-month lease. Fees may apply.Apartment for rent

2d ago
1017 W Main St, Waterbury, CT 06708
3 beds
1 bath
$1,400
The price shown reflects a 12-month lease. Fees may apply.Apartment for rent

4d ago
26 Colley St, Waterbury, CT 06708
1–3 beds
1 bath
$1,100–$1,500
The price shown reflects a 12-month lease and includes base rent plus all required monthly fees provided by the property.Apartment for rent
2h ago
105 Bank St, Waterbury, CT 06702
Studio–2 beds
0–1 bath
$1,000–$1,250
The price shown reflects a 12-month lease. Fees may apply.Apartment for rent

Stay up to date with rental market insights

Are you interested in licensing our current and historical rental real estate data, or do you have custom data requests? Contact datalicensing@zumper.com.
Frequently asked questions for Waterbury, CT
Quick answers to common questions about the Waterbury rental market.
How much is rent in Waterbury?
The average rent in Waterbury is $1,550 per month as of June 27, 2026.
Is rent up or down in Waterbury?
Average rent prices in Waterbury have increased by 2% over the last month and have decreased by 3% since last year.
How does Waterbury rent compare to the national average?
Rent in Waterbury is 21% below the national average, which means renters are paying approximately $400 less per month.
What salary do I need to afford rent in Waterbury?
To comfortably afford rent in Waterbury, you'd need to earn approximately $62,000/year, based on spending no more than 30% of your income on rent.
When is the best time of year to rent in Waterbury?
One-bedroom apartments in Waterbury averaged around $1,200 per month in 2025, while two-bedroom units averaged around $1,600 per month. These figures represent the current market rates across different property types in the city.
Methodology
Rent prices are based on Zumper's rental listings from the past 30 days. Median rent is calculated across all available listings and property types on the platform. If you filter the page by bedroom count or property type, the pricing throughout the page will update automatically to reflect that segment of the rental market.
Household and population data come from the U.S. Census Bureau. Cost-of-living data is sourced from the Council for Community and Economic Research's Cost of Living Index (COLI).