
Bedroom count
Property type
Last updated on July 2, 2026
Average rent in
Branford, CT
Average rent in
Last updated on July 2, 2026
Bedroom count
Property type
Median rent
Median rent in Branford
$2,500/mo
vs previous year
The average rent in Branford is $2,500 per month as of June 2026. This is 28% above the national average rent, or $550 more per month.
average price per square foot
Total rentals
Available rentals in Branford
18
for rent on Zumper.com as of June 2026
Rent price distribution
Share of Branford rentals at each price point
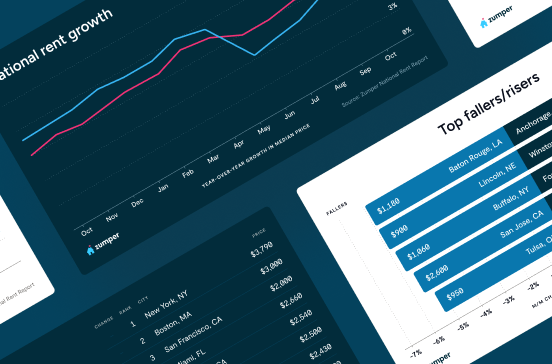
Rent trends in Branford, CT
Average rent prices in Branford have increased by 6% over the last month and have decreased by 6% since last year.
Rent trends
Rent prices on this page are calculated on a rolling 30-day basis and updated daily.
Compare rent prices in
Branford, CT
Rent prices in Branford vary by bedroom size, rental type, and neighborhood. The average rent for an apartment in Branford is $2,222, whereas a house costs $3,100. 1-bedroom apartments in Branford run $1,700 on average, while 2-bedroom apartments are $2,350.
Listings | ||||
|---|---|---|---|---|
Studio | $1,550 | No Change | - | |
1 bedroom | $1,870 |  9% | 4% | |
2 bedroom | $2,195 | 1% | 12% | |
3 bedroom | $2,200 | 2% | 26% | |
4 bedroom | $2,950 | 32% | 15% |
At this time, we don't have enough active inventory for all rentals to generate data. Please check back soon to see neighborhood rent prices in Branford, CT.
Listings | ||||
|---|---|---|---|---|
Apartments | $2,222 | 7% |  6% | |
Condos | $2,275 | 5% | No Change | |
Houses | $3,100 | 16% | No Change | |
Rooms | $1,150 | - | - |
Studio
Average rent
$1,550
1 bedroom
Average rent
$1,870
Last 30 days
9%
Last year
4%
2 bedroom
Average rent
$2,195
Last 30 days
1%
Last year
12%
3 bedroom
Average rent
$2,200
Last 30 days
2%
Last year
26%
4 bedroom
Average rent
$2,950
Last 30 days
32%
Last year
15%
At this time, we don't have enough active inventory for all rentals to generate data. Please check back soon to see neighborhood rent prices in Branford, CT.
Apartments
Average rent
$2,222
Last 30 days
7%
Last year
6%
Condos
Average rent
$2,275
Last 30 days
5%
Houses
Average rent
$3,100
Last 30 days
16%
Rooms
Average rent
$1,150
The table above reflects average rent prices in Branford, CT, broken down by the number of bedrooms, neighborhoods, and property types. The availability of data for each category is dependent on market inventory and will adjust depending on your selected filters.
How does rent in Branford, CT compare to other cities?
Compare median rent prices in Branford and Ansonia by all bedroom counts and property types.
Branford
higher than the national median
lower than the national median
Takeaway
The median rent for all rentals in Branford, CT is 39% higher than the median rent in Ansonia, CT.
Average rent in nearby cities
Explore rent trends in neighboring markets
$1,800
$2,015
$2,225
$2,415
$1,763
$2,737
$2,100
$2,689
$2,212
$2,200
$1,550
$1,995
Discover rentals in Branford, CT

5d+ ago
House for rent in Branford
13 Parker Memorial Dr, Branford, CT 06405
3 beds
1.5 baths
$1,650
The price shown reflects a 12-month lease. Fees may apply.House for rent

4d ago
Apartment for rent in Branford
37 39 Hillside Ave #E, Branford, CT 06405
2 beds
1 bath
$1,800
The price shown reflects a 12-month lease and includes base rent plus all required monthly fees provided by the property.Apartment for rent
Available Jul 1

5d+ ago
Condo for rent in Branford
90 Laurel Hill Rd #1, Branford, CT 06405
3 beds
1 bath
$2,950
The price shown reflects a 12-month lease. Fees may apply.Condo for rent
Available Aug 14

5d+ ago
Condo for rent in Branford
6 Peddlars Dr #6, Branford, CT 06405
3 beds
2.5 baths
$3,000
The price shown reflects a 12-month lease. Fees may apply.Condo for rent

5d+ ago
House for rent in Branford
27 Prospect Hill Rd, Branford, CT 06405
4 beds
4.5 baths
$5,500
The price shown reflects a 12-month lease. Fees may apply.House for rent

1d ago
Condo for rent in Branford
55 Peddlars Dr #55, Branford, CT 06405
2 beds
1.5 baths
$3,100
The price shown reflects a 12-month lease. Fees may apply.Condo for rent

5d+ ago
House for rent in Branford
245 Alps Rd, Branford, CT 06405
2 beds
1 bath
$3,000
The price shown reflects a 12-month lease. Fees may apply.House for rent

5d+ ago
House for rent in Branford
33 Sybil Ave, Branford, CT 06405
2 beds
1.5 baths
$2,950
The price shown reflects a 12-month lease. Fees may apply.House for rent


5d+ ago
Verified
115 S Montowese St, Branford, CT 06405
1–2 beds
1 bath
Call for price
The price shown reflects a 12-month lease. Fees may apply.Apartment for rent
5d+ ago
Condo for rent in Branford
90 Laurel Hill Rd #1, Branford, CT 06405
3 beds
1 bath
$2,950
The price shown reflects a 12-month lease. Fees may apply.Condo for rent
Available Aug 14
5d+ ago
Verified
115 S Montowese St, Branford, CT 06405
1–2 beds
1 bath
Call for price
The price shown reflects a 12-month lease. Fees may apply.Apartment for rent
5d+ ago
Condo for rent in Branford
90 Laurel Hill Rd #1, Branford, CT 06405
3 beds
1 bath
$2,950
The price shown reflects a 12-month lease. Fees may apply.Condo for rent
Available Aug 14

5d+ ago
Apartment for rent in Branford
38 Oak Ridge Rd #NA, Branford, CT 06405
1 bed
1 bath
$1,675
The price shown reflects a 12-month lease and includes base rent plus all required monthly fees provided by the property.Apartment for rent
Available Aug 1
5d+ ago
Apartment for rent in Branford
84 E Main St, Branford, CT 06405
1 bed
1 bath
$1,700
The price shown reflects a 12-month lease. Fees may apply.Apartment for rent


5d+ ago
Verified
115 S Montowese St, Branford, CT 06405
1–2 beds
1 bath
Call for price
The price shown reflects a 12-month lease. Fees may apply.Apartment for rent
2d ago
Apartment for rent in Branford
1022 Main St #7, Branford, CT 06405
1 bed
1 bath
$1,800
The price shown reflects a 12-month lease. Fees may apply.Apartment for rent
4d ago
Apartment for rent in Branford
37 39 Hillside Ave #E, Branford, CT 06405
2 beds
1 bath
$1,800
The price shown reflects a 12-month lease and includes base rent plus all required monthly fees provided by the property.Apartment for rent
Available Jul 1
5d+ ago
Apartment for rent in Branford
38 Oak Ridge Rd #NA, Branford, CT 06405
1 bed
1 bath
$1,675
The price shown reflects a 12-month lease and includes base rent plus all required monthly fees provided by the property.Apartment for rent
Available Aug 1

Stay up to date with rental market insights

Are you interested in licensing our current and historical rental real estate data, or do you have custom data requests? Contact datalicensing@zumper.com.
Frequently asked questions for Branford, CT
Quick answers to common questions about the Branford rental market.
How much is rent in Branford?
The average rent in Branford is $2,500 per month as of June 27, 2026.
Is rent up or down in Branford?
Average rent prices in Branford have increased by 6% over the last month and have decreased by 6% since last year.
How does Branford rent compare to the national average?
Rent in Branford is 28% above the national average, which means renters are paying approximately $550 more per month.
What salary do I need to afford rent in Branford?
To comfortably afford rent in Branford, you'd need to earn approximately $100,000/year, based on spending no more than 30% of your income on rent.
When is the best time of year to rent in Branford?
One-bedroom apartments in Branford averaged around $1,900 per month in 2025, while two-bedroom units averaged around $2,700 monthly. These figures represent current market conditions with one-bedrooms experiencing a decline and two-bedrooms showing growth compared to the previous year.
Methodology
Rent prices are based on Zumper's rental listings from the past 30 days. Median rent is calculated across all available listings and property types on the platform. If you filter the page by bedroom count or property type, the pricing throughout the page will update automatically to reflect that segment of the rental market.
Household and population data come from the U.S. Census Bureau. Cost-of-living data is sourced from the Council for Community and Economic Research's Cost of Living Index (COLI).