
Bedroom count
Property type
Last updated on July 30, 2026
Average rent in
Wallingford, CT
Average rent in
Last updated on July 30, 2026
Bedroom count
Property type
Median rent
Median rent in Wallingford
$2,050/mo
vs previous year
The average rent in Wallingford is $2,050 per month as of July 2026. This is 6% above the national average rent, or $120 more per month.
average price per square foot
Total rentals
Available rentals in Wallingford
23
for rent on Zumper.com as of July 2026
Rent price distribution
Share of Wallingford rentals at each price point
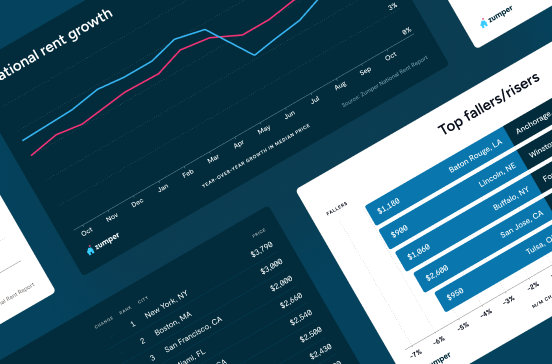
Rent trends in Wallingford, CT
Average rent prices in Wallingford have remained the same over the last month and have increased by 8% since last year.
Rent trends
Rent prices on this page are calculated on a rolling 30-day basis and updated daily.
Compare rent prices in
Wallingford, CT
Rent prices in Wallingford vary by bedroom size, rental type, and neighborhood. The average rent for an apartment in Wallingford is $2,000, whereas a house costs $2,900. 1-bedroom apartments in Wallingford run $1,750 on average, while 2-bedroom apartments are $2,000.
Listings | ||||
|---|---|---|---|---|
Studio | $1,695 |  10% | - | |
1 bedroom | $1,850 | 9% | 29% | |
2 bedroom | $1,850 |  1% | 8% | |
3 bedroom | $2,650 | 6% | 1% | |
4 bedroom | $3,900 | No Change | 90% |
At this time, we don't have enough active inventory for all rentals to generate data. Please check back soon to see neighborhood rent prices in Wallingford, CT.
Listings | ||||
|---|---|---|---|---|
Apartments | $2,000 | 2% | No Change | |
Condos | $1,750 | 1% | 4% | |
Houses | $2,900 | 7% | No Change |
Studio
Average rent
$1,695
Last 30 days
10%
1 bedroom
Average rent
$1,850
Last 30 days
9%
Last year
29%
2 bedroom
Average rent
$1,850
Last 30 days
1%
Last year
8%
3 bedroom
Average rent
$2,650
Last 30 days
6%
Last year
1%
4 bedroom
Average rent
$3,900
Last year
90%
At this time, we don't have enough active inventory for all rentals to generate data. Please check back soon to see neighborhood rent prices in Wallingford, CT.
Apartments
Average rent
$2,000
Last 30 days
2%
Condos
Average rent
$1,750
Last 30 days
1%
Last year
4%
Houses
Average rent
$2,900
Last 30 days
7%
The table above reflects average rent prices in Wallingford, CT, broken down by the number of bedrooms, neighborhoods, and property types. The availability of data for each category is dependent on market inventory and will adjust depending on your selected filters.
How does rent in Wallingford, CT compare to other cities?
Compare median rent prices in Wallingford and Ansonia by all bedroom counts and property types.
Wallingford
higher than the national median
higher than the national median
Takeaway
The median rent for all rentals in Wallingford, CT is 5% higher than the median rent in Ansonia, CT.
Average rent in nearby cities
Explore rent trends in neighboring markets
$1,950
$2,133
$2,450
$1,750
$1,925
$2,710
$1,750
$2,600
$1,900
$1,600
$2,200
$1,862
Discover rentals in Wallingford, CT

5d+ ago
Condo for rent in Wallingford
36 Sigwin Cir #36, Wallingford, CT 06492
2 beds
1 bath
$1,700
The price shown reflects a 12-month lease. Fees may apply.Condo for rent

5d+ ago
Apartment for rent in Wallingford
90 N Turnpike Rd #3, Wallingford, CT 06492
2 beds
1 bath
$1,700
The price shown reflects a 12-month lease. Fees may apply.Apartment for rent

1d ago
24 Parsons St, Wallingford, CT 06492
2 beds
1 bath
$1,750
The price shown reflects a 12-month lease. Fees may apply.Apartment for rent

2d ago
219 S Orchard St, Wallingford, CT 06492
3 beds
2 baths
$2,300
The price shown reflects a 12-month lease. Fees may apply.Apartment for rent


3d ago
Townhouse for rent in Wallingford
124 Colonial Hill Dr #124, Wallingford, CT 06492
2 beds
1.5 baths
$3,175
The price shown reflects a 12-month lease. Fees may apply.House for rent

5d+ ago
Apartment for rent in Wallingford
145 Prince St #1, Wallingford, CT 06492
2 beds
1 bath
$2,750
$2,600
Price drop
The price shown reflects a 12-month lease. Fees may apply.Apartment for rent

5d+ ago
Apartment for rent in Wallingford
1 bed
1 bath
$1,850
The price shown reflects a 12-month lease. Fees may apply.Apartment for rent

5d+ ago
Apartment for rent in Wallingford
95 N Whittlesey Ave #3, Wallingford, CT 06492
1 bed
1 bath
$1,750
The price shown reflects a 12-month lease and includes base rent plus all required monthly fees provided by the property.Apartment for rent
Available Sep 1


1d ago
24 Parsons St, Wallingford, CT 06492
2 beds
1 bath
$1,750
The price shown reflects a 12-month lease. Fees may apply.Apartment for rent
5d+ ago
Apartment for rent in Wallingford
1 bed
1 bath
$1,850
The price shown reflects a 12-month lease. Fees may apply.Apartment for rent
5d+ ago
Apartment for rent in Wallingford
3 beds
1 bath
$2,600
The price shown reflects a 12-month lease. Fees may apply.Apartment for rent
5d+ ago
Apartment for rent in Wallingford
200 Cook Hill Rd, Wallingford, CT 06492
2 beds
1 bath
$2,250
The price shown reflects a 12-month lease. Fees may apply.Apartment for rent
5d+ ago
Apartment for rent in Wallingford
3 beds
2 baths
$2,600
The price shown reflects a 12-month lease. Fees may apply.Apartment for rent
1d ago
24 Parsons St, Wallingford, CT 06492
2 beds
1 bath
$1,750
The price shown reflects a 12-month lease. Fees may apply.Apartment for rent
5d+ ago
Apartment for rent in Wallingford
Studio
1 bath
$1,650
The price shown reflects a 12-month lease. Fees may apply.Apartment for rent
5d+ ago
Condo for rent in Wallingford
36 Sigwin Cir #36, Wallingford, CT 06492
2 beds
1 bath
$1,700
The price shown reflects a 12-month lease. Fees may apply.Condo for rent

1d ago
24 Parsons St, Wallingford, CT 06492
2 beds
1 bath
$1,750
The price shown reflects a 12-month lease. Fees may apply.Apartment for rent
2d ago
219 S Orchard St, Wallingford, CT 06492
3 beds
2 baths
$2,300
The price shown reflects a 12-month lease. Fees may apply.Apartment for rent
5d+ ago
Apartment for rent in Wallingford
145 Prince St #1, Wallingford, CT 06492
2 beds
1 bath
$2,750
$2,600
Price drop
The price shown reflects a 12-month lease. Fees may apply.Apartment for rent
5d+ ago
Condo for rent in Wallingford
36 Sigwin Cir #36, Wallingford, CT 06492
2 beds
1 bath
$1,700
The price shown reflects a 12-month lease. Fees may apply.Condo for rent
Stay up to date with rental market insights

Are you interested in licensing our current and historical rental real estate data, or do you have custom data requests? Contact datalicensing@zumper.com.
Frequently asked questions for Wallingford, CT
Quick answers to common questions about the Wallingford rental market.
How much is rent in Wallingford?
The average rent in Wallingford is $2,050 per month as of July 25, 2026.
Is rent up or down in Wallingford?
Average rent prices in Wallingford have remained the same over the last month and have increased by 8% since last year.
How does Wallingford rent compare to the national average?
Rent in Wallingford is 6% above the national average, which means renters are paying approximately $120 more per month.
What salary do I need to afford rent in Wallingford?
To comfortably afford rent in Wallingford, you'd need to earn approximately $82,000/year, based on spending no more than 30% of your income on rent.
When is the best time of year to rent in Wallingford?
Based on our current listings, pet-friendly apartments are available in Wallingford, appearing in 21% of rental properties. With an average of 28 listings available monthly, this works out to about 6 pet-welcoming apartments each month.
Methodology
Rent prices are based on Zumper's rental listings from the past 30 days. Median rent is calculated across all available listings and property types on the platform. If you filter the page by bedroom count or property type, the pricing throughout the page will update automatically to reflect that segment of the rental market.
Household and population data come from the U.S. Census Bureau. Cost-of-living data is sourced from the Council for Community and Economic Research's Cost of Living Index (COLI).