
Bedroom count
Property type
Last updated on June 25, 2026
Average rent in
Tigard Neighborhood Area 6, Tigard, OR
Average rent in
Last updated on June 25, 2026
Bedroom count
Property type
Median rent
Median rent in Tigard Neighborhood Area 6
$1,695/mo
vs previous year
The average rent in Tigard Neighborhood Area 6 is $1,695 per month as of June 2026. This is 13% below the national average rent, or $255 less per month.
average price per square foot
Total rentals
Available rentals in Tigard Neighborhood Area 6
18
for rent on Zumper.com as of June 2026
Rent price distribution
Share of Tigard Neighborhood Area 6 rentals at each price point
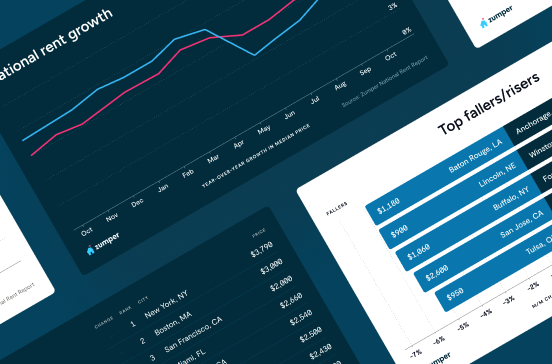
Rent trends in Tigard Neighborhood Area 6, Tigard, OR
Average rent prices in Tigard Neighborhood Area 6 have decreased by 1% over the last month and have increased by 21% since last year.
Rent trends
Rent prices on this page are calculated on a rolling 30-day basis and updated daily.
Compare rent prices in
Tigard Neighborhood Area 6, Tigard, OR
Rent prices in Tigard Neighborhood Area 6 vary by bedroom size, rental type, and neighborhood. The average rent for an apartment in Tigard Neighborhood Area 6 is $1,450, whereas a house costs $3,645. 1-bedroom apartments in Tigard Neighborhood Area 6 run $1,245 on average, while 2-bedroom apartments are $1,345.
Listings | ||||
|---|---|---|---|---|
Studio | $1,399 | No Change | - | |
1 bedroom | $1,347 |  1% |  2% | |
2 bedroom | $1,575 | No Change | 14% | |
3 bedroom | $2,399 | 10% | 44% | |
4 bedroom | $3,695 | 2% | - |
Listings | ||
|---|---|---|
Greenway | $1,550 | |
Tigard Neighborhood Area 3 | $1,599 | |
Tigard Neighborhood Area 4 | $1,495 | |
Tigard Neighborhood Area 5 | $1,700 | |
Tigard Neighborhood Area 7 | $1,654 | |
Tigard Neighborhood Area 8 | $1,575 |
Listings | ||||
|---|---|---|---|---|
Apartments | $1,450 | 2% | No Change | |
Condos | $2,087 | - | - | |
Houses | $3,645 | No Change | No Change |
Studio
Average rent
$1,399
1 bedroom
Average rent
$1,347
Last 30 days
1%
Last year
2%
2 bedroom
Average rent
$1,575
Last 30 days
No Change
Last year
14%
3 bedroom
Average rent
$2,399
Last 30 days
10%
Last year
44%
4 bedroom
Average rent
$3,695
Last 30 days
2%
Greenway
Average rent
$1,550
Tigard Neighborhood Area 4
Average rent
$1,495
Tigard Neighborhood Area 3
Average rent
$1,599
Tigard Neighborhood Area 5
Average rent
$1,700
Tigard Neighborhood Area 7
Average rent
$1,654
Tigard Neighborhood Area 8
Average rent
$1,575
Apartments
Average rent
$1,450
Last 30 days
2%
Condos
Average rent
$2,087
Houses
Average rent
$3,645
Last 30 days
No Change
The table above reflects average rent prices in Tigard Neighborhood Area 6, Tigard, OR, broken down by the number of bedrooms, neighborhoods, and property types. The availability of data for each category is dependent on market inventory and will adjust depending on your selected filters.
How does rent in Tigard Neighborhood Area 6, Tigard, OR compare to other neighborhoods?
Compare median rent prices in Tigard Neighborhood Area 6 and Greenway by all bedroom counts and property types.
Tigard Neighborhood Area 6
lower than the national median
lower than the national median
Takeaway
The median rent for all rentals in Tigard Neighborhood Area 6, Tigard, OR is 9% higher than the median rent in Greenway, Beaverton, OR.
Average rent in nearby neighborhoods
Explore rent trends in neighboring markets
Discover rentals in Tigard Neighborhood Area 6, Tigard, OR

1d ago
Verified
12625 Sw Hall Blvd, Tigard, OR 97223
1–3 beds
1 bath
$1,249–$1,449
Apartment for rent

1d ago
Verified
9800 Sw Frewing St, Tigard, OR 97223
2 beds
1 bath
$1,289–$1,600
Apartment for rent

3d ago
Tigard Neighborhood Area 6 townhouse for rent in Tigard
2 beds
1.5 baths
$1,450
House for rent
Available Jun 23

5d+ ago
Tigard Neighborhood Area 6 house for rent in Tigard
9515 Sw Edgewood St, Tigard, OR 97223
3 beds
1.5 baths
$4,750
House for rent
Available Jul 20

5d+ ago
Tigard Neighborhood Area 6 house for rent in Tigard
9515 Sw Edgewood St, Tigard, OR 97223
2 beds
1 bath
$3,500
House for rent
Available Jun 23

2d ago
12547 Sw Main St, Tigard, OR 97223
Studio
1 bath
$1,550
Apartment for rent

1d ago
Tigard Neighborhood Area 6 apartment for rent in Tigard
1 bed
1 bath
$1,395
Apartment for rent
Available Jun 23


1d ago
Verified
12625 Sw Hall Blvd, Tigard, OR 97223
1–3 beds
1 bath
$1,249–$1,449
Apartment for rent
1d ago
Verified
9800 Sw Frewing St, Tigard, OR 97223
2 beds
1 bath
$1,289–$1,600
Apartment for rent
1d ago
Tigard Neighborhood Area 6 apartment for rent in Tigard
1 bed
1 bath
$1,395
Apartment for rent
Available Jun 23
2d ago
12547 Sw Main St, Tigard, OR 97223
Studio
1 bath
$1,550
Apartment for rent
1d ago
Verified
9800 Sw Frewing St, Tigard, OR 97223
2 beds
1 bath
$1,289–$1,600
Apartment for rent
1d ago
Verified
12625 Sw Hall Blvd, Tigard, OR 97223
1–3 beds
1 bath
$1,249–$1,449
Apartment for rent
2d ago
12547 Sw Main St, Tigard, OR 97223
Studio
1 bath
$1,550
Apartment for rent

2d ago
13070 Sw Ash Ave, Tigard, OR 97223
2 beds
1 bath
$1,550
Apartment for rent
1d ago
Verified
12625 Sw Hall Blvd, Tigard, OR 97223
1–3 beds
1 bath
$1,249–$1,449
Apartment for rent
1d ago
Verified
9800 Sw Frewing St, Tigard, OR 97223
2 beds
1 bath
$1,289–$1,600
Apartment for rent
3d ago
Tigard Neighborhood Area 6 townhouse for rent in Tigard
2 beds
1.5 baths
$1,450
House for rent
Available Jun 23
3d ago
9915 Sw Frewing St, Tigard, OR 97223
2 beds
1 bath
$1,345
Apartment for rent
Stay up to date with rental market insights

Are you interested in licensing our current and historical rental real estate data, or do you have custom data requests? Contact datalicensing@zumper.com.
Frequently asked questions for Tigard Neighborhood Area 6, Tigard, OR
Quick answers to common questions about the Tigard Neighborhood Area 6 rental market.
How much is rent in Tigard Neighborhood Area 6?
The average rent in Tigard Neighborhood Area 6 is $1,695 per month as of June 20, 2026.
Is rent up or down in Tigard Neighborhood Area 6?
Average rent prices in Tigard Neighborhood Area 6 have decreased by 1% over the last month and have increased by 21% since last year.
How does Tigard Neighborhood Area 6 rent compare to the national average?
Rent in Tigard Neighborhood Area 6 is 13% below the national average, which means renters are paying approximately $255 less per month.
What salary do I need to afford rent in Tigard Neighborhood Area 6?
To comfortably afford rent in Tigard Neighborhood Area 6, you'd need to earn approximately $68,000/year, based on spending no more than 30% of your income on rent.
Methodology
Rent prices are based on Zumper's rental listings from the past 30 days. Median rent is calculated across all available listings and property types on the platform. If you filter the page by bedroom count or property type, the pricing throughout the page will update automatically to reflect that segment of the rental market.
Household and population data come from the U.S. Census Bureau. Cost-of-living data is sourced from the Council for Community and Economic Research's Cost of Living Index (COLI).