
Bedroom count
Property type
Last updated on July 31, 2026
Average rent in
Oro Valley, AZ
Average rent in
Last updated on July 31, 2026
Bedroom count
Property type
Key takeaways for renters
Where Oro Valley rent stands today
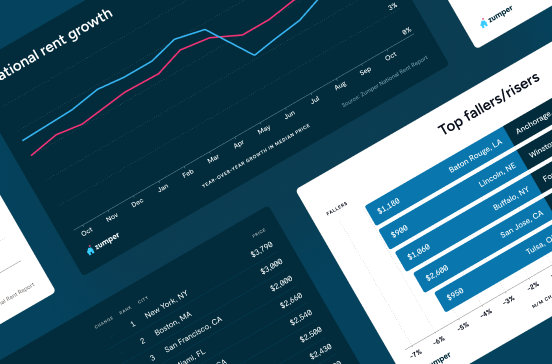
Oro Valley, AZ rent rose 11.3% year over year to a current median of $2,560/month. Renters are paying $130 more per month on average than last year, though rent slipped 1.9% month over month after peaking at $2,650 in June 2026.
Compared to national trends
Oro Valley runs roughly 1.3× the $1,930/month national median, placing it among pricier markets. The city offers 60 total rentals, mostly houses, in a smaller, higher-end rental market.
Price ranges
Studios in Oro Valley rent for $795/month, 1-bedrooms for $1,350/month, and 2- and 3-bedrooms both at $2,500/month, with 4+ bedrooms at $3,050/month. Houses command a median of $2,772/month while apartments are at $1,687/month, with houses making up 72.7% of rentals.
Neighborhood spotlight
Linda Vista Citrus rents fell 61.6% year over year to $1,825/month across 17 rentals. This decline contrasts with the citywide 11.3% rent increase and shows a localized cooldown in this neighborhood.
Median rent
Median rent in Oro Valley
$2,560/mo
vs previous year
The average rent in Oro Valley is $2,560 per month as of July 2026. This is 33% above the national average rent, or $630 more per month.
average price per square foot
Total rentals
Available rentals in Oro Valley
60
for rent on Zumper.com as of July 2026
Rent price distribution
Share of Oro Valley rentals at each price point
Rent trends in Oro Valley, AZ
Average rent prices in Oro Valley have decreased by 2% over the last month and have increased by 11% since last year.
Rent trends
Rent prices on this page are calculated on a rolling 30-day basis and updated daily.
Compare rent prices in
Oro Valley, AZ
Rent prices in Oro Valley vary by bedroom size, rental type, and neighborhood. The average rent for an apartment in Oro Valley is $1,687, whereas a house costs $2,772. 1-bedroom apartments in Oro Valley run $1,013 on average, while 2-bedroom apartments are $1,779.
Listings | ||||
|---|---|---|---|---|
Studio | $795 |  2% | - | |
1 bedroom | $1,350 |  1% | 8% | |
2 bedroom | $2,500 | 7% | 2% | |
3 bedroom | $2,500 | 1% | 7% | |
4 bedroom | $3,050 | 6% | 18% |
Listings | ||
|---|---|---|
Catalina Shadows Estates | $2,750 | |
Copper Creek | $2,000 | |
El Conquistador Resort | $2,500 | |
Rams Canyon | $2,650 | |
Rancho Vistoso | $2,700 | |
Shadow Mountain Estates | $1,397 | |
Sunnyslope | $1,747 | |
Tangerine Terrace | $2,500 | |
The Villages Of La Canada | $2,100 | |
Vista Del Oro Estates | $2,200 |
Listings | ||||
|---|---|---|---|---|
Apartments | $1,687 | 12% | No Change | |
Condos | $2,200 | 1% | No Change | |
Houses | $2,772 | No Change | No Change |
Studio
Average rent
$795
Last 30 days
2%
1 bedroom
Average rent
$1,350
Last 30 days
1%
Last year
8%
2 bedroom
Average rent
$2,500
Last 30 days
7%
Last year
2%
3 bedroom
Average rent
$2,500
Last 30 days
1%
Last year
7%
4 bedroom
Average rent
$3,050
Last 30 days
6%
Last year
18%
Rancho Vistoso
Average rent
$2,700
El Conquistador Resort
Average rent
$2,500
The Villages Of La Canada
Average rent
$2,100
Shadow Mountain Estates
Average rent
$1,397
Catalina Shadows Estates
Average rent
$2,750
Tangerine Terrace
Average rent
$2,500
Vista Del Oro Estates
Average rent
$2,200
Sunnyslope
Average rent
$1,747
Copper Creek
Average rent
$2,000
Rams Canyon
Average rent
$2,650
Apartments
Average rent
$1,687
Last 30 days
12%
Condos
Average rent
$2,200
Last 30 days
1%
Houses
Average rent
$2,772
Last 30 days
No Change
The table above reflects average rent prices in Oro Valley, AZ, broken down by the number of bedrooms, neighborhoods, and property types. The availability of data for each category is dependent on market inventory and will adjust depending on your selected filters.
How does rent in Oro Valley, AZ compare to other cities?
Compare median rent prices in Oro Valley and Casas Adobes by all bedroom counts and property types.
Oro Valley
higher than the national median
lower than the national median
Takeaway
The median rent for all rentals in Oro Valley, AZ is 35% higher than the median rent in Casas Adobes, AZ.
Average rent in nearby cities
Explore rent trends in neighboring markets
$1,897
$2,560
$2,499
$1,717
$1,245
$2,100
$1,895
$972
$1,408
$1,295
$1,610
$1,840
Discover rentals in Oro Valley, AZ

5d+ ago
Shadow Mountain Estates apartment for rent in Oro Valley
1 bed
1 bath
$869
Apartment for rent
5d+ ago
Shadow Mountain Estates apartment for rent in Oro Valley
2 beds
2 baths
$1,149
Apartment for rent

5d+ ago
Condo for rent in Oro Valley
131 E Horizon Cir, Oro Valley, AZ 85737
3 beds
2 baths
$1,450
Condo for rent

5d+ ago
Shadow Mountain Estates apartment for rent in Oro Valley
3 beds
2 baths
$1,499
Apartment for rent


5d+ ago
Rancho Vistoso house for rent in Oro Valley
13816 N Topflite Dr, Oro Valley, AZ 85755
3 beds
2.5 baths
$4,500
House for rent

5d+ ago
Rancho Vistoso house for rent in Oro Valley
14274 N Trade Winds Way, Oro Valley, AZ 85755
2 beds
2 baths
$4,000
House for rent

5d+ ago
El Conquistador Resort townhouse for rent in Oro Valley
784 E Camino Diestro #784, Oro Valley, AZ 85704
2 beds
2 baths
$3,900
House for rent
Available May 1

5d+ ago
Catalina Shadows Estates house for rent in Oro Valley
11979 N Labyrinth Dr, Oro Valley, AZ 85737
2 beds
2 baths
$3,900
House for rent


1h ago
Verified
450 W Cool Dr, Oro Valley, AZ 85704
Studio–2 beds
1–2 baths
$863–$1,786
Price drop
Apartment for rent

16h ago
Verified
4 beds
3 baths
$2,845
House for rent
Available Oct 1

15h ago
Verified
375 E Linda Vista Blvd, Oro Valley, AZ 85704
1–2 beds
1–2 baths
$2,420–$2,650
Apartment for rent

5d+ ago
Verified
3 beds
2 baths
$3,100
House for rent
Available Oct 1


1h ago
Verified
450 W Cool Dr, Oro Valley, AZ 85704
Studio–2 beds
1–2 baths
$863–$1,786
Price drop
Apartment for rent

5d+ ago
Verified
3 beds
2 baths
$2,560
House for rent
Available Sep 14
5d+ ago
Verified
3 beds
2 baths
$3,100
House for rent
Available Oct 1

4h ago
655 W Vistoso Highlands Dr, Oro Valley, AZ 85755
3 beds
2 baths
$2,400
Condo for rent


1h ago
Verified
450 W Cool Dr, Oro Valley, AZ 85704
Studio–2 beds
1–2 baths
$863–$1,786
Price drop
Apartment for rent
16h ago
Verified
4 beds
3 baths
$2,845
House for rent
Available Oct 1
15h ago
Verified
375 E Linda Vista Blvd, Oro Valley, AZ 85704
1–2 beds
1–2 baths
$2,420–$2,650
Apartment for rent
16h ago
375 E Linda Vista Blvd, Oro Valley, AZ 85704
1–2 beds
1–2 baths
$1,735–$1,969
Apartment for rent


Stay up to date with rental market insights

Are you interested in licensing our current and historical rental real estate data, or do you have custom data requests? Contact datalicensing@zumper.com.
Frequently asked questions for Oro Valley, AZ
Quick answers to common questions about the Oro Valley rental market.
How much is rent in Oro Valley?
The average rent in Oro Valley is $2,560 per month as of July 25, 2026.
Is rent up or down in Oro Valley?
Average rent prices in Oro Valley have decreased by 2% over the last month and have increased by 11% since last year.
How does Oro Valley rent compare to the national average?
Rent in Oro Valley is 33% above the national average, which means renters are paying approximately $630 more per month.
Which neighborhoods are most affordable in Oro Valley?
The most affordable neighborhoods in Oro Valley are Shadow Mountain Estates ($1,397/mo), Sunnyslope ($1,747/mo), and Copper Creek ($2,000/mo).
What salary do I need to afford rent in Oro Valley?
To comfortably afford rent in Oro Valley, you'd need to earn approximately $102,000/year, based on spending no more than 30% of your income on rent.
When is the best time of year to rent in Oro Valley?
Based on Zumper's July 2026 data, one-bedroom apartments in Oro Valley average around $1,310/month (down 10.6% year over year) and two-bedrooms approximately $2,410/month (down 3.3% annually).
Methodology
Rent prices are based on Zumper's rental listings from the past 30 days. Median rent is calculated across all available listings and property types on the platform. If you filter the page by bedroom count or property type, the pricing throughout the page will update automatically to reflect that segment of the rental market.
Household and population data come from the U.S. Census Bureau. Cost-of-living data is sourced from the Council for Community and Economic Research's Cost of Living Index (COLI).