
Bedroom count
Property type
Last updated on July 31, 2026
Average rent in
North Andover, MA
Average rent in
Last updated on July 31, 2026
Bedroom count
Property type
Median rent
Median rent in North Andover
$3,670/mo
vs previous year
The average rent in North Andover is $3,670 per month as of July 2026. This is 90% above the national average rent, or $1,740 more per month.
average price per square foot
Total rentals
Available rentals in North Andover
10
for rent on Zumper.com as of July 2026
Rent price distribution
Share of North Andover rentals at each price point
This report has limited data.Due a shortage of data for this selected bedroom and/or property type in North Andover, MA, in the last 30 days, rent estimates may not represent the actual market.
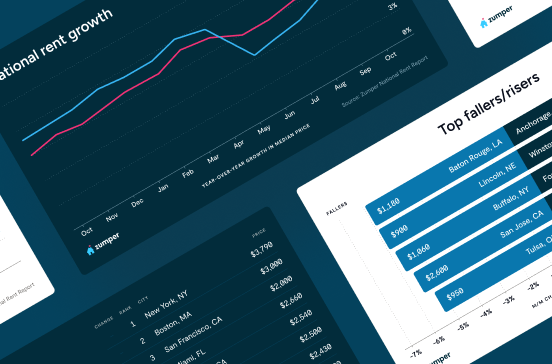
Rent trends in North Andover, MA
Average rent prices in North Andover have increased by 10% over the last month and have increased by 25% since last year.
Rent trends
Rent prices on this page are calculated on a rolling 30-day basis and updated daily.
Compare rent prices in
North Andover, MA
Rent prices in North Andover vary by bedroom size, rental type, and neighborhood. The average rent for an apartment in North Andover is $3,419, whereas a house costs $5,125. 1-bedroom apartments in North Andover run $5,800 on average, while 2-bedroom apartments are $3,380.
Listings | ||||
|---|---|---|---|---|
Studio | $2,792 |  32% | 47% | |
1 bedroom | $2,700 | 3% | 150% | |
2 bedroom | $3,150 | 6% | 111% | |
3 bedroom | $4,467 | 75% | 31% | |
4 bedroom | $3,500 |  2% | - |
At this time, we don't have enough active inventory for all rentals to generate data. Please check back soon to see neighborhood rent prices in North Andover, MA.
Listings | ||||
|---|---|---|---|---|
Apartments | $3,419 | 9% | No Change | |
Condos | $2,175 | 12% | 44% | |
Houses | $5,125 | 6% | No Change |
Studio
Average rent
$2,792
Last 30 days
32%
Last year
47%
1 bedroom
Average rent
$2,700
Last 30 days
3%
Last year
150%
2 bedroom
Average rent
$3,150
Last 30 days
6%
Last year
111%
3 bedroom
Average rent
$4,467
Last 30 days
75%
Last year
31%
4 bedroom
Average rent
$3,500
Last 30 days
2%
At this time, we don't have enough active inventory for all rentals to generate data. Please check back soon to see neighborhood rent prices in North Andover, MA.
Apartments
Average rent
$3,419
Last 30 days
9%
Condos
Average rent
$2,175
Last 30 days
12%
Last year
44%
Houses
Average rent
$5,125
Last 30 days
6%
The table above reflects average rent prices in North Andover, MA, broken down by the number of bedrooms, neighborhoods, and property types. The availability of data for each category is dependent on market inventory and will adjust depending on your selected filters.
How does rent in North Andover, MA compare to other cities?
Compare median rent prices in North Andover and Beverly by all bedroom counts and property types.
North Andover
higher than the national median
higher than the national median
Takeaway
The median rent for all rentals in North Andover, MA is 47% higher than the median rent in Beverly, MA.
Average rent in nearby cities
Explore rent trends in neighboring markets
Discover rentals in North Andover, MA

5d+ ago
Apartment for rent in North Andover
5 3rd St #3, North Andover, MA 01845
1 bed
1 bath
$1,550
The price shown reflects a 12-month lease. Fees may apply.Apartment for rent
Available Jul 23

5d+ ago
Apartment for rent in North Andover
37 37 Fernview Ave U:7, North Andover, MA 01845
2 beds
1 bath
$2,500
The price shown reflects a 12-month lease. Fees may apply.Apartment for rent

5d+ ago
32 Empire Dr, North Andover, MA 01845
3 beds
2 baths
$4,395
The price shown reflects a 12-month lease. Fees may apply.House for rent
Available Aug 24

29m ago
Verified
88 High St, North Andover, MA 01845
Studio–3 beds
1–2 baths
$2,205–$3,790
Price drop
The price shown reflects a 12-month lease and includes base rent plus all required monthly fees provided by the property.Apartment for rent

5d+ ago
Condo for rent in North Andover
11 Walker Rd #5, North Andover, MA 01845
1 bed
1 bath
$2,050
The price shown reflects a 12-month lease and includes base rent plus all required monthly fees provided by the property.Condo for rent
Available Jul 1

5d+ ago
Apartment for rent in North Andover
1 bed
1 bath
$1,995
The price shown reflects a 12-month lease. Fees may apply.Apartment for rent
Available Aug 1

5d+ ago
Apartment for rent in North Andover
172 Chestnut St #13, North Andover, MA 01845
Studio
1 bath
$1,950
The price shown reflects a 12-month lease. Fees may apply.Apartment for rent

29m ago
Verified
88 High St, North Andover, MA 01845
Studio–3 beds
1–2 baths
$2,205–$3,790
Price drop
The price shown reflects a 12-month lease and includes base rent plus all required monthly fees provided by the property.Apartment for rent

22h ago
1252 Osgood St, North Andover, MA 01845
1–2 beds
1–2 baths
$2,411–$3,453
Price drop
The price shown reflects a 12-month lease and includes base rent plus all required monthly fees provided by the property.Apartment for rent
5d+ ago
Apartment for rent in North Andover
1 bed
1 bath
$1,995
The price shown reflects a 12-month lease. Fees may apply.Apartment for rent
Available Aug 1
5d+ ago
Apartment for rent in North Andover
37 37 Fernview Ave U:7, North Andover, MA 01845
2 beds
1 bath
$2,500
The price shown reflects a 12-month lease. Fees may apply.Apartment for rent
5d+ ago
Apartment for rent in North Andover
37 37 Fernview Ave U:7, North Andover, MA 01845
2 beds
1 bath
$2,500
The price shown reflects a 12-month lease. Fees may apply.Apartment for rent

5d+ ago
Condo for rent in North Andover
4 Harvest Dr #311, North Andover, MA 01845
2 beds
2 baths
$3,400
The price shown reflects a 12-month lease and includes base rent plus all required monthly fees provided by the property.Condo for rent
Available Jul 15
29m ago
Verified
88 High St, North Andover, MA 01845
Studio–3 beds
1–2 baths
$2,205–$3,790
Price drop
The price shown reflects a 12-month lease and includes base rent plus all required monthly fees provided by the property.Apartment for rent
5d+ ago
Apartment for rent in North Andover
172 Chestnut St #13, North Andover, MA 01845
Studio
1 bath
$1,950
The price shown reflects a 12-month lease. Fees may apply.Apartment for rent
29m ago
Verified
88 High St, North Andover, MA 01845
Studio–3 beds
1–2 baths
$2,205–$3,790
Price drop
The price shown reflects a 12-month lease and includes base rent plus all required monthly fees provided by the property.Apartment for rent
22h ago
1252 Osgood St, North Andover, MA 01845
2 beds
2 baths
$3,320–$3,453
Price drop
The price shown reflects a 12-month lease and includes base rent plus all required monthly fees provided by the property.Apartment for rent
5d+ ago
Condo for rent in North Andover
11 Walker Rd #5, North Andover, MA 01845
1 bed
1 bath
$2,050
The price shown reflects a 12-month lease and includes base rent plus all required monthly fees provided by the property.Condo for rent
Available Jul 1
Stay up to date with rental market insights

Are you interested in licensing our current and historical rental real estate data, or do you have custom data requests? Contact datalicensing@zumper.com.
Frequently asked questions for North Andover, MA
Quick answers to common questions about the North Andover rental market.
How much is rent in North Andover?
The average rent in North Andover is $3,670 per month as of July 25, 2026.
Is rent up or down in North Andover?
Average rent prices in North Andover have increased by 10% over the last month and have increased by 25% since last year.
How does North Andover rent compare to the national average?
Rent in North Andover is 90% above the national average, which means renters are paying approximately $1,740 more per month.
What salary do I need to afford rent in North Andover?
To comfortably afford rent in North Andover, you'd need to earn approximately $147,000/year, based on spending no more than 30% of your income on rent.
Methodology
Rent prices are based on Zumper's rental listings from the past 30 days. Median rent is calculated across all available listings and property types on the platform. If you filter the page by bedroom count or property type, the pricing throughout the page will update automatically to reflect that segment of the rental market.
Household and population data come from the U.S. Census Bureau. Cost-of-living data is sourced from the Council for Community and Economic Research's Cost of Living Index (COLI).