
Bedroom count
Property type
Last updated on May 24, 2026
Average rent in
Long Island Business Institute Commack, NY
Average rent in
Last updated on May 24, 2026
Bedroom count
Property type
Median rent
Median rent in Wyandanch
$3,714/mo
vs previous year
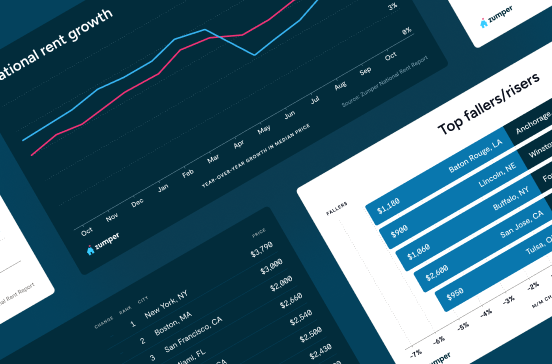
The average rent in Wyandanch is $3,714 per month as of May 2026. This is 90% above the national average rent, or $1,764 more per month.
average price per square foot
Total rentals
Available rentals in Wyandanch
122
for rent on Zumper.com as of May 2026
Rent price distribution
Share of Wyandanch rentals at each price point
Rent trends in Long Island Business Institute Commack, NY
Average rent prices in Wyandanch have increased by 3% since last year. At this time, we don't have enough information to generate yearly trends. Please see below for more rent price details.
Rent trends
Rent prices on this page are calculated on a rolling 30-day basis and updated daily.
Compare rent prices in
Long Island Business Institute Commack, NY
Rent prices in Wyandanch vary by bedroom size, rental type, and neighborhood. The average rent for an apartment in Wyandanch is $3,650, whereas a house costs $4,500. 1-bedroom apartments in Wyandanch run $3,100 on average, while 2-bedroom apartments are $3,900.
Listings | ||||
|---|---|---|---|---|
Studio | $1,443 | - |  1% | |
1 bedroom | $3,000 | - | 3% | |
2 bedroom | $3,850 | - | 4% | |
3 bedroom | $4,527 | - | 28% | |
4 bedroom | $5,125 | - | 24% |
At this time, we don't have enough active inventory for all rentals to generate data. Please check back soon to see neighborhood rent prices in Long Island Business Institute Commack, NY.
Listings | ||||
|---|---|---|---|---|
Apartments | $3,650 | - | No Change | |
Condos | $3,850 | - | - | |
Houses | $4,500 | - | No Change | |
Rooms | $1,000 | - | - |
Studio
Average rent
$1,443
Last year
1%
1 bedroom
Average rent
$3,000
Last year
3%
2 bedroom
Average rent
$3,850
Last year
4%
3 bedroom
Average rent
$4,527
Last year
28%
4 bedroom
Average rent
$5,125
Last year
24%
At this time, we don't have enough active inventory for all rentals to generate data. Please check back soon to see neighborhood rent prices in Long Island Business Institute Commack, NY.
Apartments
Average rent
$3,650
Condos
Average rent
$3,850
Houses
Average rent
$4,500
Rooms
Average rent
$1,000
The table above reflects average rent prices in Long Island Business Institute Commack, NY, broken down by the number of bedrooms, neighborhoods, and property types. The availability of data for each category is dependent on market inventory and will adjust depending on your selected filters.
Discover rentals in Long Island Business Institute Commack, NY

5d+ ago
House for rent in Central Islip
62 Ridge Ave, Central Islip, NY 11722
1 bed
1 bath
$1,100
House for rent
Available May 15

21h ago
Apartment for rent in East Northport
360 Larkfield Rd #18, East Northport, NY 11731
2 beds
1 bath
$2,300
Apartment for rent

2d ago
Verified
156 E Pulaski Rd, Huntington Station, NY 11746
2–3 beds
1 bath
$2,495–$3,784
Apartment for rent

3d ago
Apartment for rent in Central Islip
52 Hoffman Ln, Central Islip, NY 11722
3 beds
1 bath
$3,200
$3,000
Price drop
Apartment for rent


5d+ ago
Townhouse for rent in Smithtown
3 beds
2.5 baths
$10,000
House for rent

5d+ ago
House for rent in Commack
21 Wesleyan Rd, Commack, NY 11725
4 beds
1.5 baths
$8,000
House for rent

5d+ ago
House for rent in Dix Hills
38 Arista Dr, Dix Hills, NY 11746
4 beds
2.5 baths
$7,500
House for rent

2d ago
Verified
100 Court North Dr #1733A, Melville, NY 11747
1–3 beds
1–2 baths
$5,050–$5,880
Price drop
Apartment for rent


2d ago
Verified
156 E Pulaski Rd, Huntington Station, NY 11746
2–3 beds
1 bath
$2,495–$3,784
Apartment for rent

8h ago
Verified
1710 Devonshire Rd, Hauppauge, NY 11788
Studio–3 beds
1–2 baths
$2,315–$3,695
Apartment for rent
Available May 24
5h ago
Verified
100 Court North Dr, Melville, NY 11747
1–3 beds
1–2 baths
$3,595–$5,155
Price drop
Apartment for rent

1d ago
Verified
1700 E 5th St, Huntington Station, NY 11746
1–3 beds
1–2 baths
$3,410–$4,847
Price drop
Apartment for rent


1d ago
Verified
313 Avalon Cir, Nesconset, NY 11787
1–3 beds
1–2 baths
$3,185–$4,385
Price drop
Apartment for rent
5h ago
Verified
100 Court North Dr, Melville, NY 11747
1–3 beds
1–2 baths
$3,595–$5,155
Price drop
Apartment for rent
1d ago
Verified
1700 E 5th St, Huntington Station, NY 11746
1–3 beds
1–2 baths
$3,410–$4,847
Price drop
Apartment for rent
8h ago
Verified
1710 Devonshire Rd, Hauppauge, NY 11788
Studio–3 beds
1–2 baths
$2,315–$3,695
Apartment for rent
Available May 24

8h ago
Verified
1710 Devonshire Rd, Hauppauge, NY 11788
Studio–3 beds
1–2 baths
$2,315–$3,695
Apartment for rent
Available May 24
5h ago
Verified
100 Court North Dr, Melville, NY 11747
1–3 beds
1–2 baths
$3,595–$5,155
Price drop
Apartment for rent
1d ago
Verified
313 Avalon Cir, Nesconset, NY 11787
1–3 beds
1–2 baths
$3,185–$4,385
Price drop
Apartment for rent
1d ago
Verified
1700 E 5th St, Huntington Station, NY 11746
1–2 beds
1–2 baths
$3,410–$4,225
Price drop
Apartment for rent

Stay up to date with rental market insights

Are you interested in licensing our current and historical rental real estate data, or do you have custom data requests? Contact datalicensing@zumper.com.
Frequently asked questions for Long Island Business Institute Commack, NY
Quick answers to common questions about the Wyandanch rental market.
How much is rent in Wyandanch?
The average rent in Wyandanch is $3,714 per month as of May 23, 2026.
Is rent up or down in Wyandanch?
Average rent prices in Wyandanch have increased by 3% since last year.
How does Wyandanch rent compare to the national average?
Rent in Wyandanch is 90% above the national average, which means renters are paying approximately $1,764 more per month.
What salary do I need to afford rent in Wyandanch?
To comfortably afford rent in Wyandanch, you'd need to earn approximately $149,000/year, based on spending no more than 30% of your income on rent.
Methodology
Rent prices are based on Zumper's rental listings from the past 30 days. Median rent is calculated across all available listings and property types on the platform. If you filter the page by bedroom count or property type, the pricing throughout the page will update automatically to reflect that segment of the rental market.
Household and population data come from the U.S. Census Bureau. Cost-of-living data is sourced from the Council for Community and Economic Research's Cost of Living Index (COLI).