
Bedroom count
Property type
Last updated on June 27, 2026
Average rent in
Las Vegas, NV
Average rent in
Last updated on June 27, 2026
Bedroom count
Property type
Key takeaways for renters
Where Las Vegas rent stands today
Las Vegas, NV rent is essentially flat year over year, with a current median of $1,895/month. Renters are paying $62 less per month on average than last year, with a modest month-over-month decline of 0.8%.
Compared to national trends
Las Vegas sits 2.8% more affordable than the $1,950/month national median, with 2,977 total rentals offering a moderate market size for renters.
Price ranges
Studios in Las Vegas rent for $900/month, 1-bedrooms for $1,150/month, and 2-bedrooms for $1,450/month, with 3-bedrooms at $2,050/month and 4+ bedrooms at $2,695/month. Houses command a median of $2,250/month, while apartments sit at $1,270/month, reflecting the diverse inventory composition.
Neighborhood spotlight
Charleston Preservation West rents fell 53.0% year over year to $1,597/month across 13 rentals, a stark contrast to the broadly flat citywide market. This steep decline shows localized shifts not seen citywide.
Median rent
Median rent in Las Vegas
$1,895/mo
vs previous year
The average rent in Las Vegas is $1,895 per month as of June 2026. This is 3% below the national average rent, or $55 less per month.
average price per square foot
Total rentals
Available rentals in Las Vegas
2,977
for rent on Zumper.com as of June 2026
Rent price distribution
Share of Las Vegas rentals at each price point
Rent trends in Las Vegas, NV
Average rent prices in Las Vegas have decreased by 1% over the last month and have remained the same since last year.
Rent trends
Rent prices on this page are calculated on a rolling 30-day basis and updated daily.
Compare rent prices in
Las Vegas, NV
Rent prices in Las Vegas vary by bedroom size, rental type, and neighborhood. The average rent for an apartment in Las Vegas is $1,270, whereas a house costs $2,250. 1-bedroom apartments in Las Vegas run $1,165 on average, while 2-bedroom apartments are $1,314.
Listings | ||||
|---|---|---|---|---|
Studio | $900 |  1% |  2% | |
1 bedroom | $1,150 | 1% | 3% | |
2 bedroom | $1,450 | 1% | 4% | |
3 bedroom | $2,050 | 1% | 2% | |
4 bedroom | $2,695 | 4% | 2% |
Listings | ||
|---|---|---|
Bella Vita | $1,299 | |
Canyon Gate | $1,600 | |
Downtown Las Vegas | $1,050 | |
Mira Villas | $2,350 | |
Peccole Ranch | $1,949 | |
Providence | $2,295 | |
Rancho Oakey | $1,700 | |
Sun City Summerlin | $2,100 | |
The Section Seven | $2,240 | |
Tule Springs | $2,350 |
Listings | ||||
|---|---|---|---|---|
Apartments | $1,270 | 2% | No Change | |
Condos | $1,440 | 1% | No Change | |
Houses | $2,250 | 2% | No Change | |
Rooms | $844 | 1% | No Change |
Studio
Average rent
$900
Last 30 days
1%
Last year
2%
1 bedroom
Average rent
$1,150
Last 30 days
1%
Last year
3%
2 bedroom
Average rent
$1,450
Last 30 days
1%
Last year
4%
3 bedroom
Average rent
$2,050
Last 30 days
1%
Last year
2%
4 bedroom
Average rent
$2,695
Last 30 days
4%
Last year
2%
Mira Villas
Average rent
$2,350
Downtown Las Vegas
Average rent
$1,050
Rancho Oakey
Average rent
$1,700
Bella Vita
Average rent
$1,299
Peccole Ranch
Average rent
$1,949
Providence
Average rent
$2,295
Canyon Gate
Average rent
$1,600
Sun City Summerlin
Average rent
$2,100
Tule Springs
Average rent
$2,350
The Section Seven
Average rent
$2,240
Apartments
Average rent
$1,270
Last 30 days
2%
Condos
Average rent
$1,440
Last 30 days
1%
Houses
Average rent
$2,250
Last 30 days
2%
Rooms
Average rent
$844
Last 30 days
1%
The table above reflects average rent prices in Las Vegas, NV, broken down by the number of bedrooms, neighborhoods, and property types. The availability of data for each category is dependent on market inventory and will adjust depending on your selected filters.
How does rent in Las Vegas, NV compare to other cities?
Compare median rent prices in Las Vegas and Blue Diamond by all bedroom counts and property types.
Las Vegas
lower than the national median
higher than the national median
Takeaway
The median rent for all rentals in Las Vegas, NV is 12% lower than the median rent in Blue Diamond, NV.
Average rent in nearby cities
Explore rent trends in neighboring markets
$2,165
$1,595
$2,300
$2,165
$2,000
$2,020
$1,889
$2,000
$3,150
$1,495
$1,845
$1,430
Cost of living in Las Vegas, NV
Explore the cost of essential expenses, and then use our rent calculator to find out how much rent you can afford.
Expenses accrued by most renters | Average cost compared to national average |
|---|---|
| Goods & Services | 16% lower |
| Groceries | 3% higher |
| Health | 8% lower |
| Housing | 3% higher |
| Transportation | 13% higher |
| Utilities | 9% lower |
Discover rentals in Las Vegas, NV

5d+ ago
Townhouse for rent in Las Vegas
6032 Crown Palms Ave, Las Vegas, NV 89139
2 beds
1 bath
$600
The price shown reflects a 12-month lease. Fees may apply.House for rent
Available Jun 6

3d ago
Townhouse for rent in Las Vegas
Alpheus River Ave #0000, Las Vegas, NV 89106
3 beds
2.5 baths
$685
The price shown reflects a 12-month lease and includes base rent plus all required monthly fees provided by the property.House for rent
Available Jun 7

2d ago
5320 Swenson St, Las Vegas, NV 89119
1 bed
1 bath
$695
The price shown reflects a 12-month lease. Fees may apply.Apartment for rent

3d ago
Apartment for rent in Las Vegas
1007 C St #3, Las Vegas, NV 89106
1 bed
1 bath
$700
The price shown reflects a 12-month lease. Fees may apply.Apartment for rent


5d+ ago
Apartment for rent in Las Vegas
4381 W Flamingo Rd #59302, Las Vegas, NV 89103
4 beds
4.5 baths
$50,000
The price shown reflects a 12-month lease and includes base rent plus all required monthly fees provided by the property.Apartment for rent
Available Aug 18

5d+ ago
Rancho Oakey house for rent in Las Vegas
2401 Driftwood Dr, Las Vegas, NV 89107
4 beds
3 baths
$25,000
The price shown reflects a 12-month lease. Fees may apply.House for rent

5d+ ago
Apartment for rent in Las Vegas
4381 W Flamingo Rd #55308, Las Vegas, NV 89103
2 beds
2.5 baths
$20,000
The price shown reflects a 12-month lease and includes base rent plus all required monthly fees provided by the property.Apartment for rent
Available Nov 1

5d+ ago
Mira Villas condo for rent in Las Vegas
9101 Alta Dr #1, Las Vegas, NV 89145
2 beds
2.5 baths
$16,500
The price shown reflects a 12-month lease. Fees may apply.Condo for rent


9h ago
Verified
6775 Badura Ave, Las Vegas, NV 89118
1–3 beds
1–2 baths
$1,615–$2,670
The price shown reflects a 12-month lease and includes base rent plus all required monthly fees provided by the property.Apartment for rent

16h ago
Verified
12656 Southern Highlands Pkwy, Las Vegas, NV 89141
Studio–2 beds
1–2 baths
$1,650–$2,620
The price shown reflects a 12-month lease and includes base rent plus all required monthly fees provided by the property.Apartment for rent

14m ago
Verified
2601 S Grand Canyon Dr, Las Vegas, NV 89117
1–2 beds
1–2 baths
$1,332–$2,946
The price shown reflects a 12-month lease and includes base rent plus all required monthly fees provided by the property.Apartment for rent


14m ago
Verified
2601 S Grand Canyon Dr, Las Vegas, NV 89117
1–2 beds
1–2 baths
$1,332–$2,946
The price shown reflects a 12-month lease and includes base rent plus all required monthly fees provided by the property.Apartment for rent
16h ago
Verified
4801 E Sahara Ave, Las Vegas, NV 89104
1–3 beds
1–2 baths
$1,119–$2,849
Price drop
The price shown reflects a 12-month lease and includes base rent plus all required monthly fees provided by the property.Apartment for rent


9h ago
Verified
6775 Badura Ave, Las Vegas, NV 89118
1–3 beds
1–2 baths
$1,615–$2,670
The price shown reflects a 12-month lease and includes base rent plus all required monthly fees provided by the property.Apartment for rent
16h ago
Verified
12656 Southern Highlands Pkwy, Las Vegas, NV 89141
Studio–2 beds
1–2 baths
$1,650–$2,620
The price shown reflects a 12-month lease and includes base rent plus all required monthly fees provided by the property.Apartment for rent
14m ago
Verified
2601 S Grand Canyon Dr, Las Vegas, NV 89117
1–2 beds
1–2 baths
$1,332–$2,946
The price shown reflects a 12-month lease and includes base rent plus all required monthly fees provided by the property.Apartment for rent
Stay up to date with rental market insights


Are you interested in licensing our current and historical rental real estate data, or do you have custom data requests? Contact datalicensing@zumper.com.
Frequently asked questions for Las Vegas, NV
Quick answers to common questions about the Las Vegas rental market.
How much is rent in Las Vegas?
The average rent in Las Vegas is $1,895 per month as of June 27, 2026.
Is rent up or down in Las Vegas?
Average rent prices in Las Vegas have decreased by 1% over the last month and have remained the same since last year.
How does Las Vegas rent compare to the national average?
Rent in Las Vegas is 3% below the national average, which means renters are paying approximately $55 less per month.
Which neighborhoods are most affordable in Las Vegas?
The most affordable neighborhoods in Las Vegas are Downtown Las Vegas ($1,050/mo), Bella Vita ($1,299/mo), and Canyon Gate ($1,600/mo).
What salary do I need to afford rent in Las Vegas?
To comfortably afford rent in Las Vegas, you'd need to earn approximately $76,000/year, based on spending no more than 30% of your income on rent.
When is the best time of year to rent in Las Vegas?
Las Vegas 1-bedroom apartments average around $1,200 per month in 2025, while 2-bedroom units rent for around $1,500 monthly. One-bedroom rents declined 3.3% from the previous year, while 2-bedroom prices remained relatively stable.
Methodology
Rent prices are based on Zumper's rental listings from the past 30 days. Median rent is calculated across all available listings and property types on the platform. If you filter the page by bedroom count or property type, the pricing throughout the page will update automatically to reflect that segment of the rental market.
Household and population data come from the U.S. Census Bureau. Cost-of-living data is sourced from the Council for Community and Economic Research's Cost of Living Index (COLI).
For additional insights into rental trends, including month-over-month changes and historical comparisons, see Zumper's Monthly Metro Report.
Las Vegas Metro Report
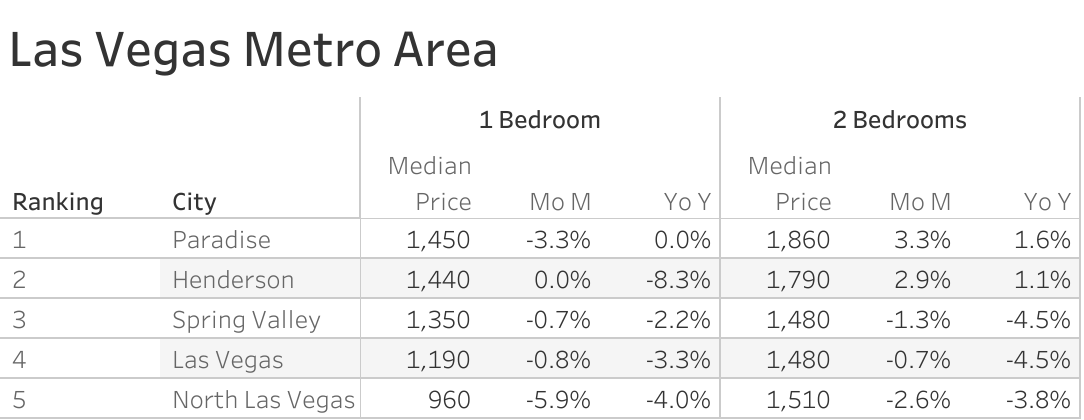
The Zumper Las Vegas Metro Report analyzed active listings last month across metro cities to showcase the most and least expensive cities and those with the fastest growing rents. The Nevada one bedroom median rent was $1,284 last month.
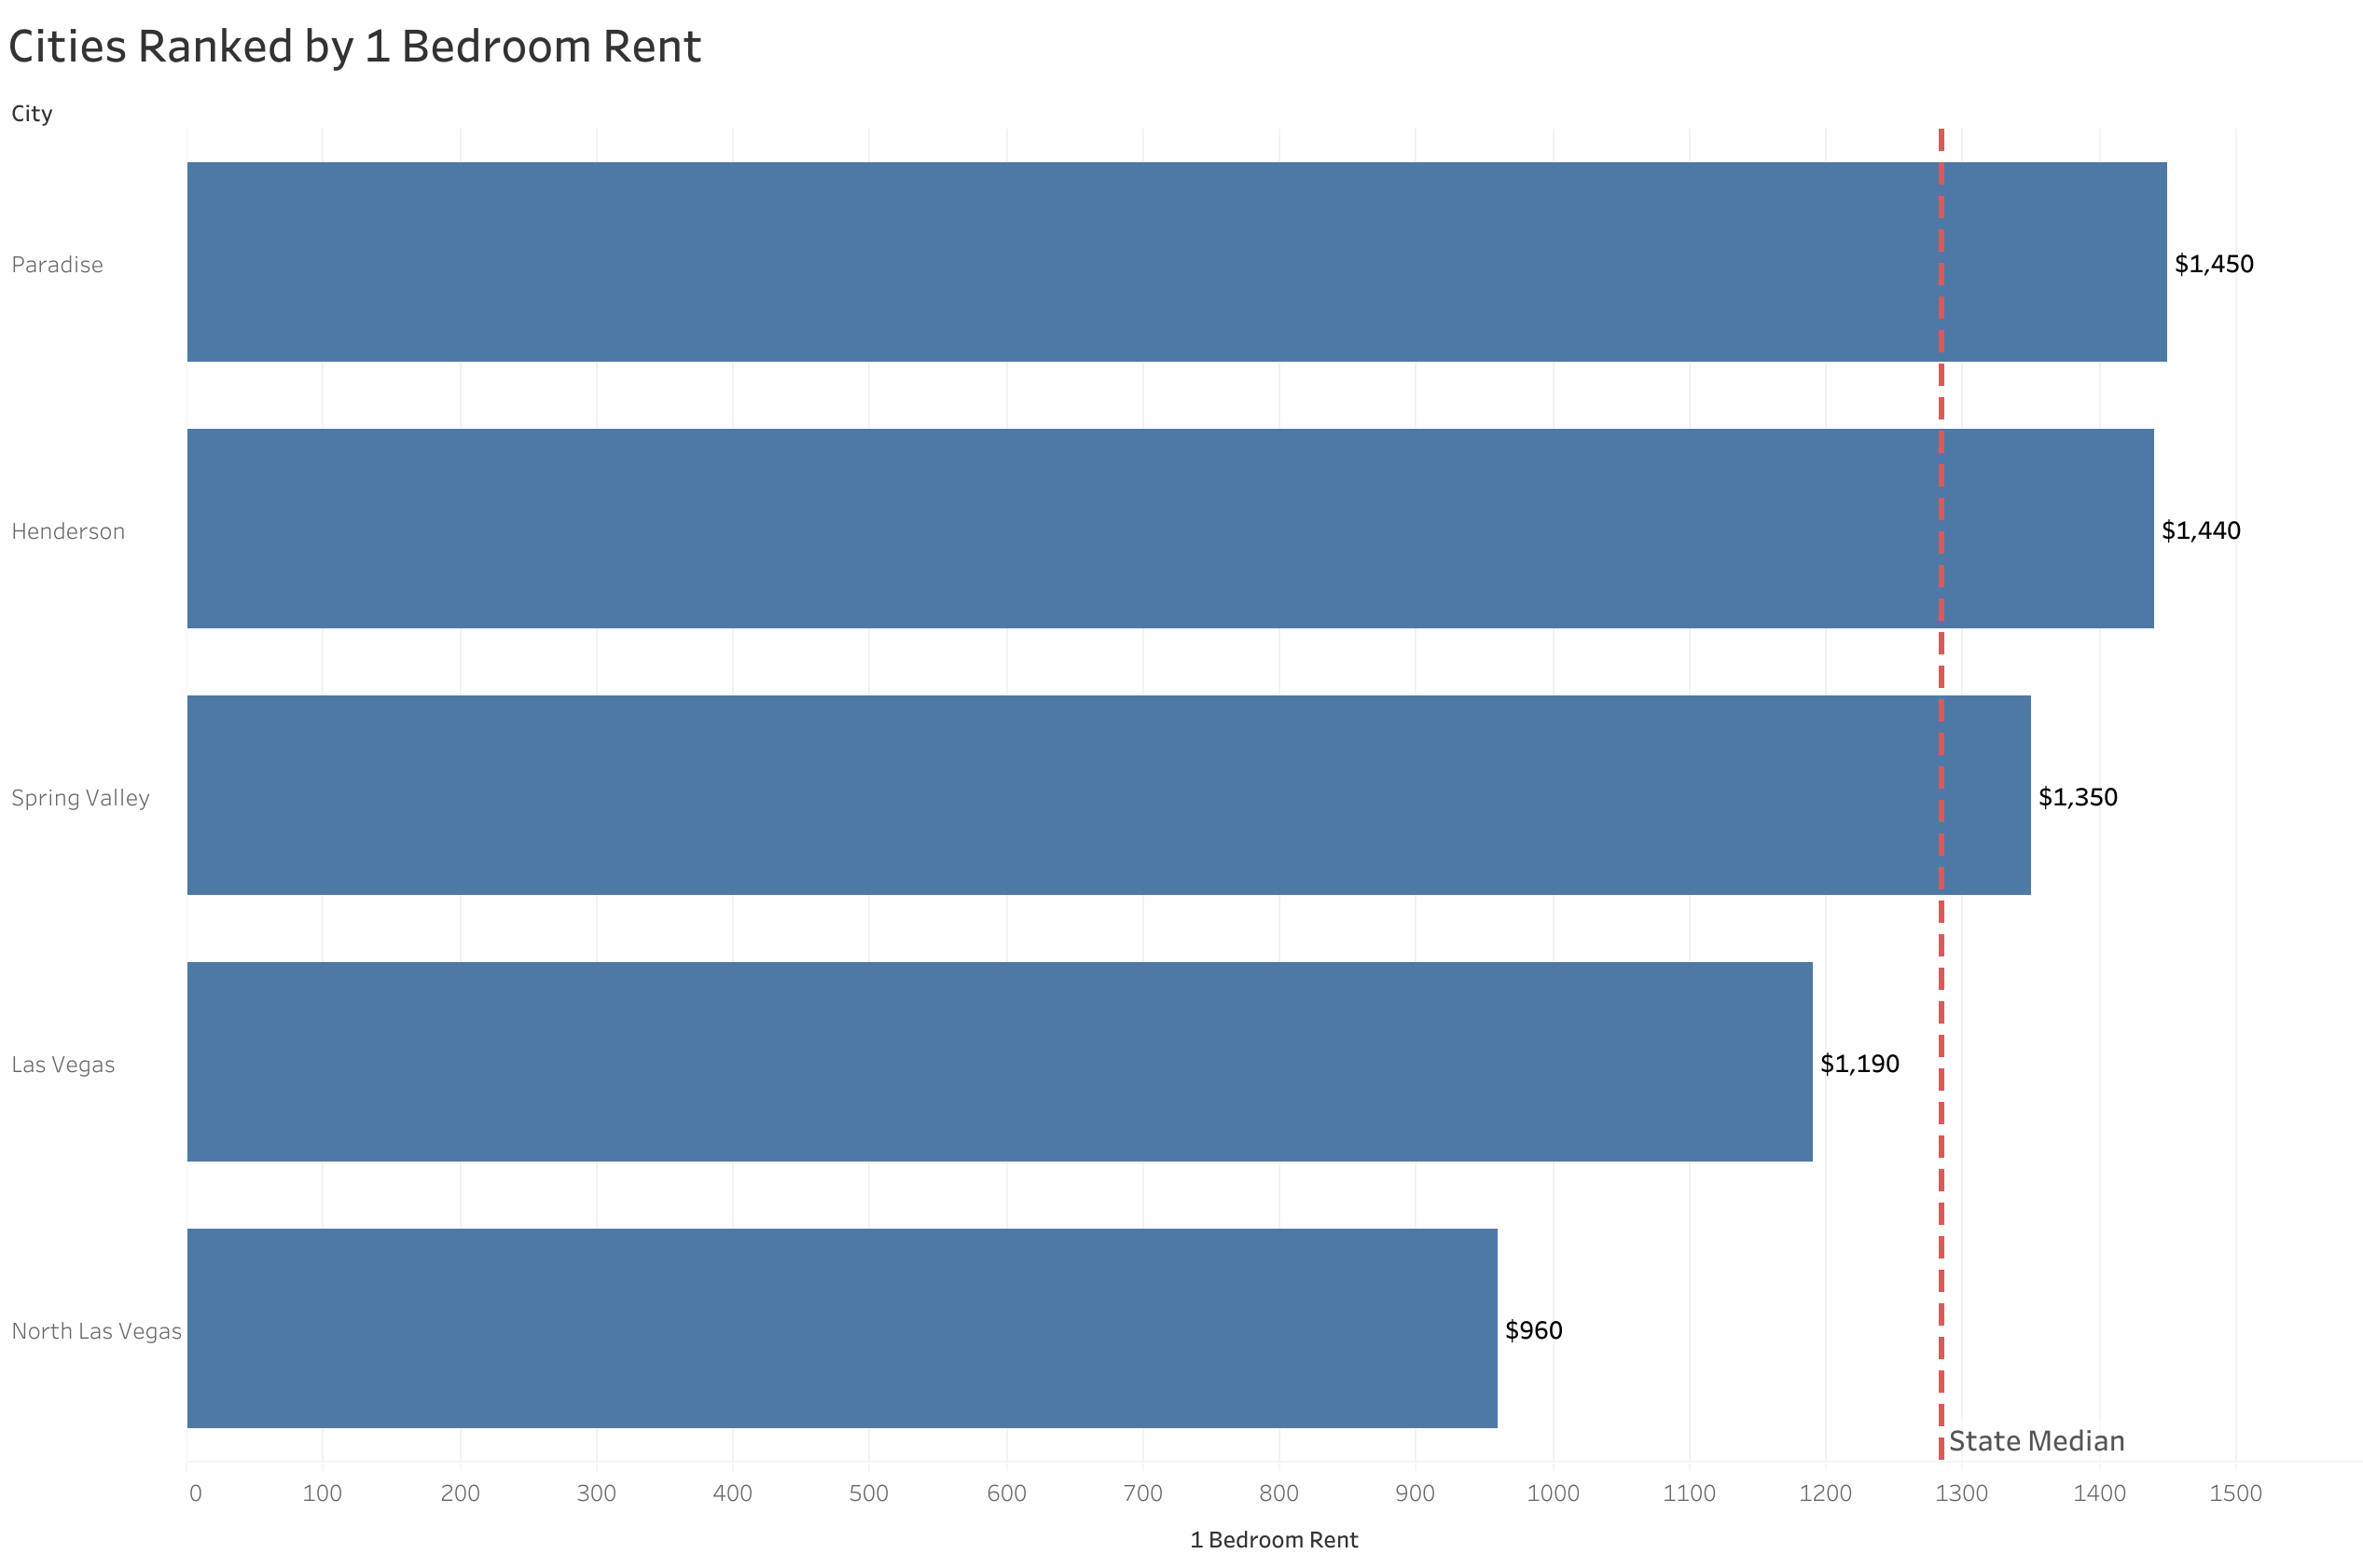
The Most Expensive
- Paradise ranked as the most expensive city with one-bedrooms priced at $1,450.
- Henderson was the second priciest with rent at $1,440.
- Spring Valley came in third with rent at $1,350.
The Least Expensive
- North Las Vegas was the most affordable city with one-bedrooms priced at $960.
- Las Vegas ranked as the second least expensive with rent at $1,190.
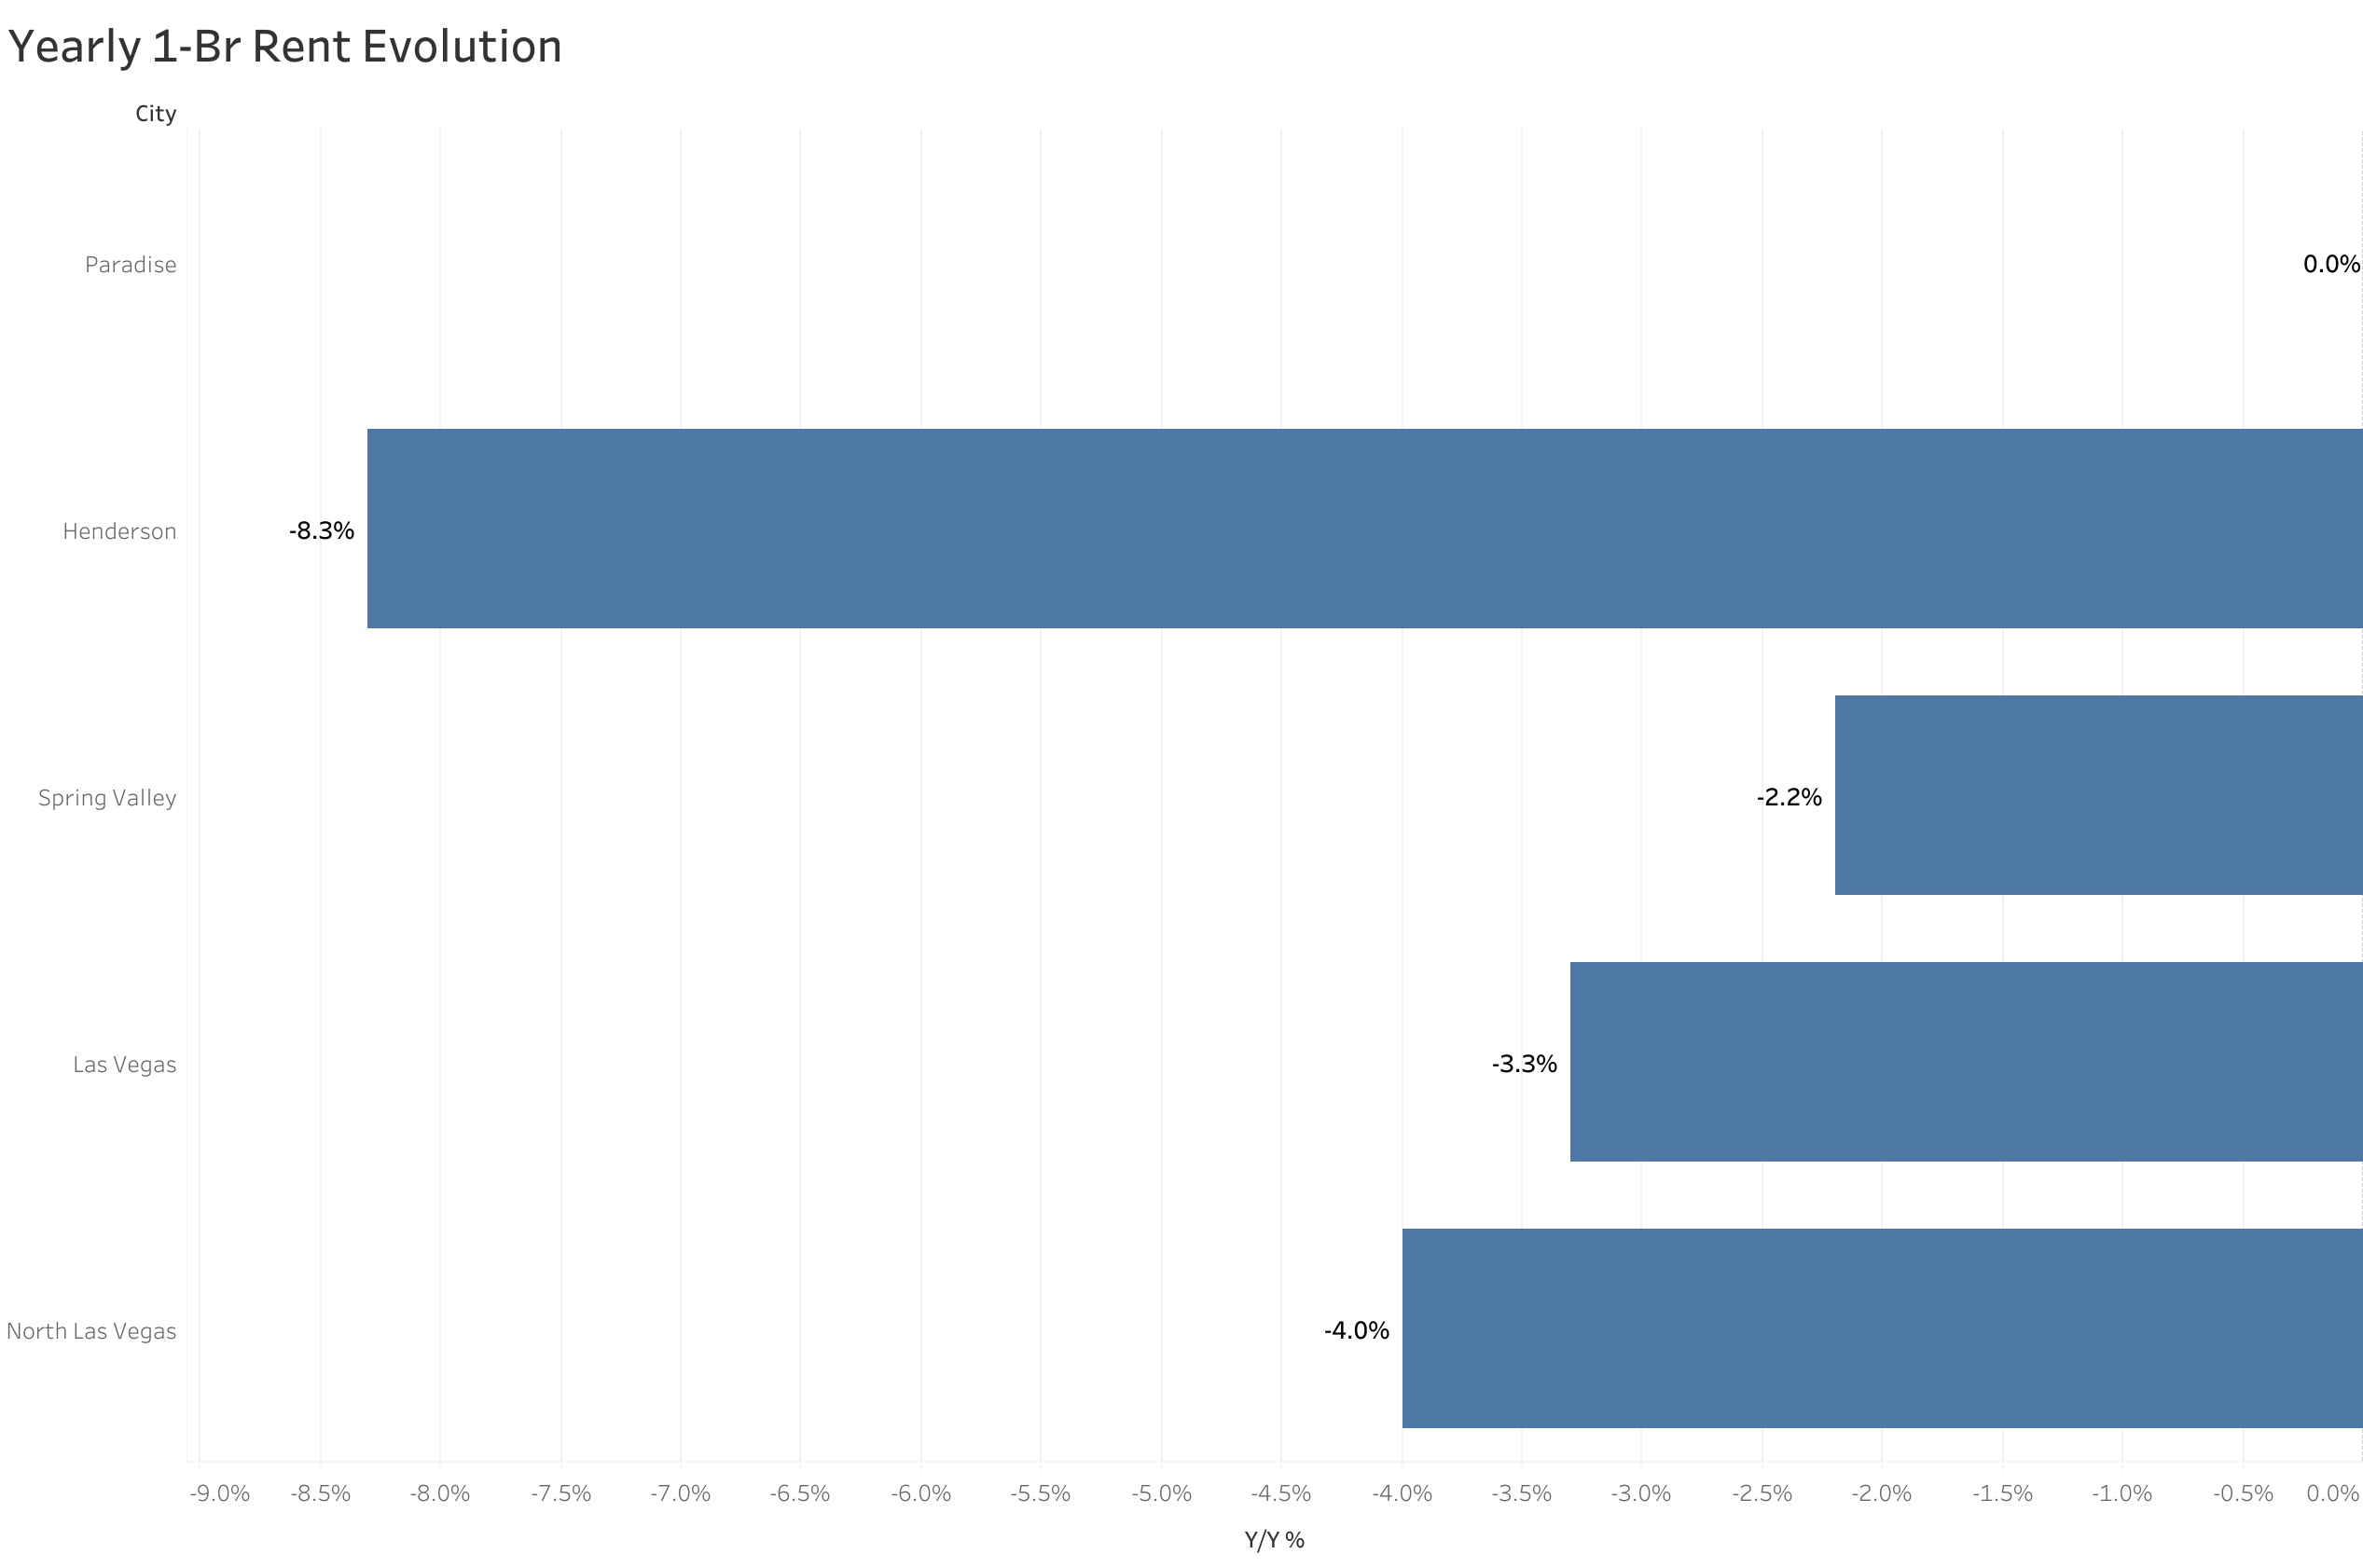
The Largest Decline (Y/Y%)
- Henderson had the largest annual rent price decline, falling 8.3%.
- North Las Vegas saw rent drop 4%, making it second.
- Las Vegas was third with rent decreasing 3.3%.
The Largest Decline (M/M%)
- North Las Vegas rent experienced the biggest monthly decline, down 5.9%.
- Paradise placed second with rent falling 3.3%.
- Las Vegas ranked third with rent decreasing 0.8%.
About
The Zumper Las Vegas Metro Area Report analyzed active listings that hit the market last month. Listings are aggregated by city to calculate median asking rents.
Words by
Crystal ChenCrystal Chen is a seasoned real estate and housing market expert with more than a decade of experience analyzing rental trends, housing affordability, and urban living. At Zumper, she leads data storytelling as well as press and media relations, where she translates complex housing research into easily digestible insights for renters, industry professionals, and journalists. Her reports can be seen cited in national outlets like The New York Times, The Wall Street Journal, and CNBC. She is passionate about helping renters navigate today’s evolving housing landscape with clarity and confidence. Living in New York City herself, she knows firsthand the chaos and challenges of navigating a competitive rental market.