Notable Trends
- Zumper’s National Rent Index showed the fifth straight month of flat or declining rates across the board: one-bedroom median rent decreased 0.7% this month to $1,501, while two-bedrooms fell 0.4% to $1,880. On an annual basis, one and two-bedroom prices are down 2.2% and 1.2%, respectively.
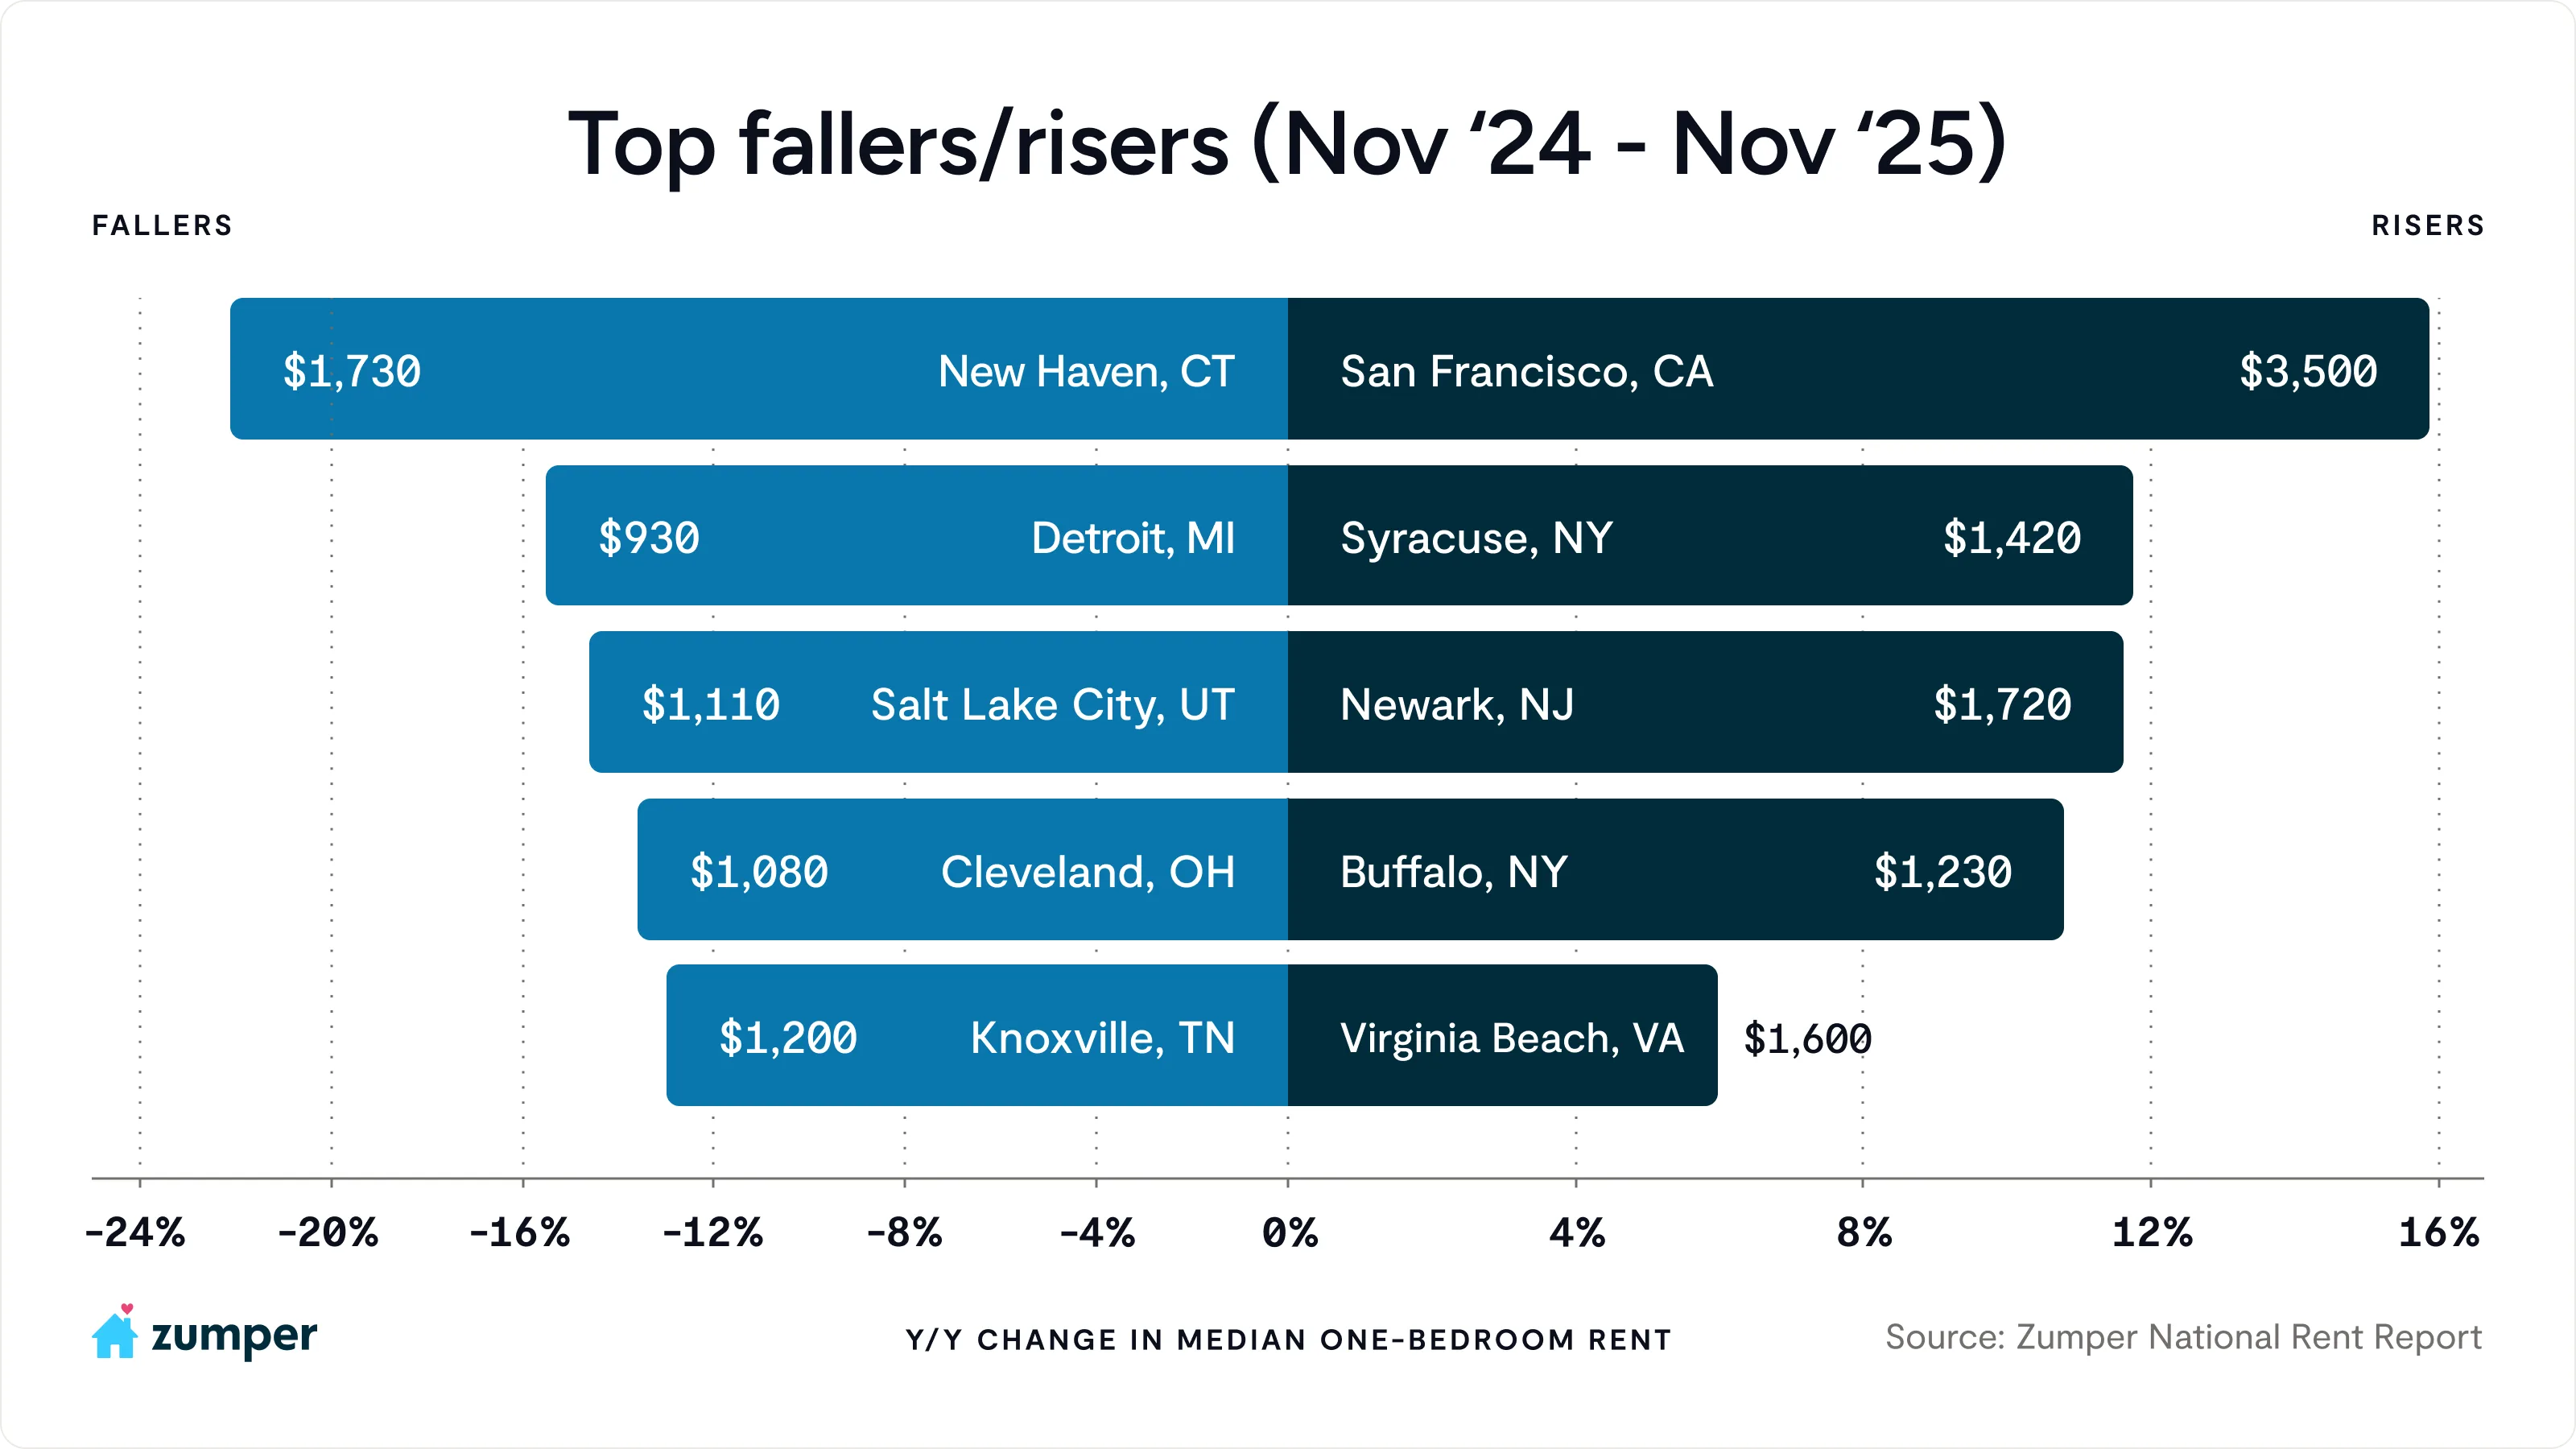
- San Francisco continues to lead the nation in rent growth, with one-bedroom rent up 15.9% annually and two-bedrooms climbing 14.8%.
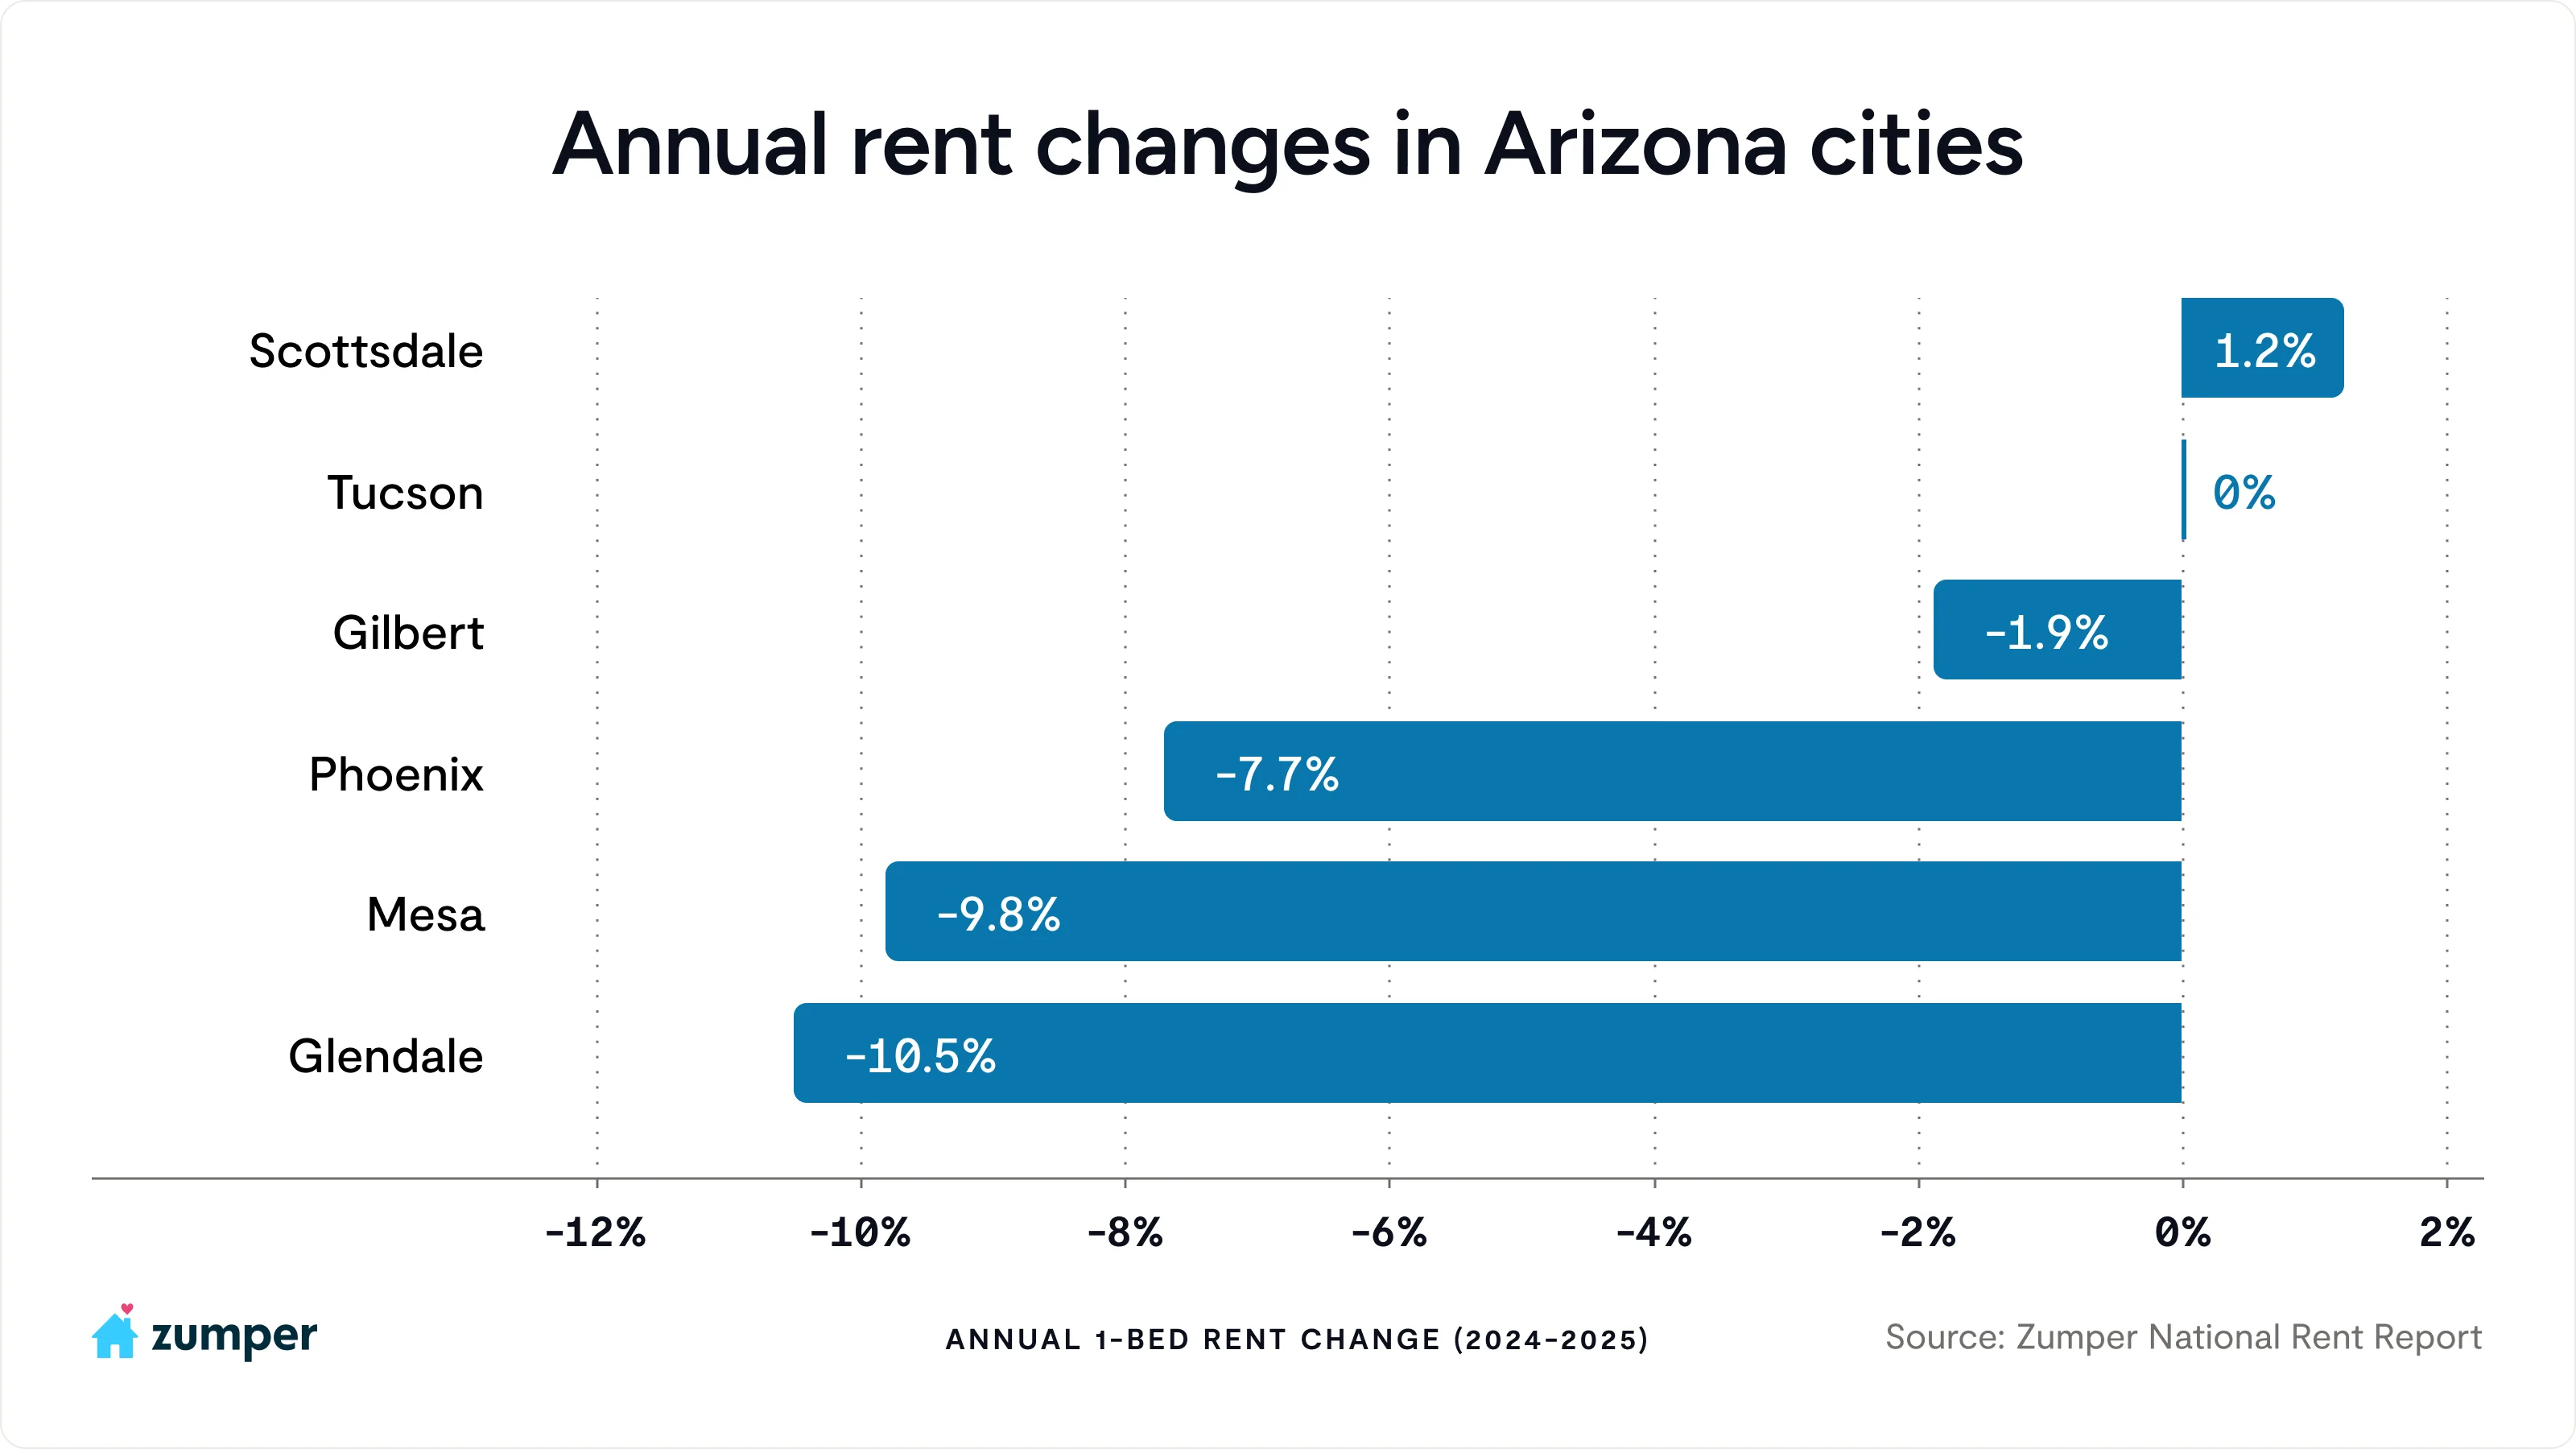
- Record supply levels are driving deep rent cuts across Arizona markets with Phoenix, Glendale, and Mesa rents down 7-10% since this time last year.
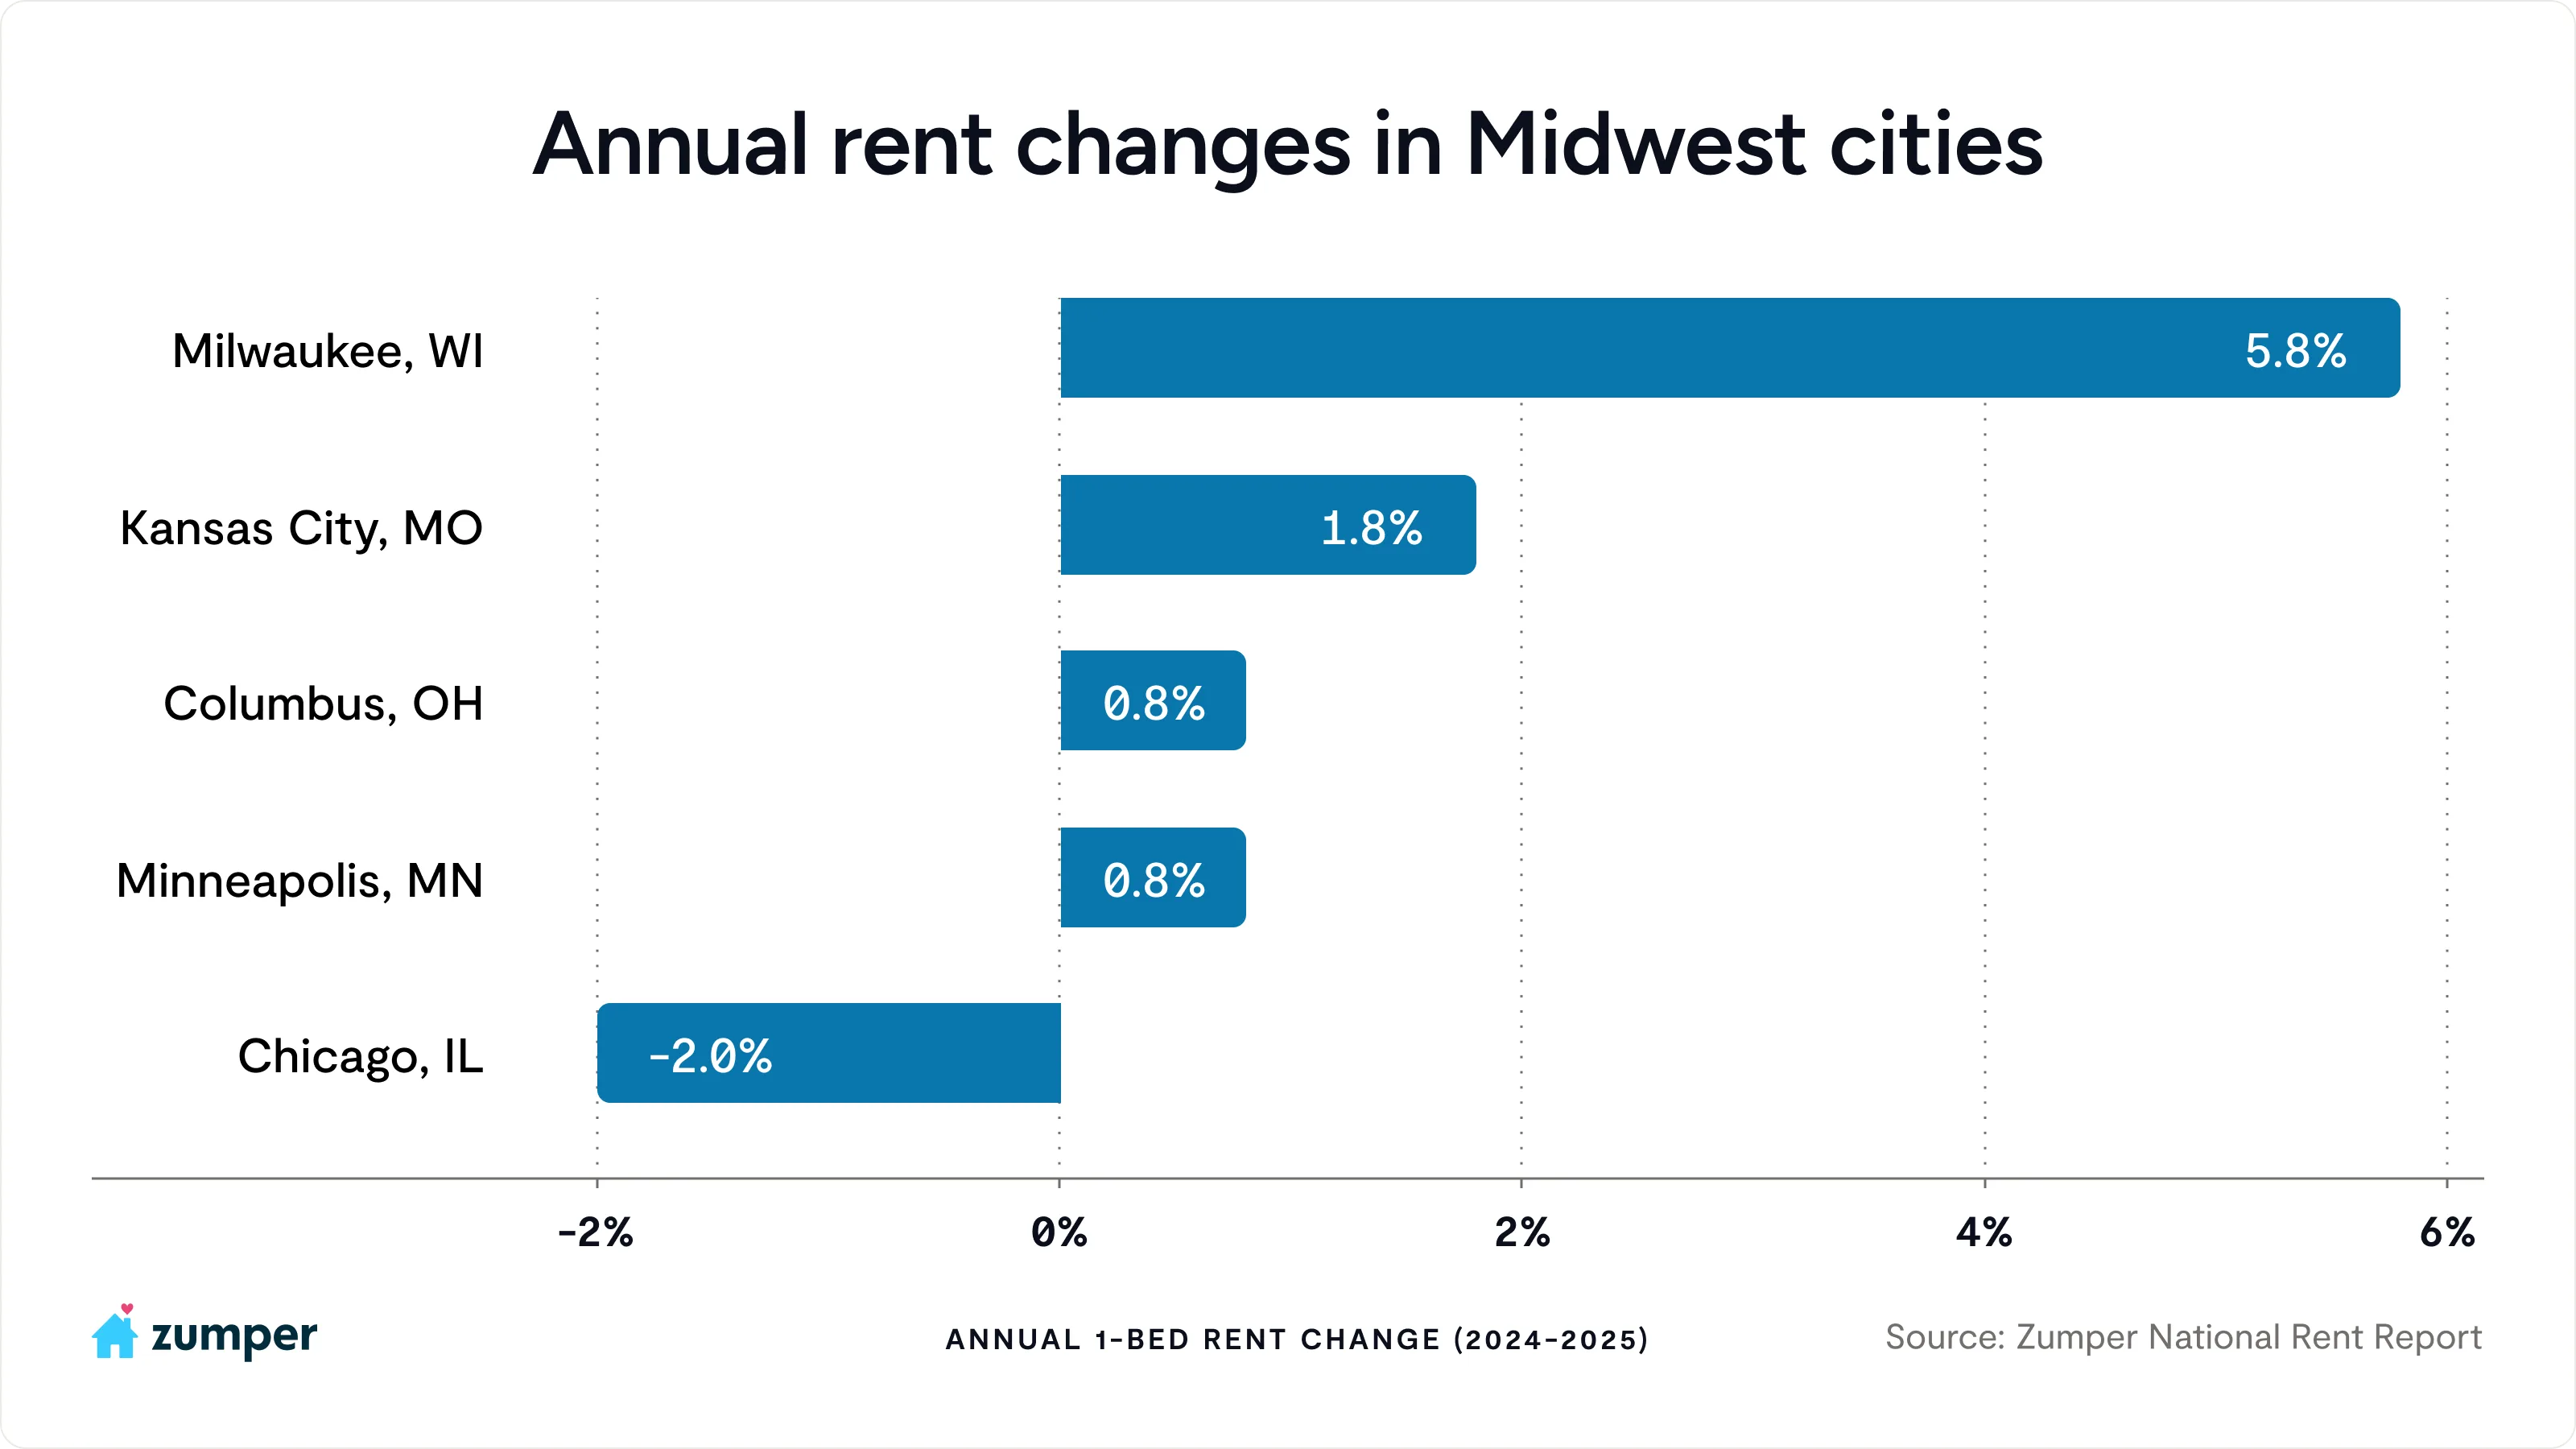
- Midwest cities demonstrate resiliency with flat to modestly growing rents amid broader national volatility.

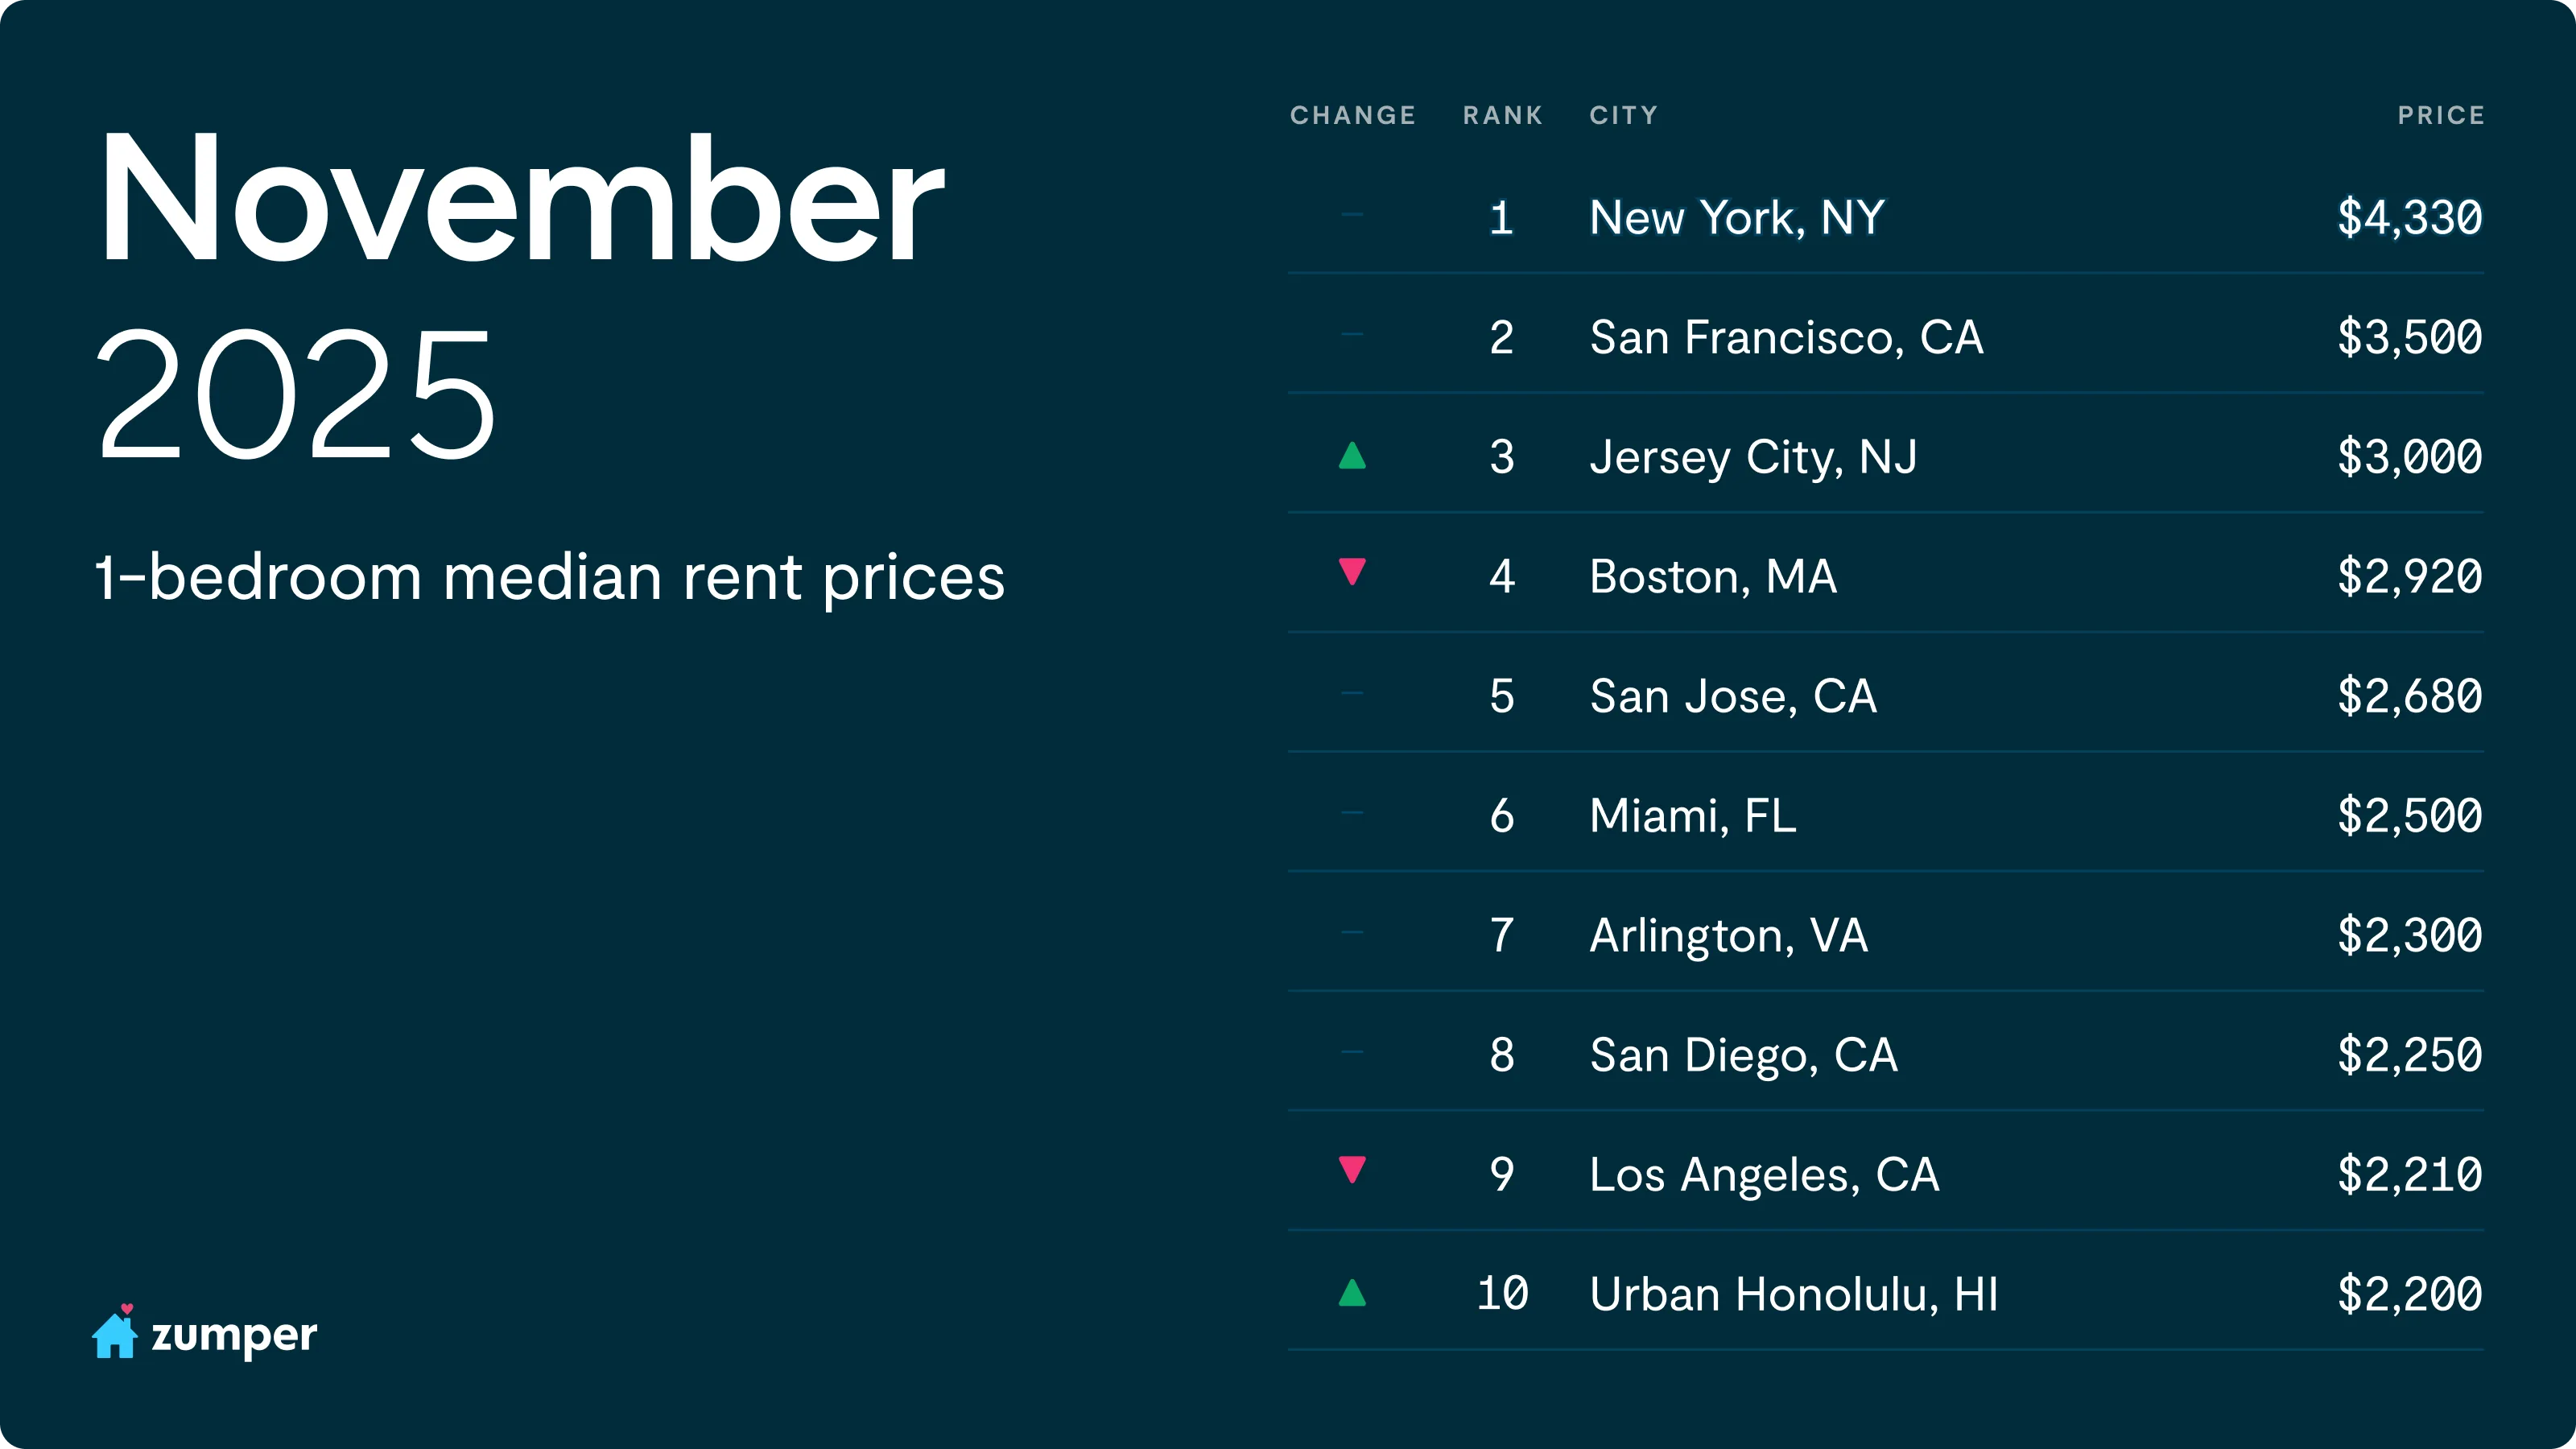
San Francisco remains the fastest-growing rental market in the U.S., and notably the only city in the top 10 to post double-digit annual gains, with one-bedroom rent up 15.9% annually and two-bedrooms up 14.8%.
D.C. rent slid sharply in November, pushing the city out of the top 10 rankings, as one-bedroom rent fell 5.7% year-over-year, one of the steepest declines among major coastal markets. The city had already been modestly cooling following the DOGE cutbacks, and the recent government shutdown added another headwind to a supply-demand dynamic that was already weakening earlier in the year. Neighboring Arlington wasn’t immune either, with one-bedroom rent down 2.1% annually, reflecting broader downward pressure across the D.C. metro area.
National one-bedroom rent records largest annual decline

U.S. rent prices continued to soften in November as the rental market works through historic supply levels and moderating demand. According to Zumper’s National Rent Index, the median one-bedroom rent fell 0.7% month-over-month to $1,501, while two-bedrooms dipped 0.4% to $1,880. On an annual basis, rents are down 2.2% for one-bedrooms, the largest annual drop ever recorded in our National Rent Index, and 1.2% for two-bedrooms. This report marks the fifth consecutive month where national rents have been flat or declining across the board.
“Our National Rent Index shows one-bedroom rent down more than 2% year-over-year, the steepest decline we’ve recorded since we started tracking national rent data,” said Anthemos Georgiades, CEO of Zumper. “It’s a clear signal that the cooling we’re seeing isn’t just seasonal. This pattern is playing out across most of the country, with only a few outliers, like San Francisco, moving in the opposite direction. It reflects a two-tiered economy and rental landscape: many markets are slowing under softer labor conditions, while a small number of high-wage hubs continue to accelerate.”
A convergence of broader economic pressures is reshaping rental demand in meaningful ways. A softening labor market and weakened consumer confidence are dampening move activity and slowing new leasing traffic. At the same time, persistent inflation continues to cloud financial decision-making for both renters and property owners. On the supply side, construction starts are steadily declining, signaling that today’s elevated inventory pipeline will taper significantly by late 2026. And with rents easing while mortgage rates remain high, many would-be first-time buyers are opting to stay in the rental market longer, adding yet another layer to shifting demand dynamics.
If labor market softness and low sentiment continue, the typical spring rent rebound may be muted or delayed into later in the year. However, if employment stabilizes and confidence improves, the market could see a sharper-than-usual seasonal re-acceleration as sidelined renters return and pent-up demand is released.
To see how Zumper’s national rent data provides insights to where the CPI is heading, please go to our blog post: https://www.zumper.com/blog/zumper-consumer-price-index/
Record supply levels drive deep rent cuts across Arizona markets

Arizona’s rental markets continue to absorb one of the strongest supply waves in the country. Phoenix alone added more than 27,000 new rental units annually this summer, putting intense downward pressure on pricing that is still unfolding today. Scottsdale has emerged as an early stabilizer, with annual rent inching upward at 1.2%. Phoenix, Mesa, and Glendale continue to see the steepest rent corrections, all down between 7-10% year-over-year, reflecting how deeply the supply shock permeated in these markets. Tucson and Gilbert show relative stability, landing closer to flat year-over-year trends. The depth of Arizona’s supply wave suggests its recovery will lag national norms, but stabilization in Scottsdale may hint at the first signs of the bottom.
Many Midwest cities remain resilient amid broader national volatility

The Midwest remains one of the most stable and resilient regions in the country. With an occupancy rate of 96.4%, second only to the Northeast, this area continues to benefit from steady demand and far less exposure to the extreme supply waves reshaping other regions like the Sun Belt or Mountain states. Rent trends have generally held flat to modestly positive across much of the Midwest, with cities like Kansas City, Columbus, and Minneapolis posting slight annual increases. Even markets experiencing minor declines, like Chicago, remain comparatively stable amid broader national volatility. And pockets of outperformance stand out: Milwaukee’s 5.8% annual rent growth reflects tight vacancy, durable renter demand, and continued migration into the greater Great Lakes region. Overall, the Midwest’s slow-and-steady profile continues to position it as one of the most predictable segments of the U.S. rental landscape.

