


Notable Trends
- The Zumper National Rent Index showed the median one-bedroom rent fell 0.1% year-over-year to $1,515, while two-bedroom rent increased 0.5% to $1,907.
- San Francisco one-bedroom rent is up 25.7% year-over-year to $4,300, now just $200 behind New York City’s $4,500, the tightest the gap has been since February 2022.
- Nashville and Memphis experienced some of the steepest one-bedroom declines outside of Texas, both down 10.1% year-over-year.
- Austin, Houston, and Dallas remain three of the five largest annual decliners nationwide.
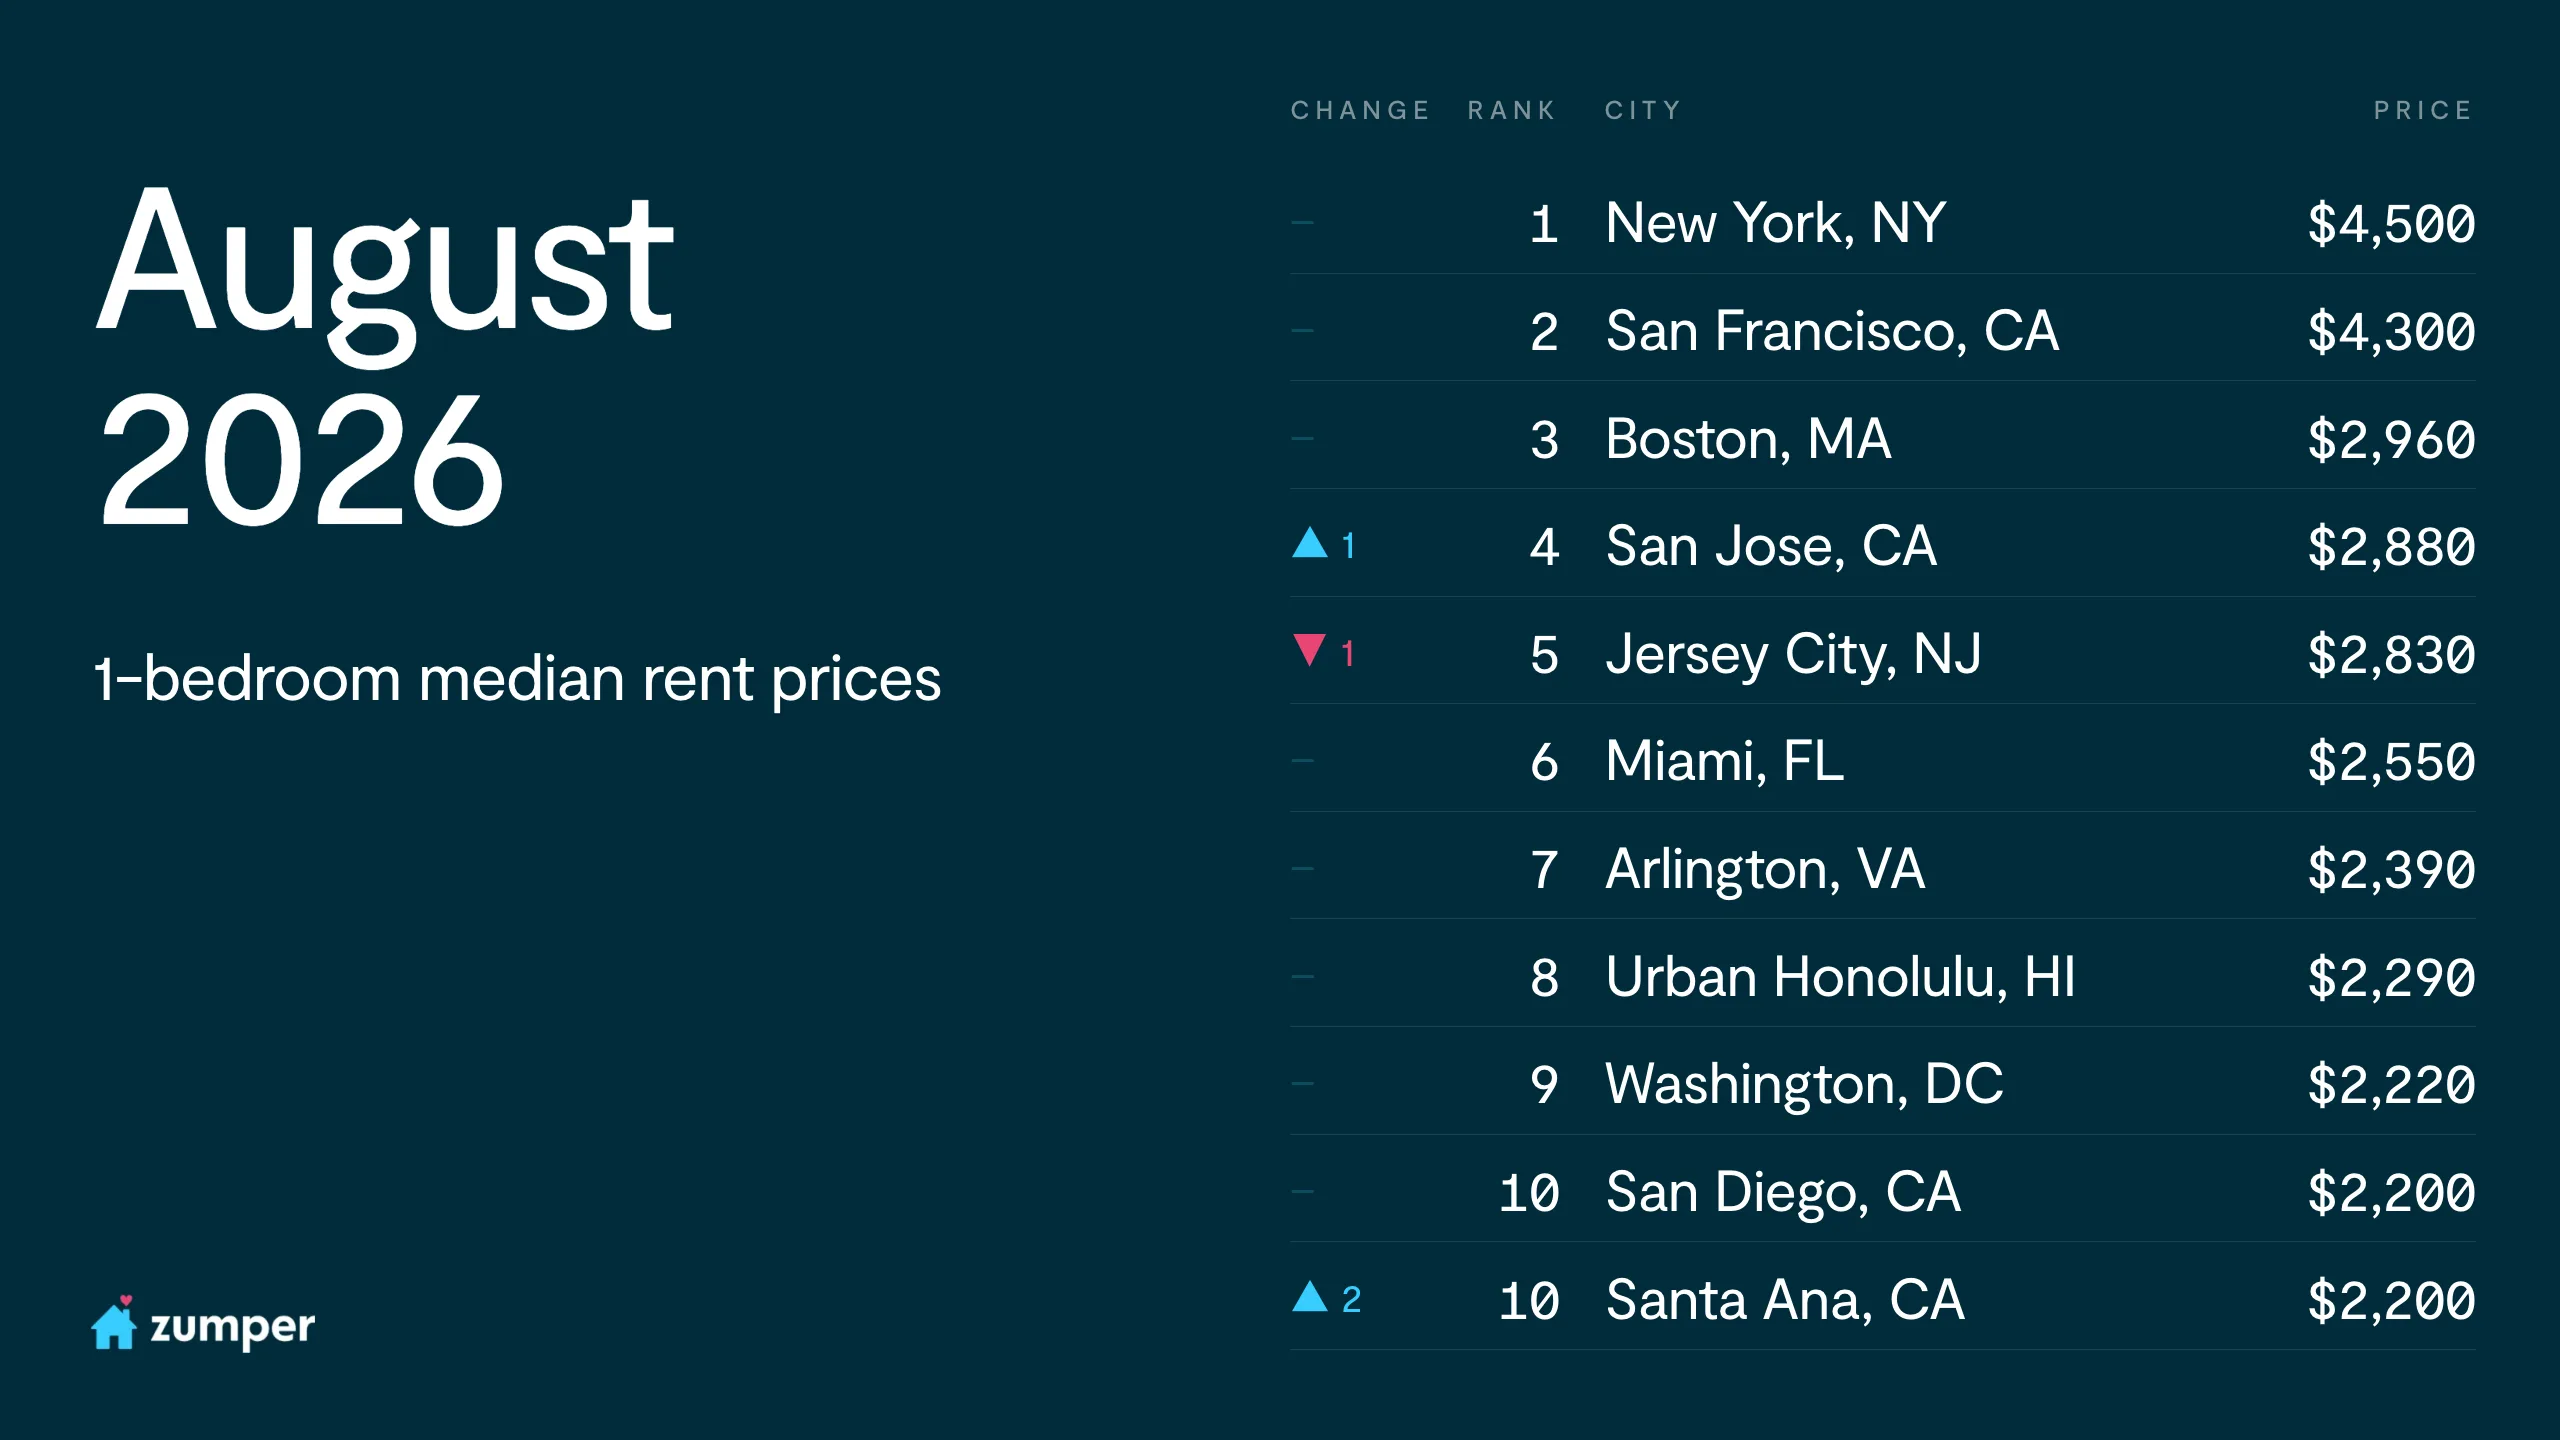
At the top of the rankings, San Jose passed Jersey City to take over the 4th spot for one-bedrooms this month, while Jersey City slipped to 5th. Santa Ana also climbed into a tie for 10th with San Diego after a two-spot jump. New York City held on to the top spot at $4,500 for one-bedrooms, with San Francisco closing in fast at $4,300.
National rates build steady momentum
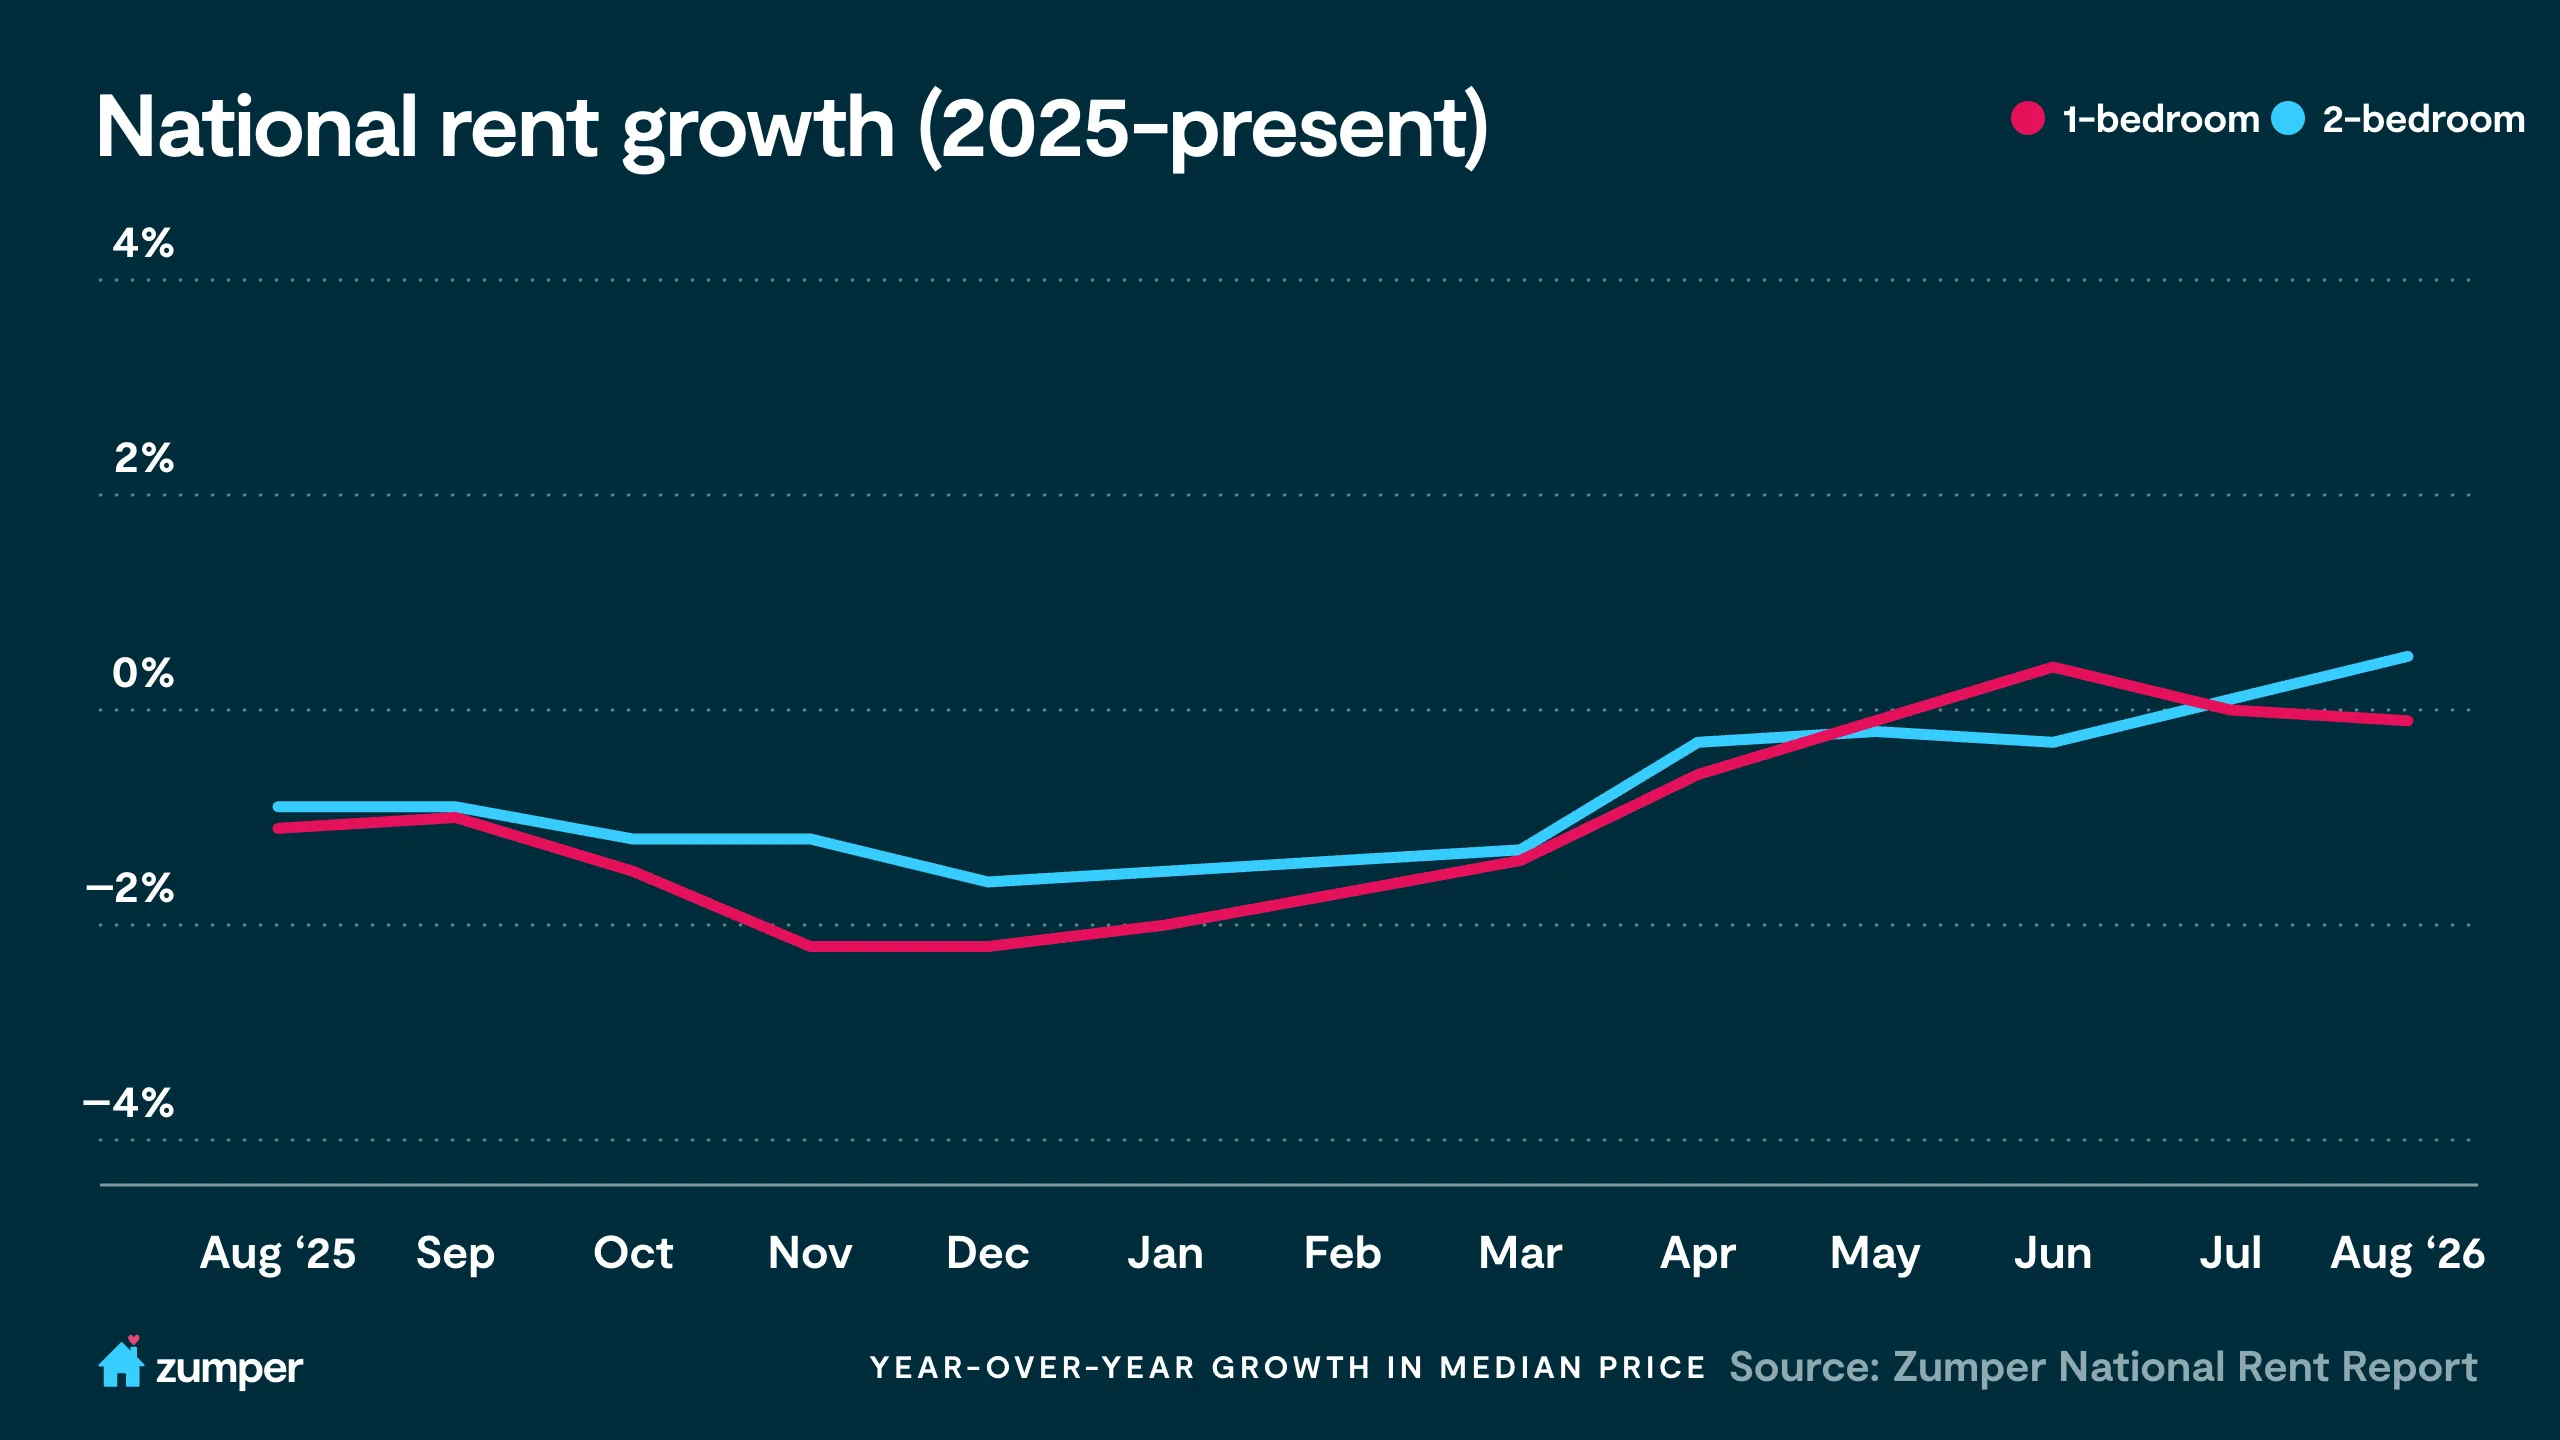
The Zumper National Rent Index showed the median one-bedroom rent fell 0.3% month-over-month to $1,515, while two-bedroom rent held roughly flat, up 0.01% to $1,907. On an annual basis, one-bedroom rent is now down 0.1%, slipping slightly back into negative territory after last month’s flat reading, while two-bedroom rent’s annual gain widened to 0.5% from 0.1% the month before, its sixth straight month of annual improvement.
“The national numbers are starting to look more constructive, but I still wouldn’t call this a broad recovery,” says Zumper CEO Shawn Mullahy. “Supply remains the dividing line. Markets that worked through their inventory are beginning to tighten, while places that absorbed enormous amounts of new construction are still giving renters meaningful leverage. What’s changed is that the supply wave is clearly receding. The question now is how quickly demand can absorb what’s left.”
U.S. apartment occupancy held at 95.5% in the second quarter of 2026, a second straight quarterly gain, as the nation absorbed more than 187,000 units, according to RealPage Market Analytics. New deliveries have now declined for six straight quarters since completions peaked in late 2024. However, about a quarter of apartments nationally were still offering concessions as of the second quarter, a sign that a lot of what got built during that peak is still filling up.
The latest CPI data shows that the shelter index remains one of the stickiest components of inflation. Zumper’s index offers an early signal into where the CPI may be headed. For a deeper look, read our full analysis: https://www.zumper.com/blog/zumper-consumer-price-index/
San Francisco rent is closing the gap on New York
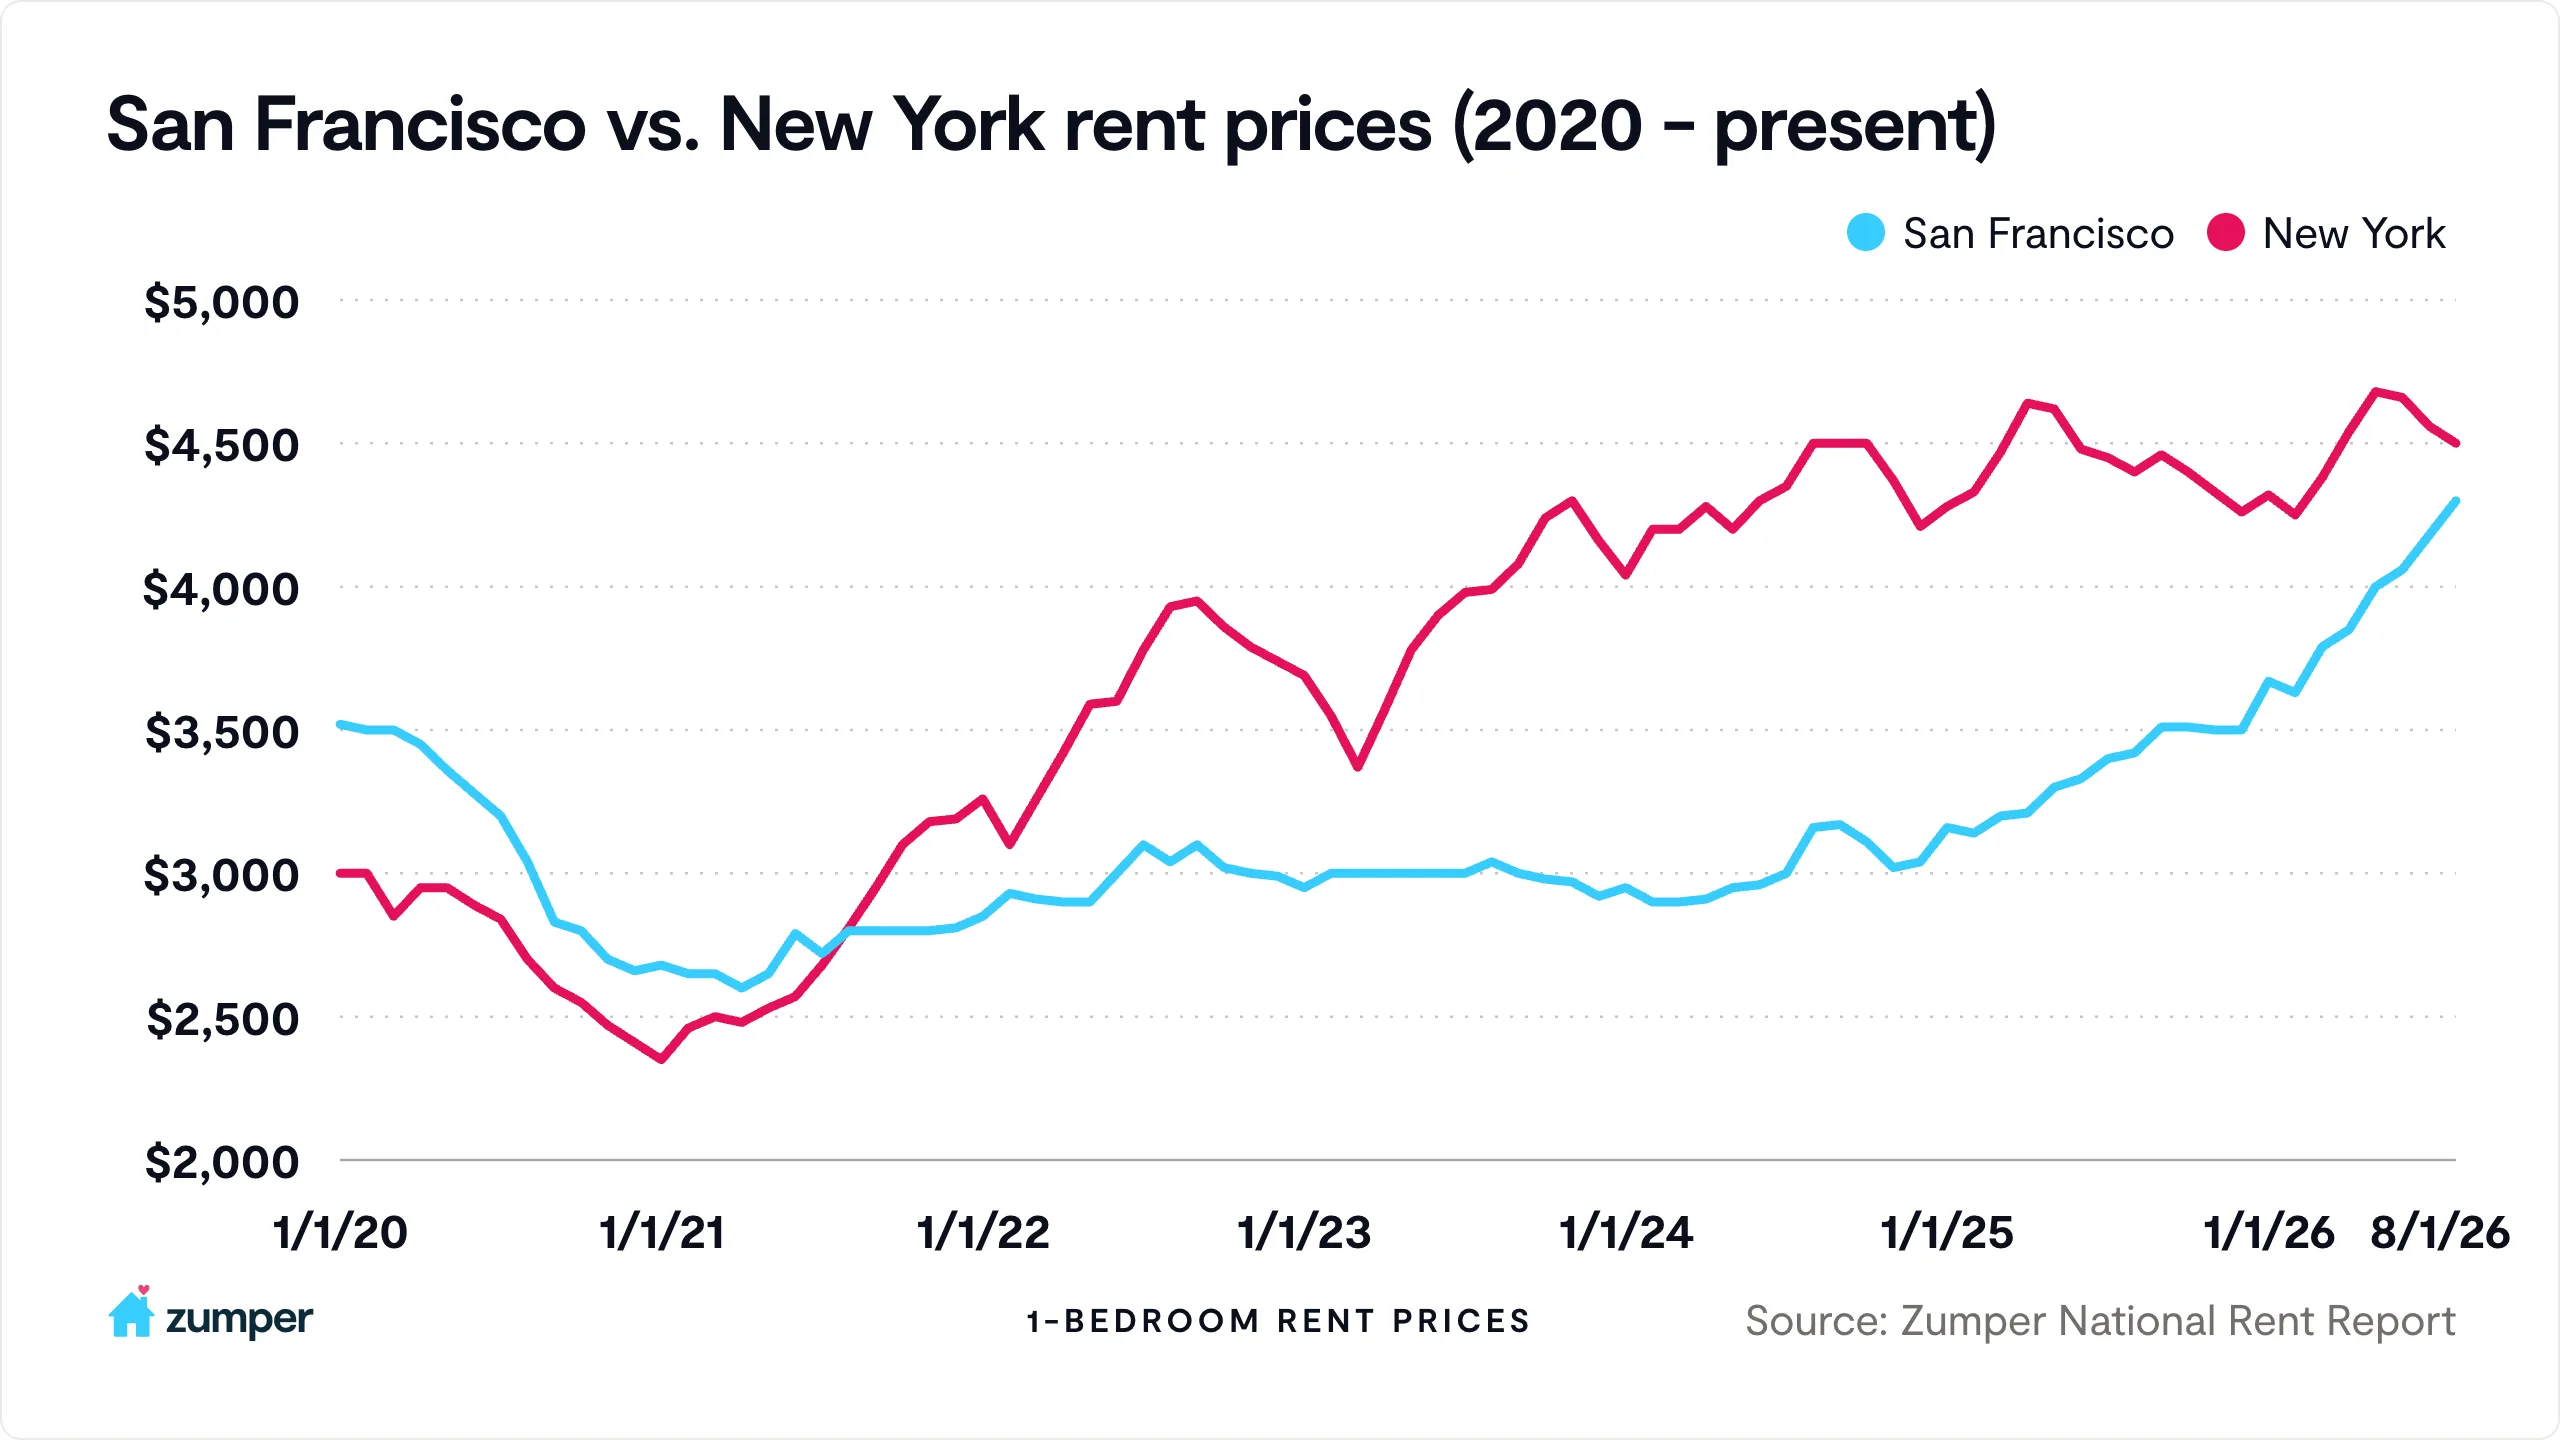
San Francisco keeps closing in on the national top spot, with one-bedroom rent hitting an all-time high, up 25.7% year-over-year to $4,300, now just $200 behind New York City’s $4,500, the narrowest the gap has been since February 2022. As recently as May of this year, New York held a $680 lead; that gap folded to $600 in June, $380 in July, and $200 this month.
The two cities’ trajectories make for a natural comparison as San Francisco held the national #1 spot for one-bedrooms for years before New York overtook it in August 2021. Five years later, San Francisco is closing back in on the crown it lost, though the story looks different by bedroom size. On two-bedrooms, San Francisco’s lead over New York has actually widened, from $570 in July to $710 in August, as San Francisco’s two-bedroom rent climbed to a record $6,120 while New York’s eased to $5,410.
Much of San Francisco’s run traces back to AI-driven hiring colliding with a construction pipeline that’s remained thin. Office vacancy in the city has fallen as AI companies lease up space. That same demand has spilled into the residential market: apartment vacancy has fallen to 3.7% citywide, the lowest level since 2019, leaving renters with unusually little room to negotiate.
New York’s side of the comparison looks different. Zumper’s own index shows New York easing slightly this month, but the market remains historically tight by other measures too. Manhattan’s rental vacancy rate, for example, was a mere 1.56% in July. The bigger difference may come down to a comeback effect. San Francisco’s rent collapsed early in the pandemic and only recently clawed back above its old peak, so this year’s AI-driven demand is landing on a lower year-ago base, which is a big part of why its annual growth rate looks so dramatic. New York’s rent never fell nearly as far and has stayed close to record territory since 2022; one-bedroom rent hit an all-time high as recently as May 2026, leaving less room for a comparable year-over-year jump even though prices remain just as high. That’s part of why San Francisco is closing the gap on price rather than New York opening one.
Nashville & Memphis rents down in the double digits
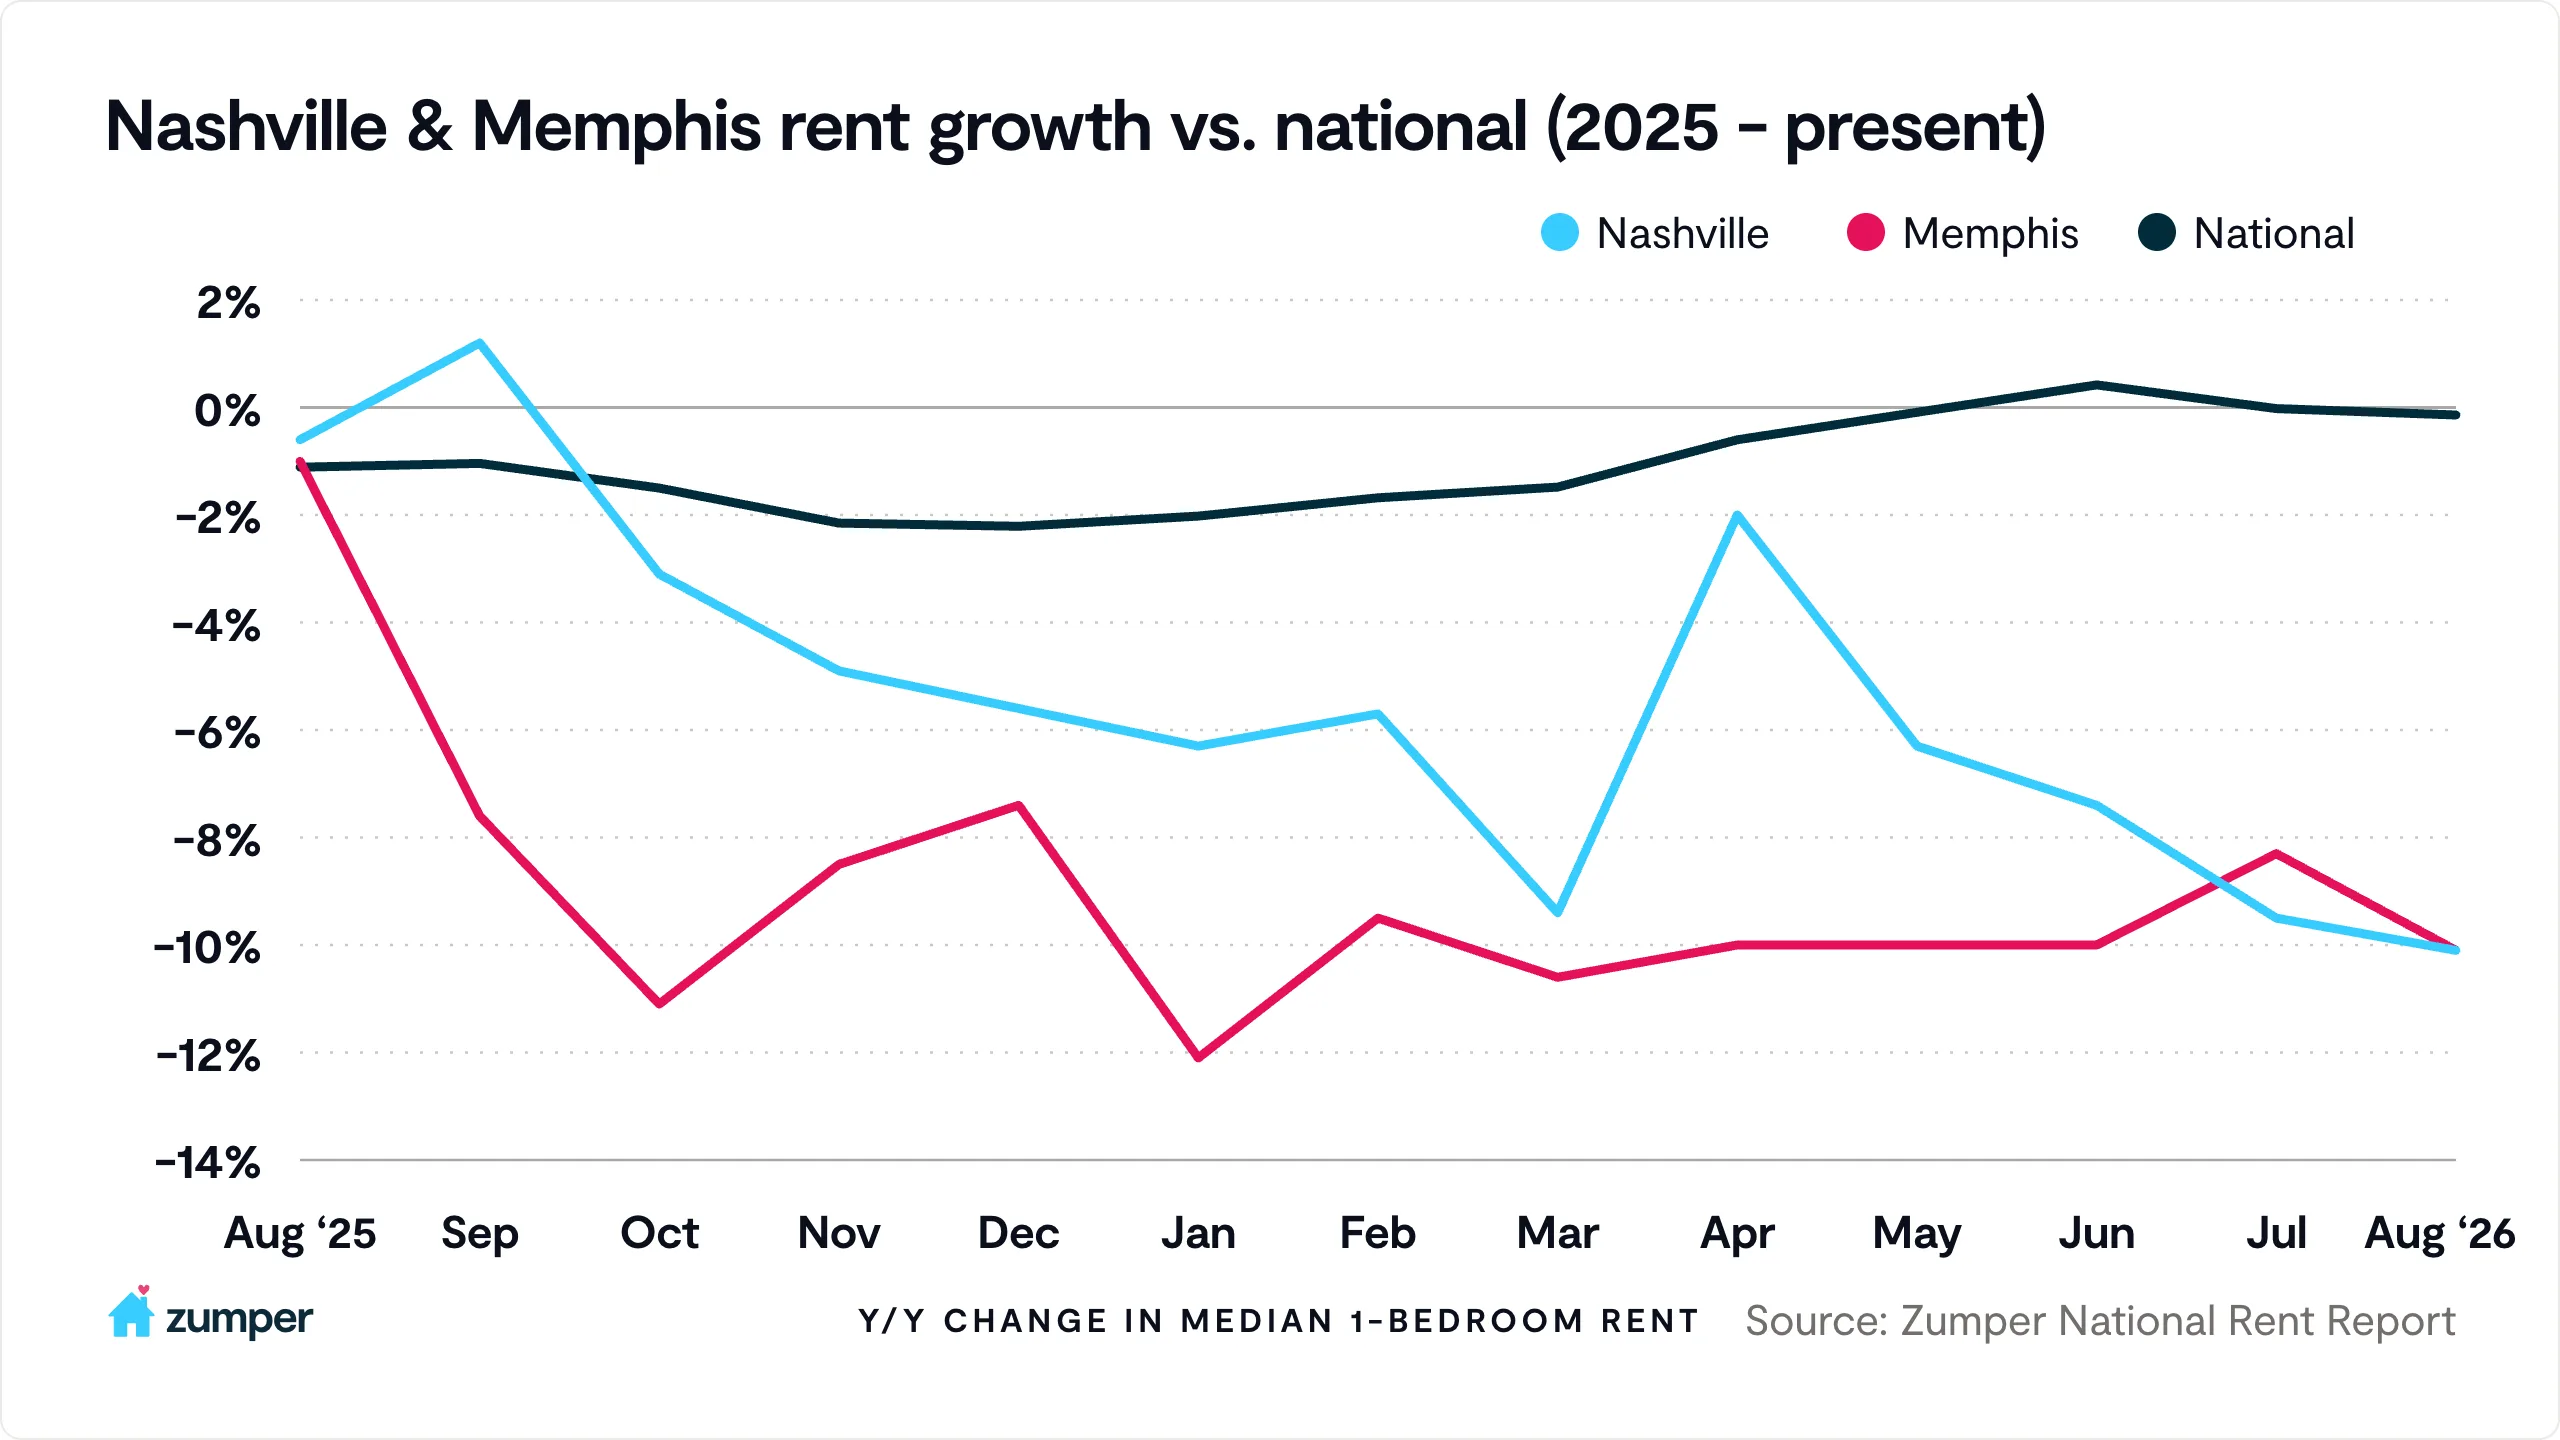
Nashville and Memphis had some of the largest annual rent declines in the country outside of Texas this month, with one-bedroom rents both down 10.1% year-over-year to medians of $1,520 and $890, respectively.
Both cities are working through the same dynamic playing out across much of the Sun Belt. A multi-year wave of new apartment construction that outpaced demand and is still being absorbed. Nashville alone has gained nearly 35,900 units since 2023, with deliveries peaking in 2024 and staying elevated in 2025. Memphis has moved through a slower-burning version of the same story, with elevated vacancy tied to construction added earlier in the decade. In both cities, renters are still benefiting from the choices that the supply wave created, even as new construction has begun to slow.
Texas markets lead the nation in annual rent declines
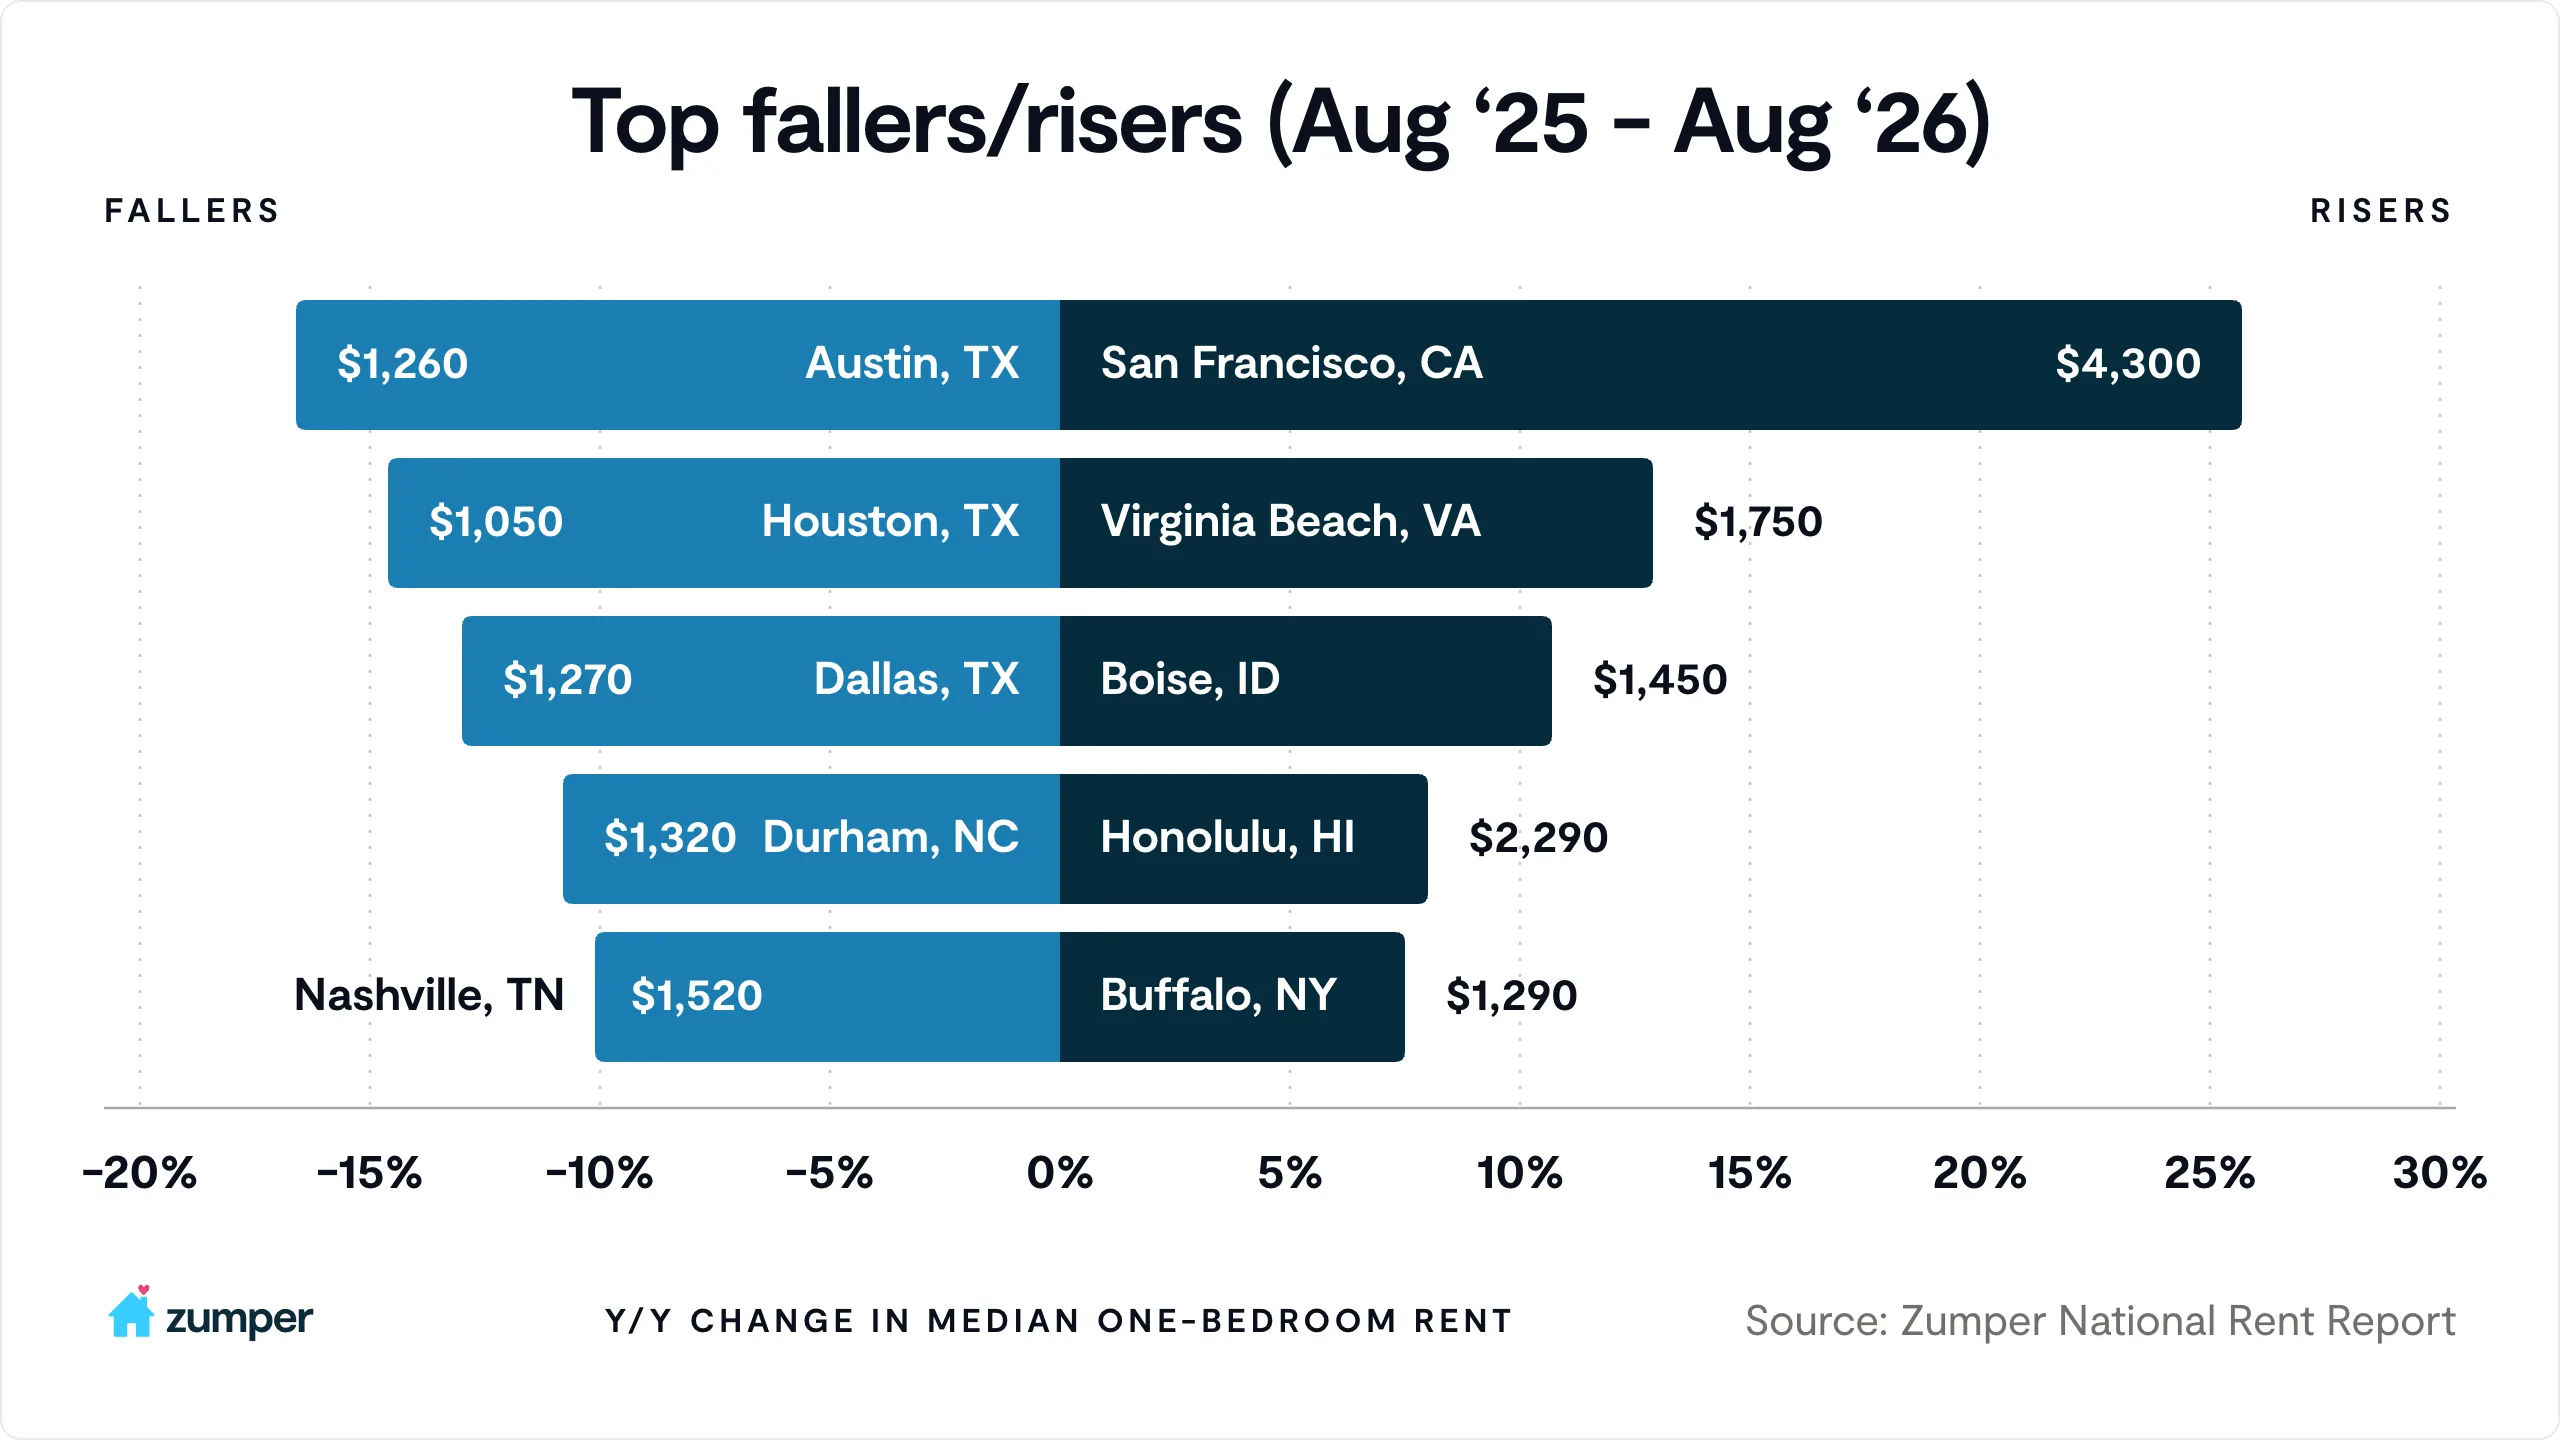
Texas is home to three of the nation’s five steepest one-bedroom declines this August. Austin leads the country outright, with one-bedroom rent down 16.6% year-over-year to $1,260. Houston follows at -14.6% to $1,050, and Dallas rounds out the trio at -13% to $1,270. The pattern lines up with the elevated multifamily supply these three markets absorbed through the boom years, which continues to give renters the upper hand.
Zumper CEO Shawn Mullahy says, “Texas is showing exactly what happens when supply materially outruns demand. Austin, Houston and Dallas added enormous amounts of inventory, and renters now have leverage because owners are competing to fill it. That won’t reverse until enough of that supply is absorbed.”
Words by