
Notable Trends
- Zumper’s National Rent Index shows the first monthly gains for both unit types since May 2025: the median one-bedroom rent increased 0.2% to $1,502 and two-bedrooms rose 0.1% to $1,880 this March.
- The first national monthly rent increases for both unit types in nearly a year signals a potential turning point, with even modest gains likely to reintroduce upward pressure on inflation given shelter’s outsized role in CPI.
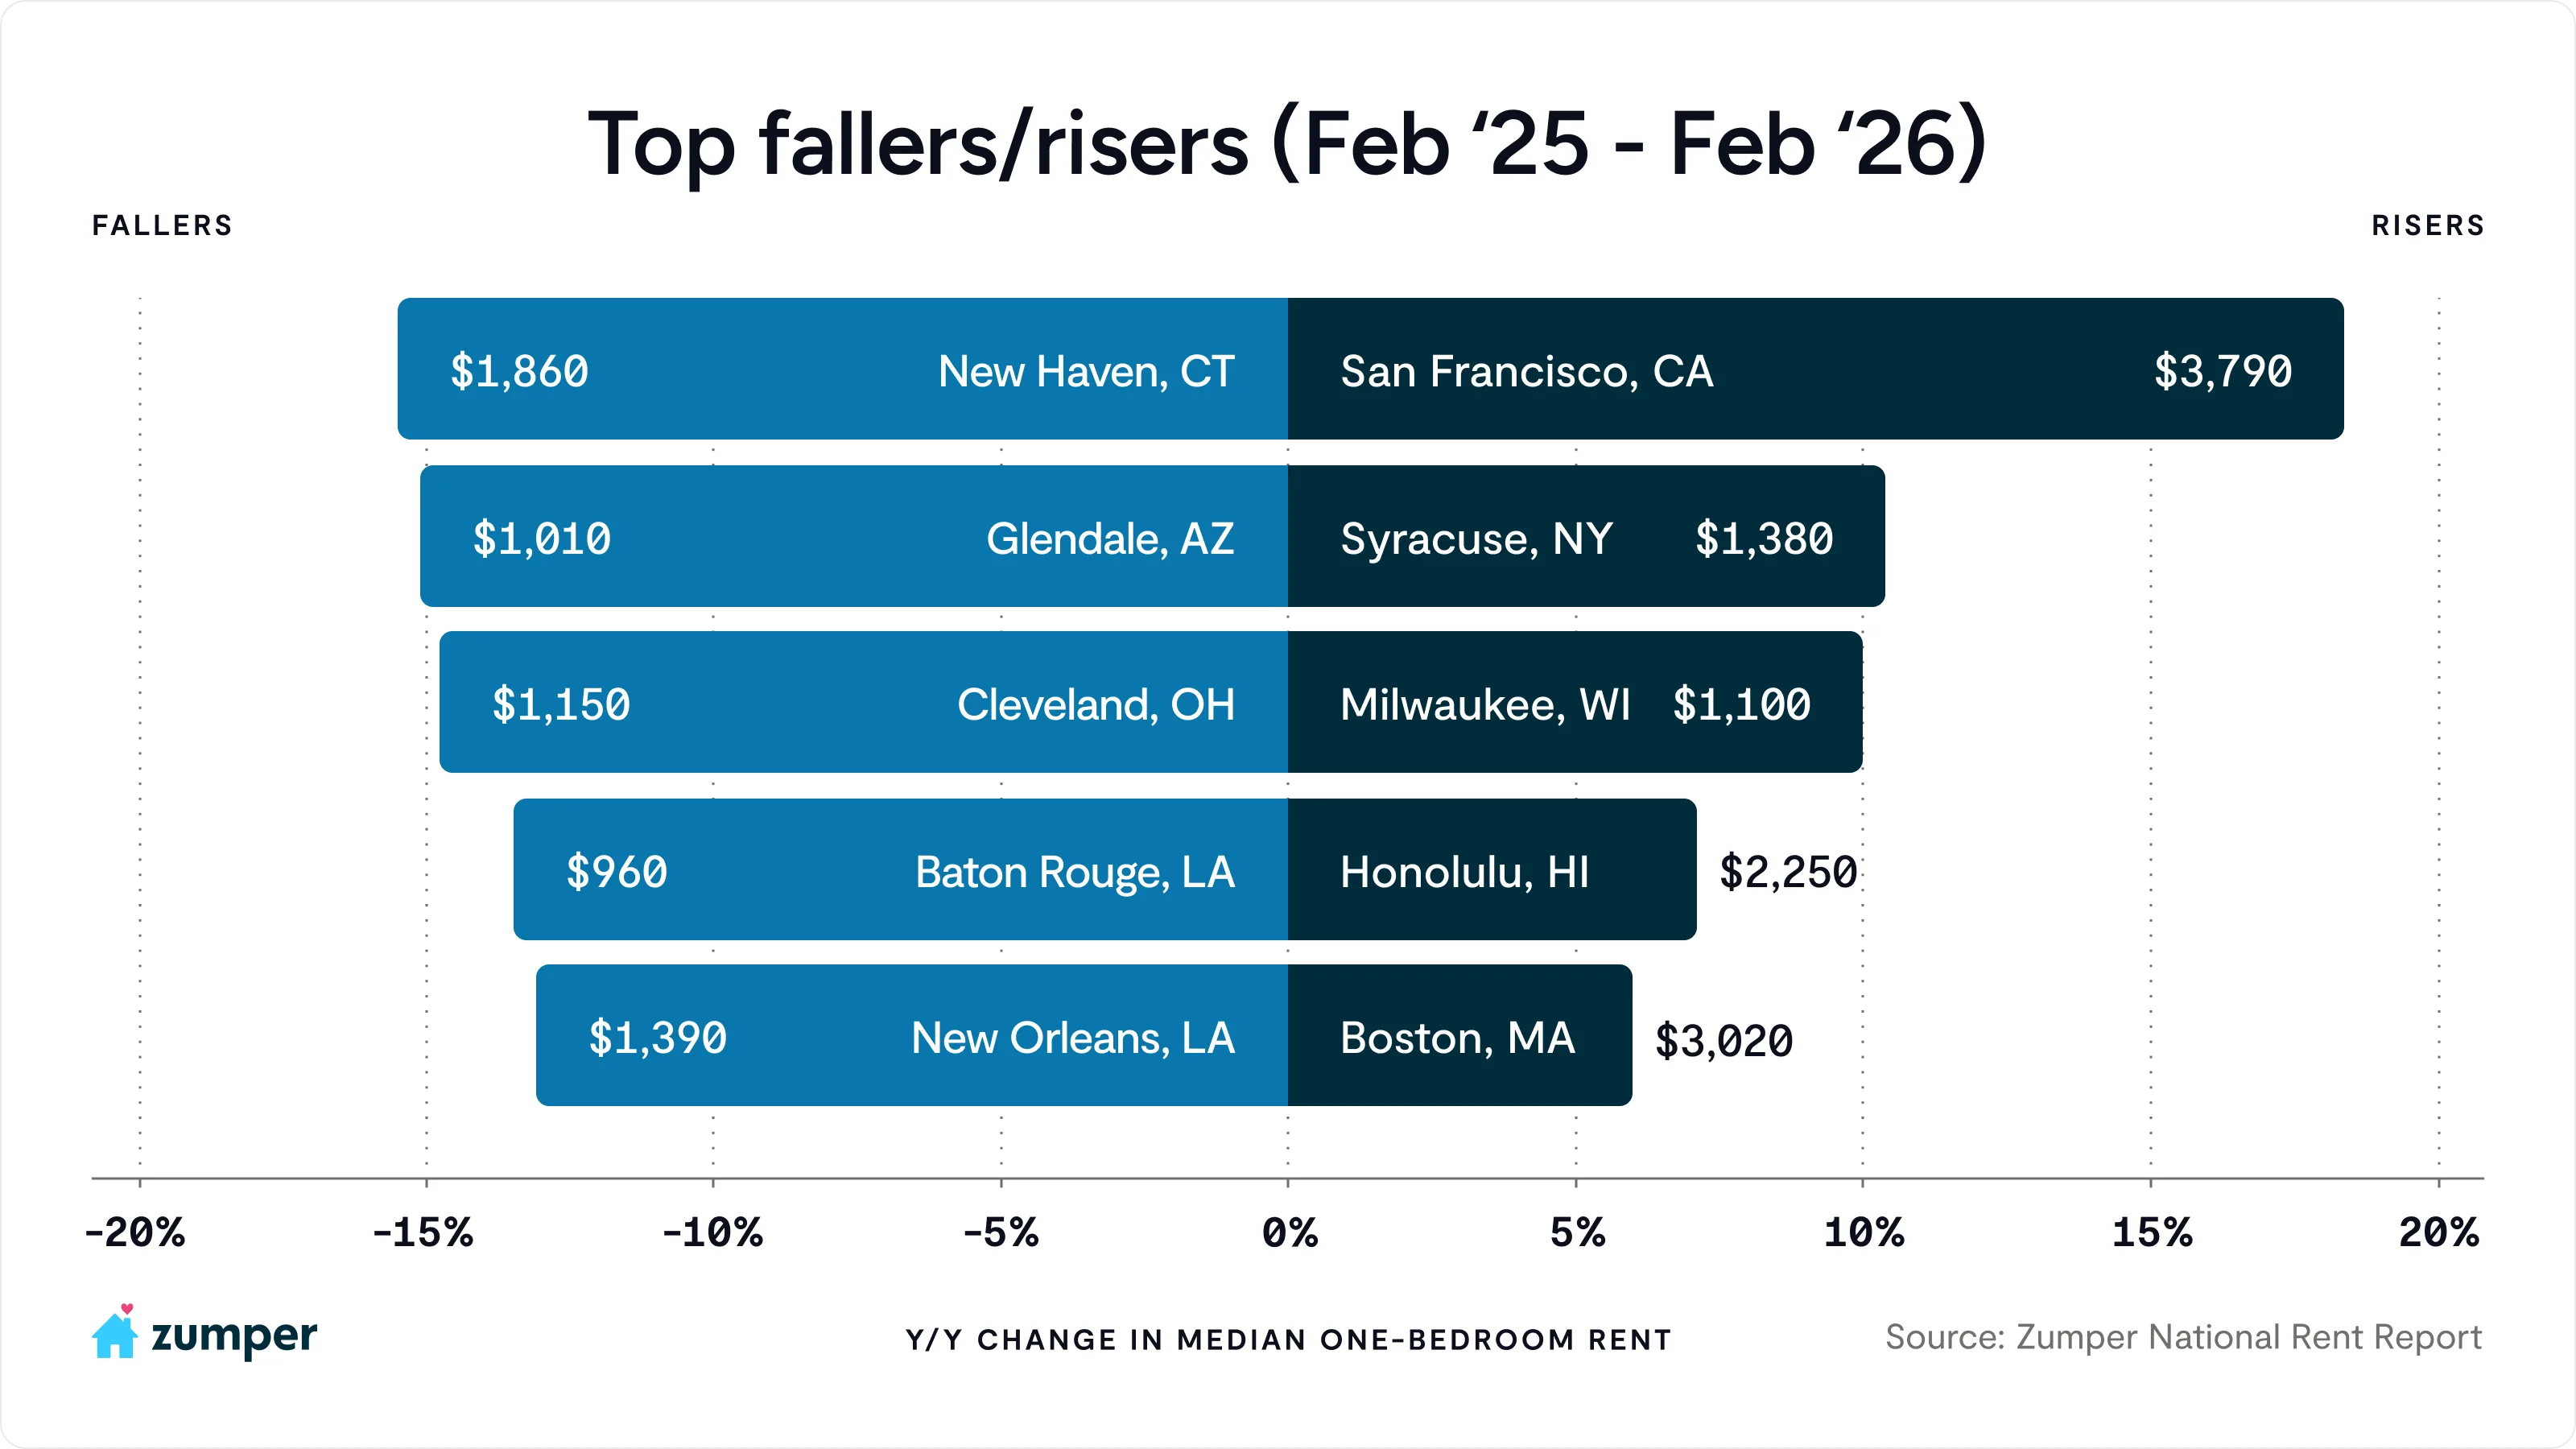
- San Francisco led the nation in annual rent growth, with both one and two-bedroom prices hitting new all-time highs: one-bedroom rent rose 18.4% to $3,790, and two-bedrooms jumped 22.6% to $5,270.
- All Florida markets in our report had either flat or declining annual rents as domestic migration cools in the state, while supply levels remain elevated.
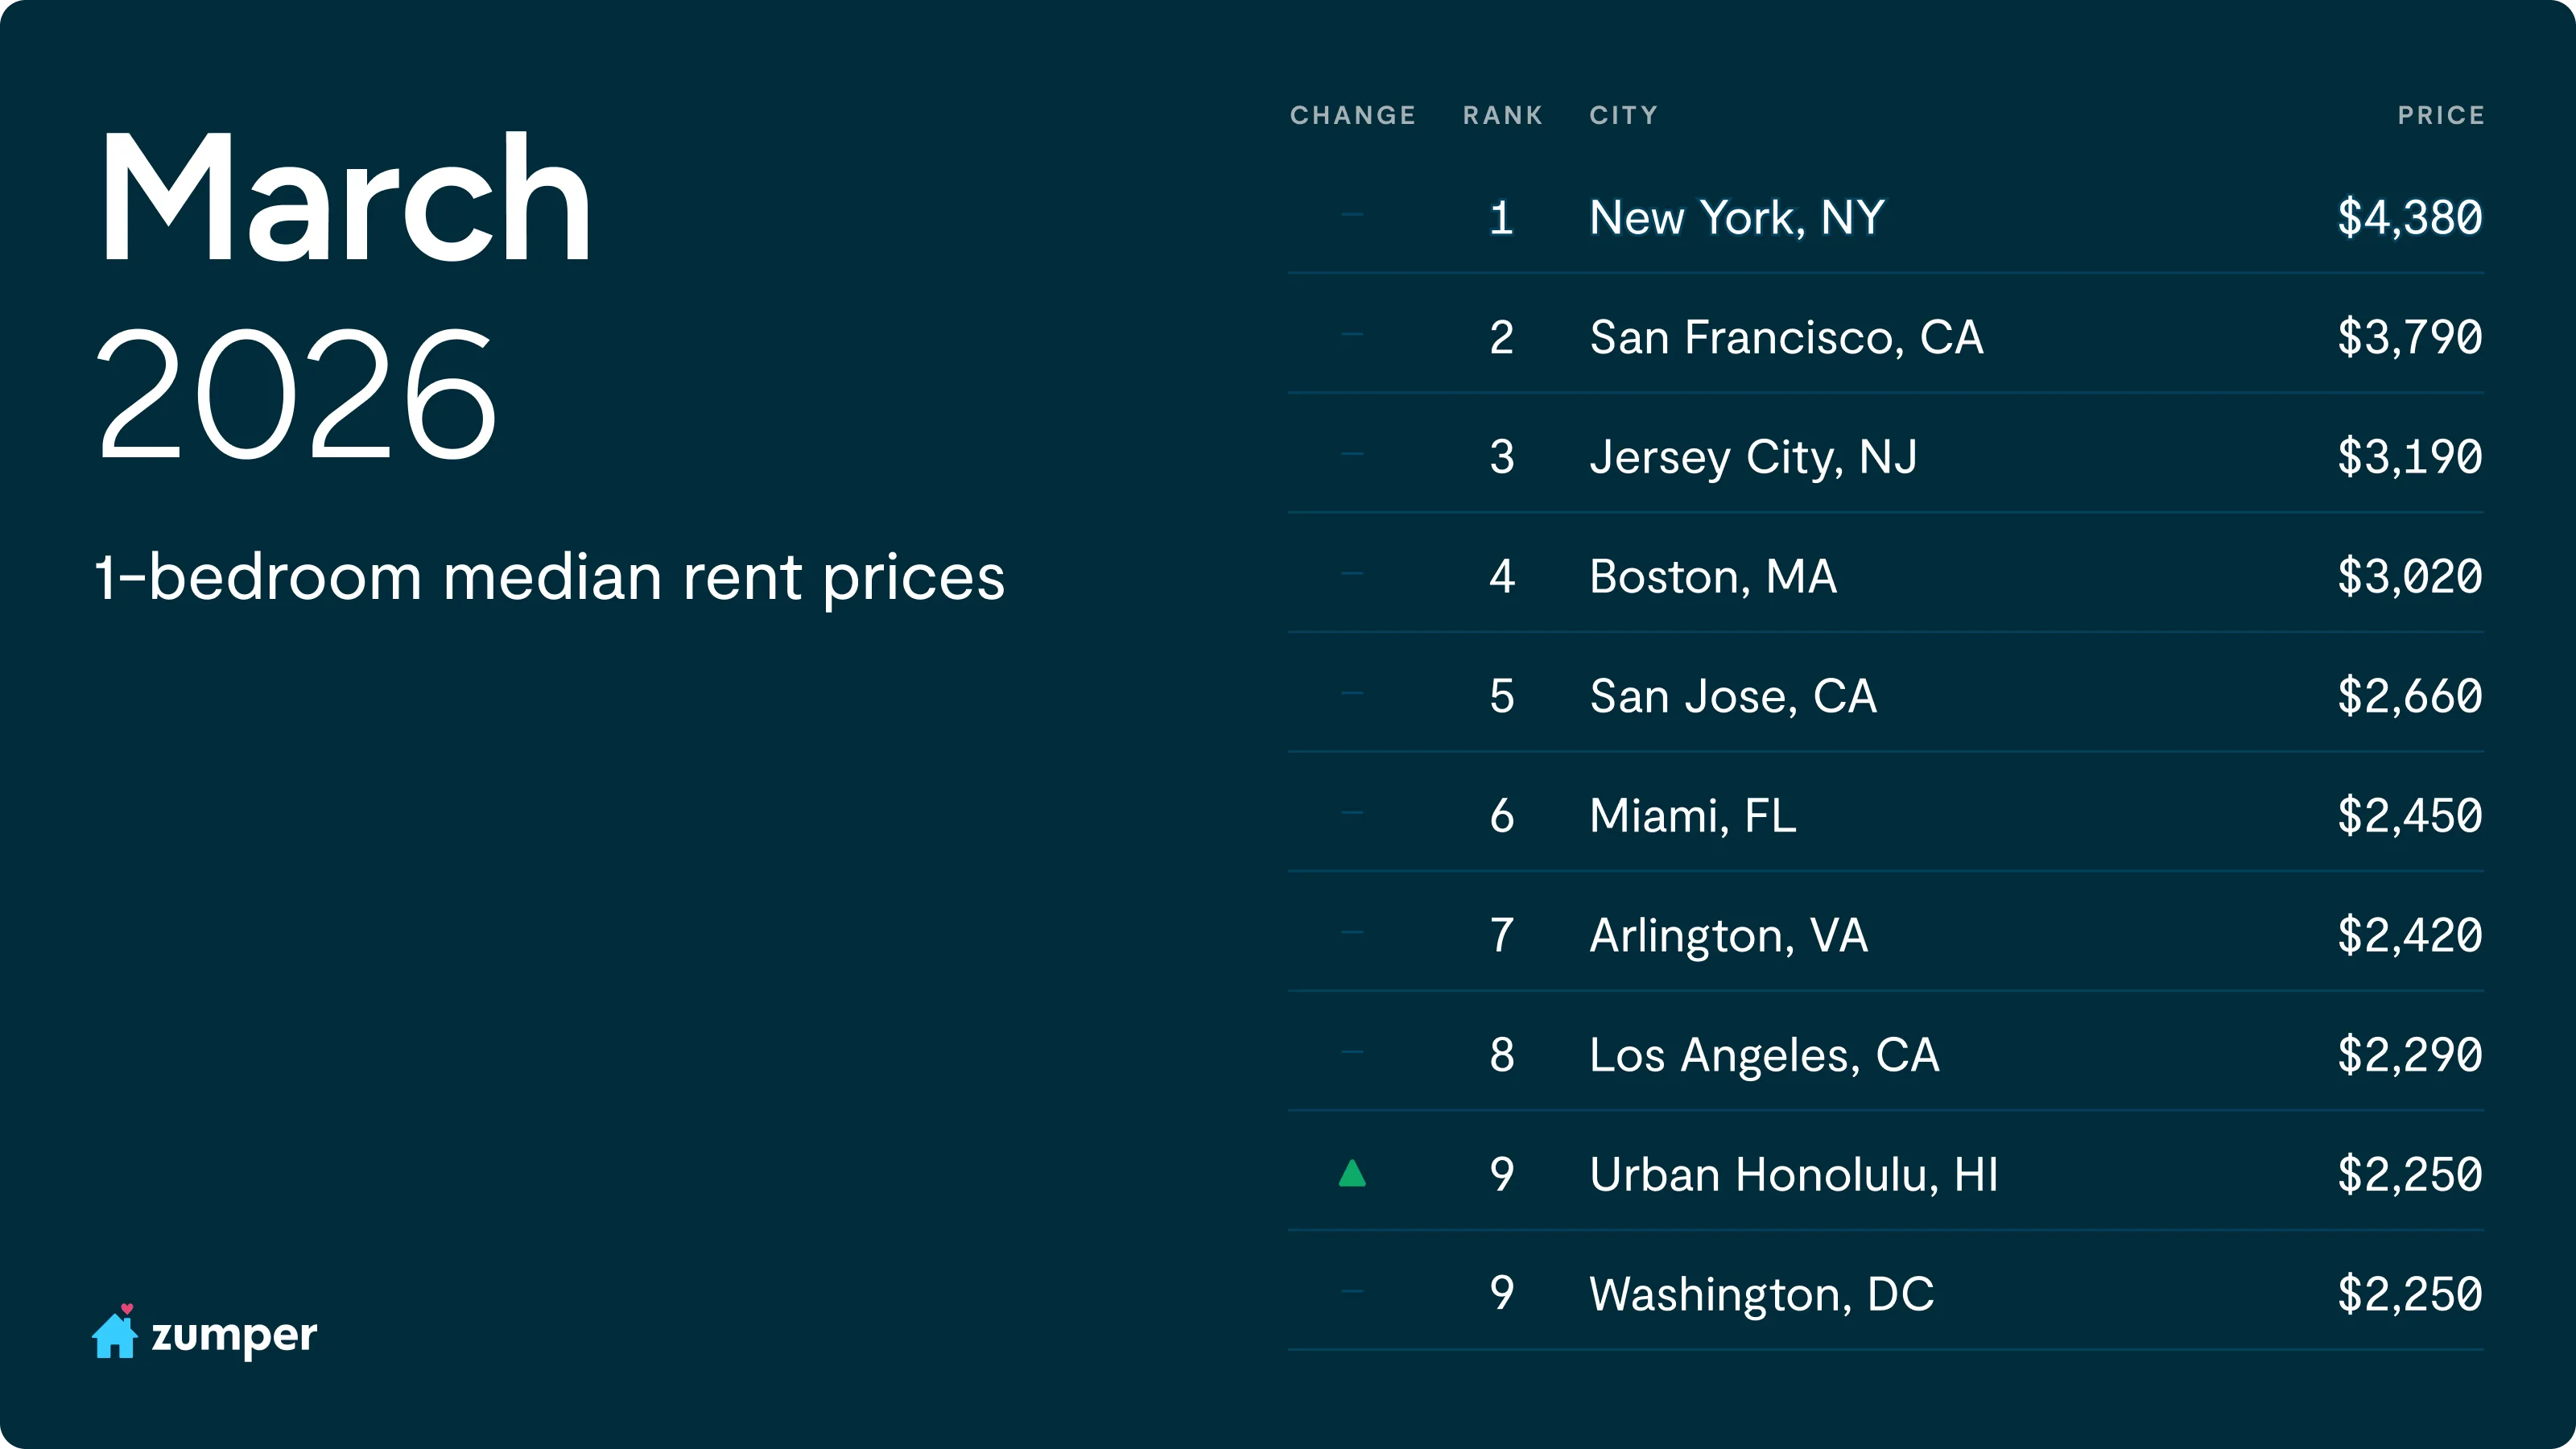
Despite a brief shift last month when San Francisco’s two-bedroom rent surpassed New York City’s, the nation’s largest rental market has quickly reclaimed that top spot with two-bedroom rent rising to $5,300 this March. San Francisco continues to stand out as the primary growth driver among high-cost markets as the only city in the top 10 to post double-digit annual rent growth. In contrast, most other top-tier markets are still experiencing year-over-year declines in one-bedroom rents. Elsewhere in the rankings, Honolulu climbed one position to tie with Washington, D.C., as the ninth most expensive market.
National rents post first monthly gains for both unit types since May 2025
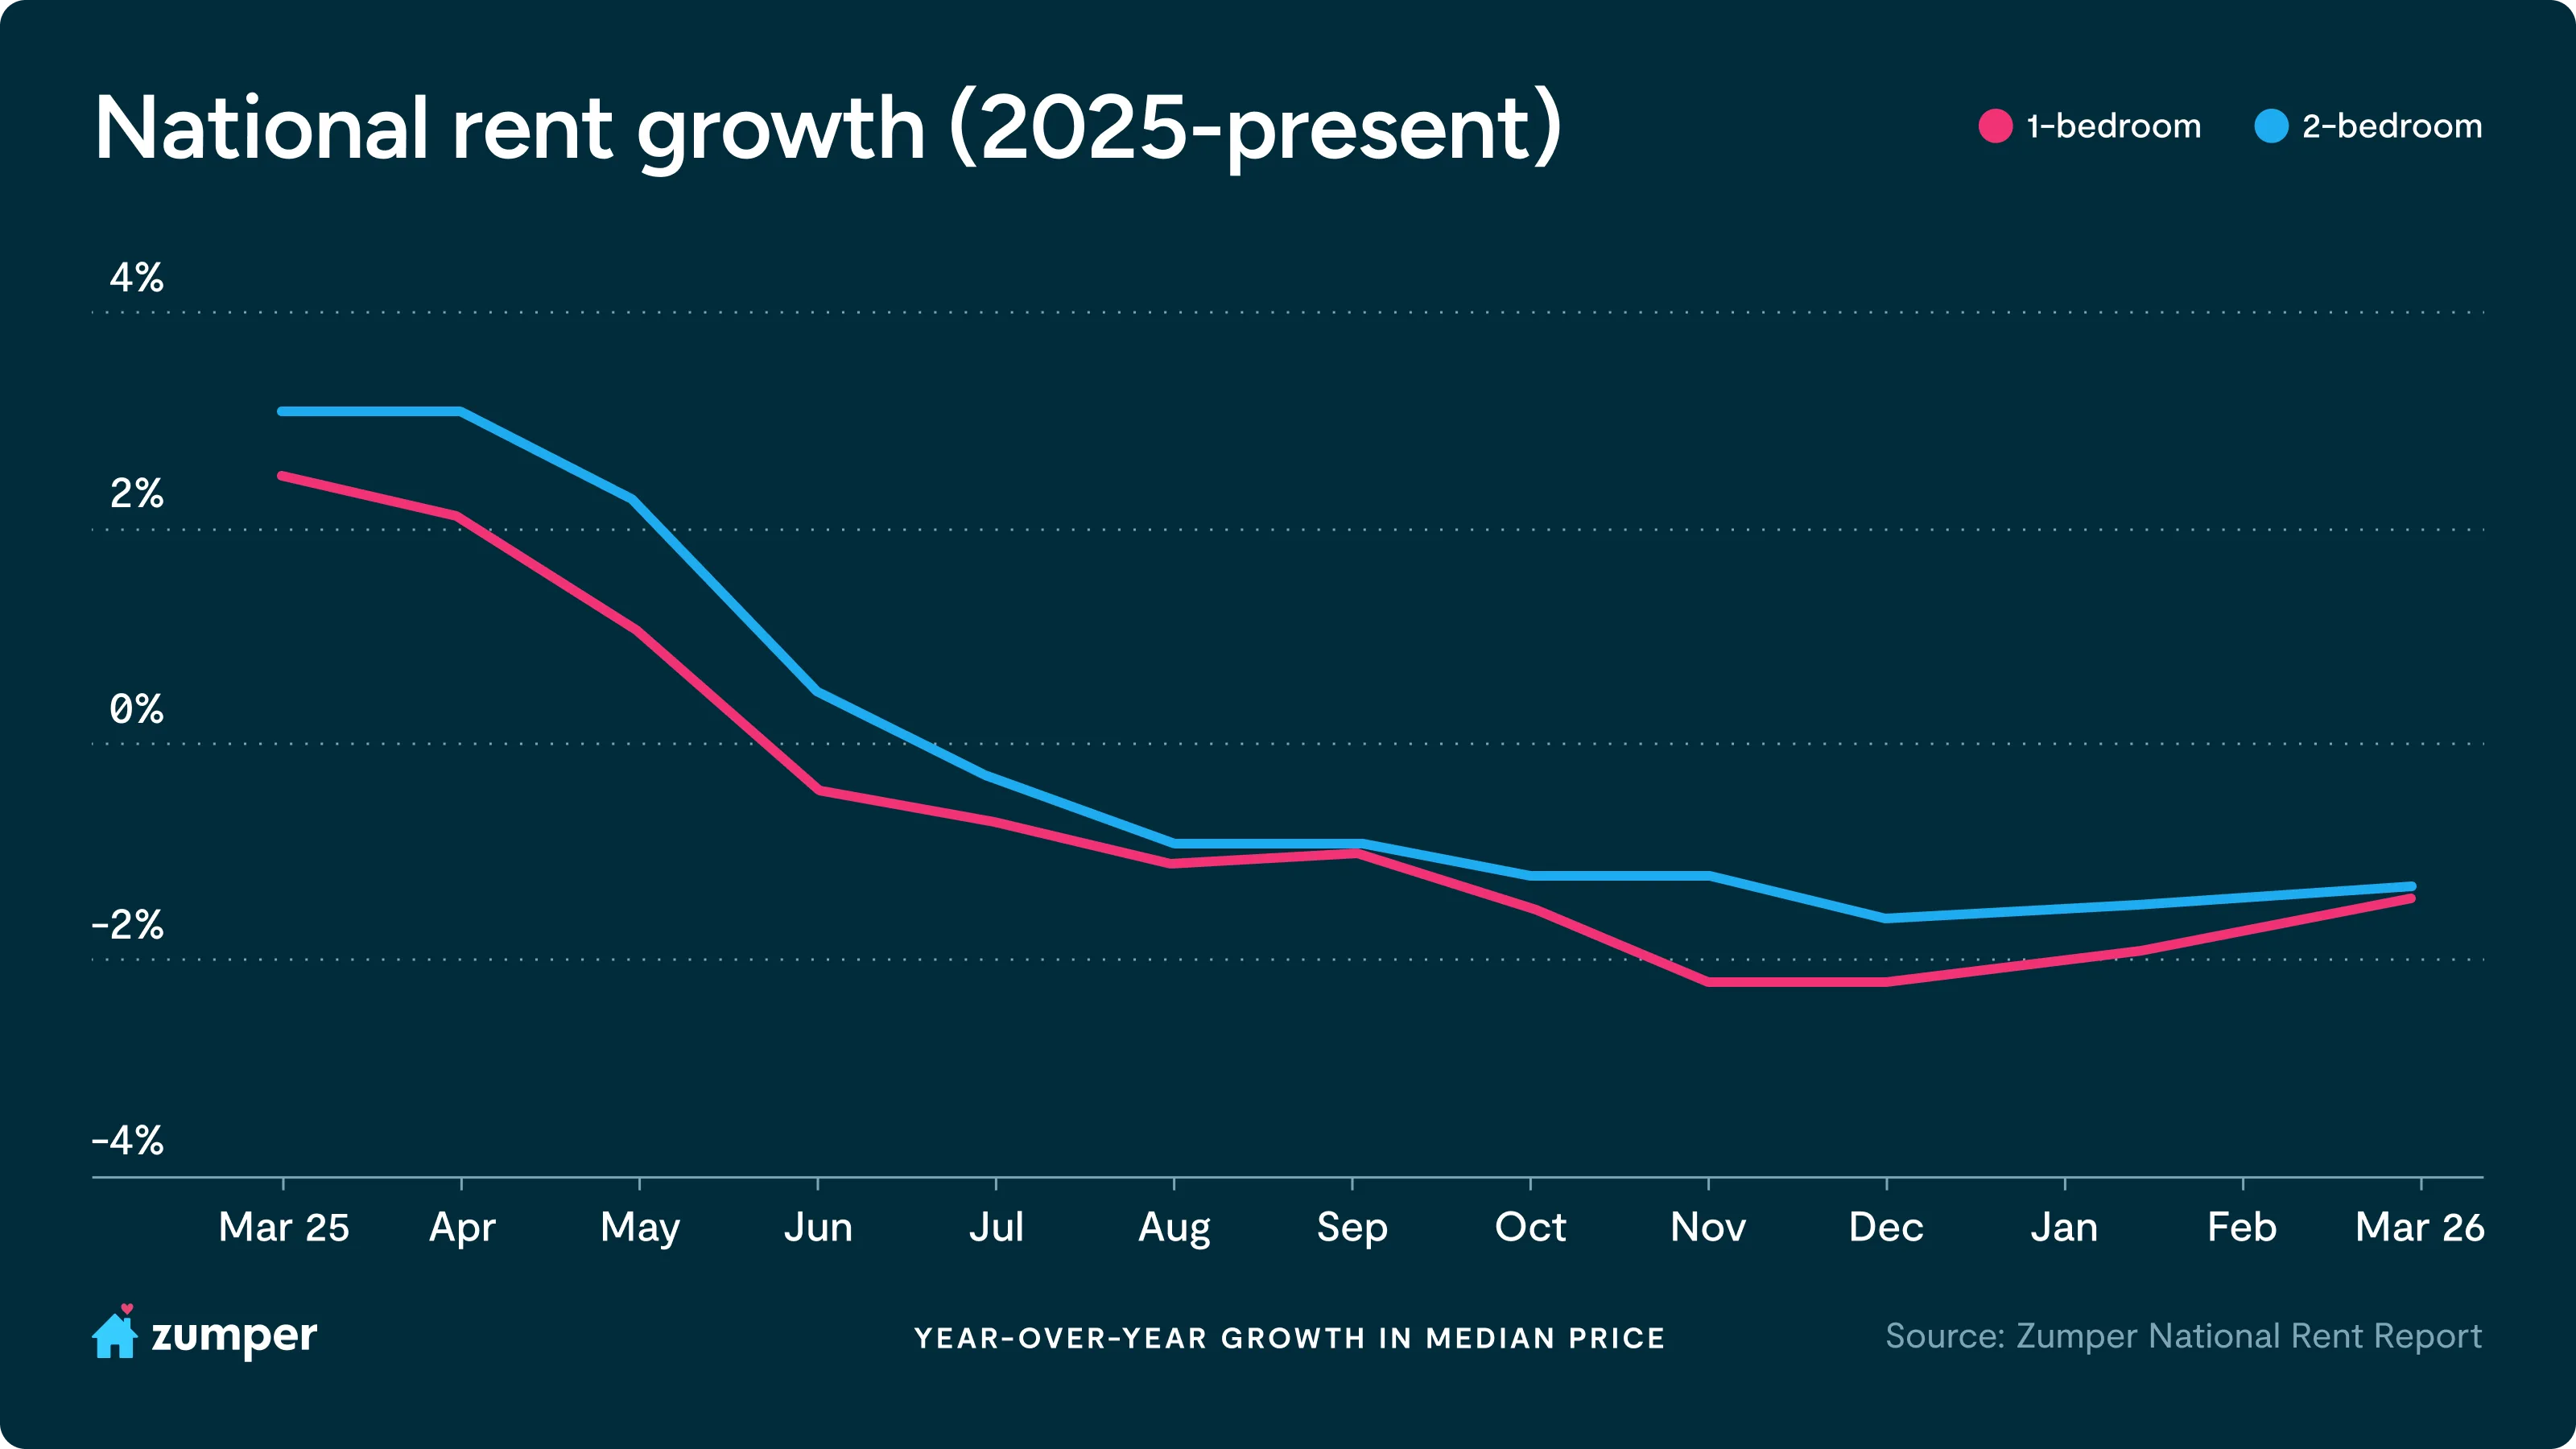
Zumper’s National Rent Index shows that annual rent declines are continuing to ease, with one-bedroom rent down 1.4% to $1,502 and two-bedrooms falling 1.3% year-over-year to $1,880. Both unit types have been trending upward in recent months, marking the third consecutive month of decelerating annual declines and signaling a market that is gradually stabilizing after nearly a year of downward pressure.
Against this backdrop, monthly rent trends are now beginning to turn. Median asking rents ticked up modestly this month, with one-bedroom rent rising 0.2% and two-bedrooms increasing 0.1%. Notably, this marks the first time both bedroom types have posted monthly gains since May 2025, pointing to a return to more typical seasonal patterns after an unusually soft summer and fall.
Even modest monthly increases carry broader macroeconomic implications. Given shelter’s outsized weight in inflation metrics, this renewed upward pressure could begin to reaccelerate housing’s contribution to CPI, which has remained relatively flat over the past year. For a deeper look at how Zumper’s national rent data offers an early signal into where the CPI may be headed, read our full analysis: https://www.zumper.com/blog/zumper-consumer-price-index/
“After a prolonged period of soft rent growth, the market is beginning to return to more typical seasonal patterns,” said Zumper CEO Shawn Mullahy. “While rents are still down year-over-year, the pace of those declines is clearly slowing, and early signs of spring demand are beginning to push prices upward again. As we head into peak leasing season, we expect competition to pick up, particularly in markets that have already absorbed a significant wave of new supply and are beginning to rebalance.”
San Francisco rents lead the nation in annual growth to reach all-time highs
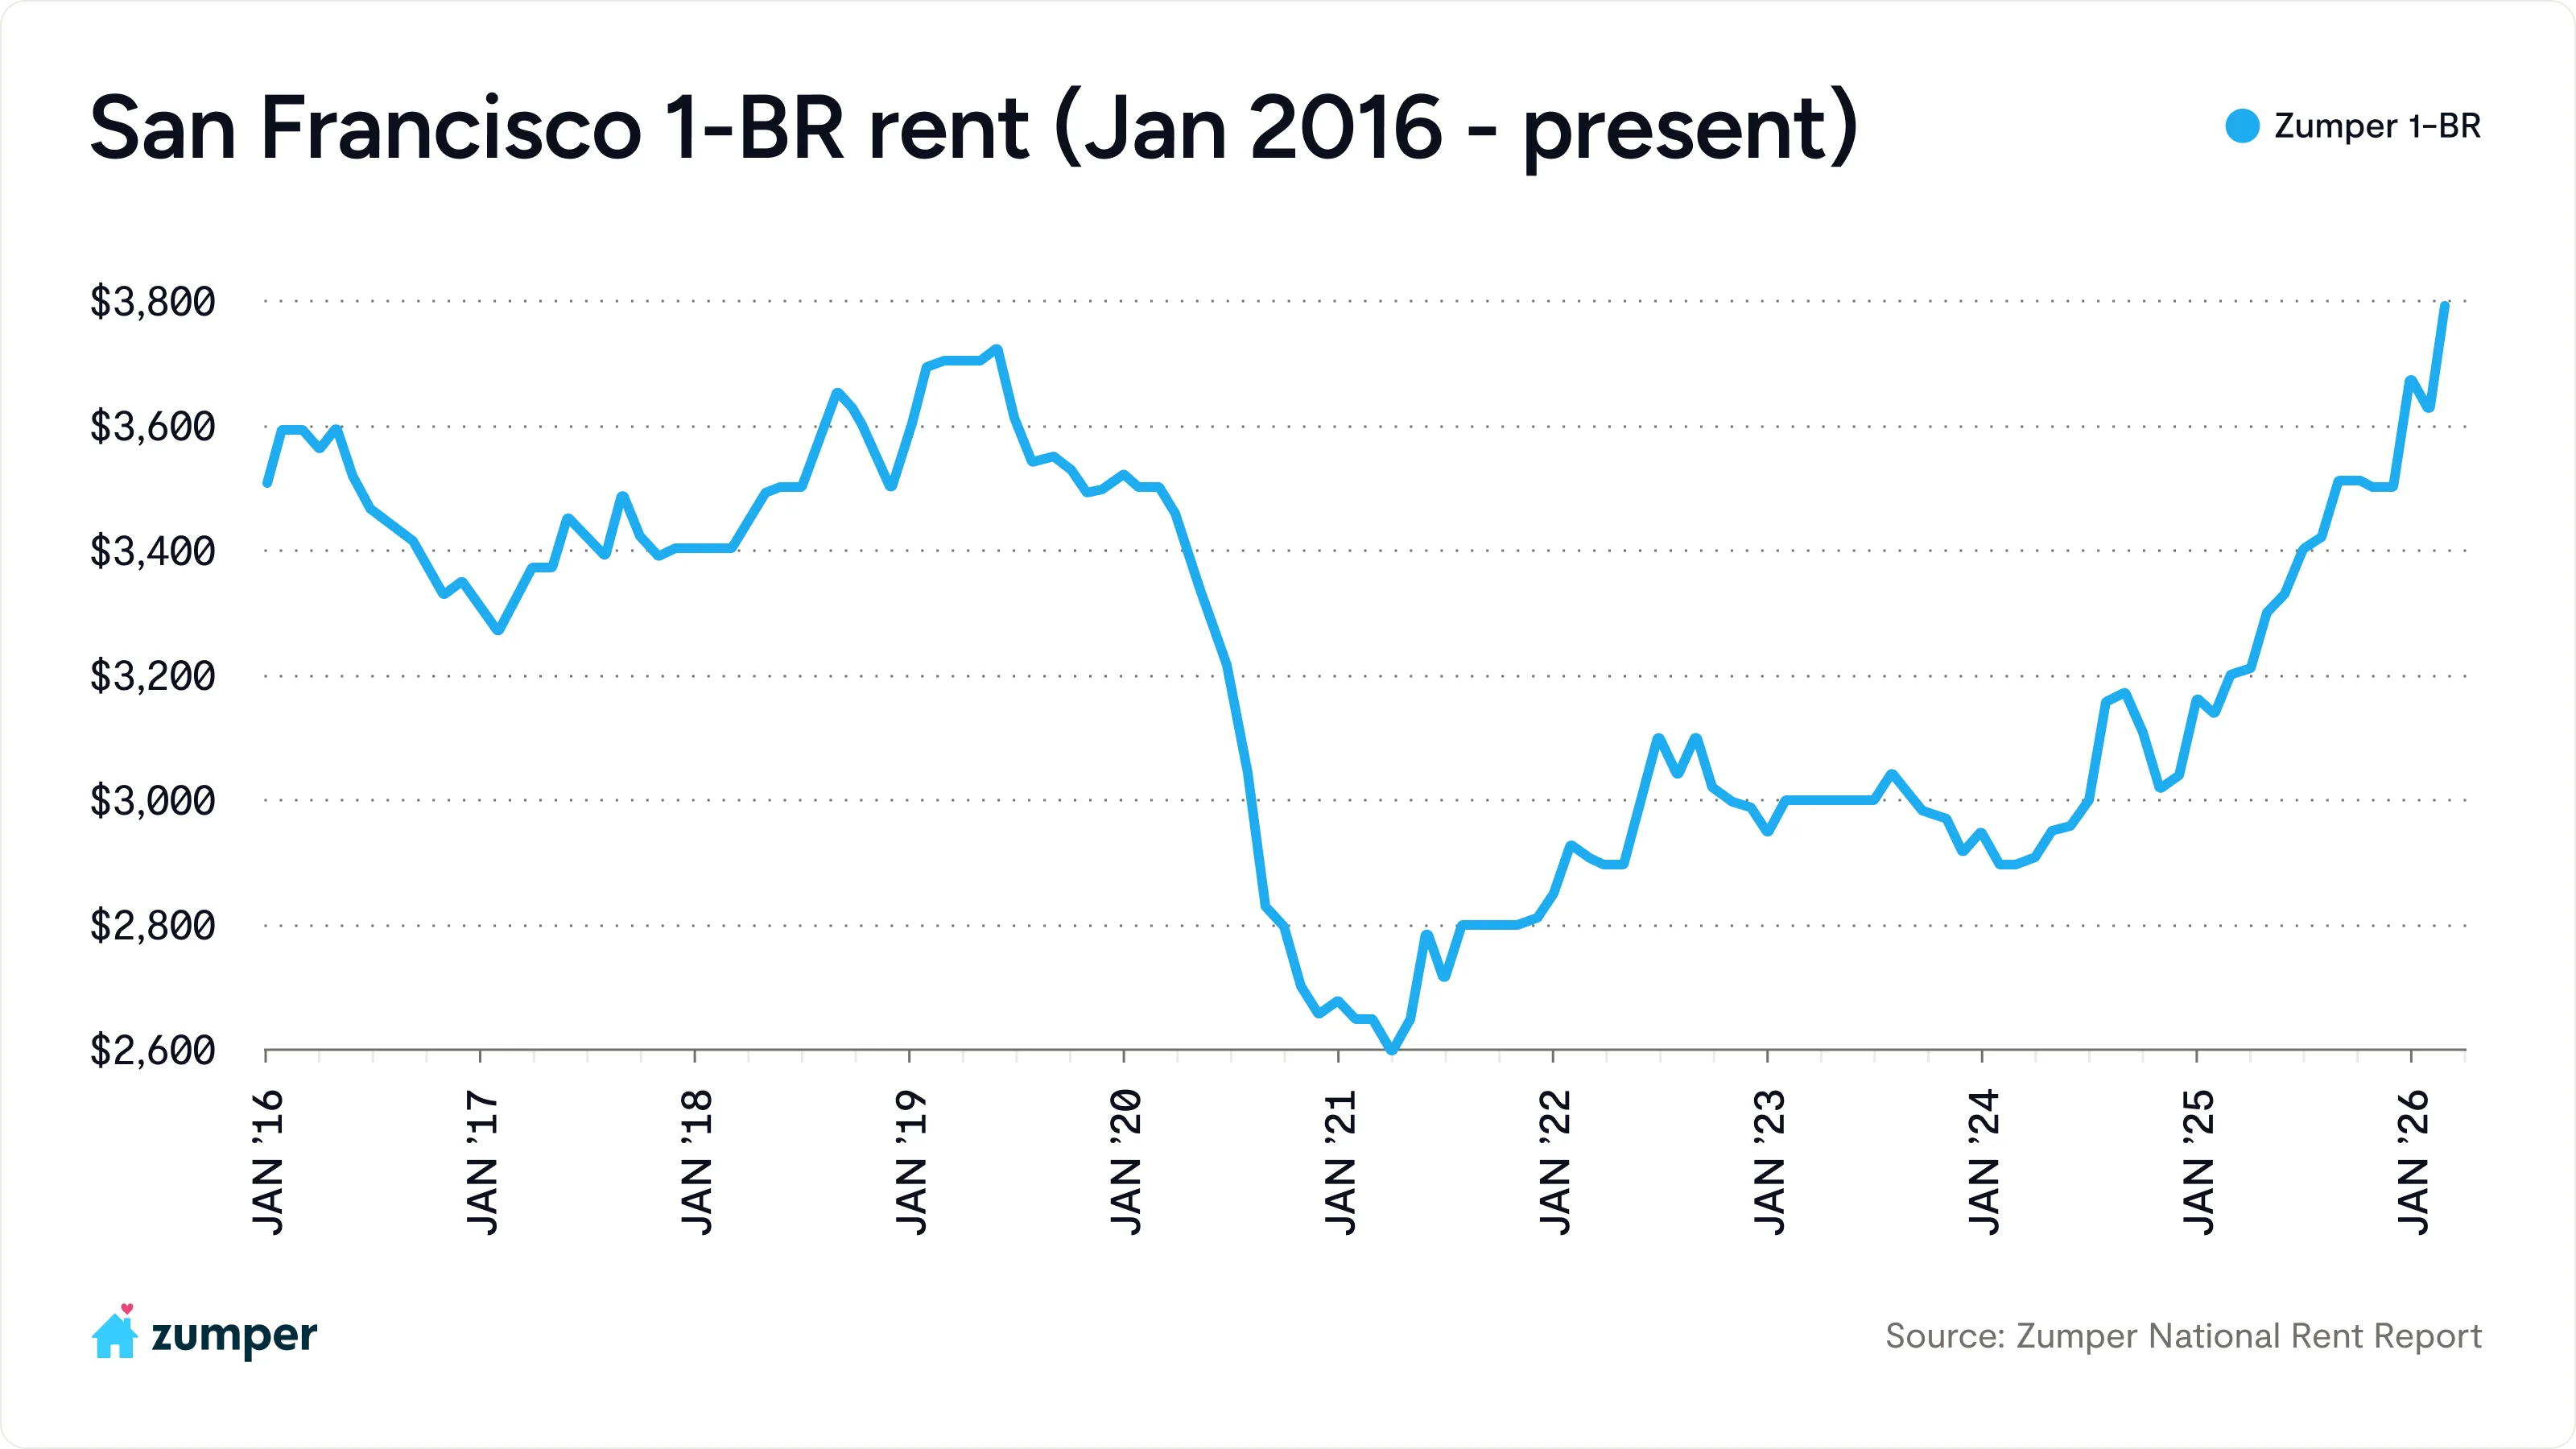
San Francisco led the nation in annual rent growth this month, with both one and two-bedroom prices hitting new all-time highs, marking the highest levels in over a decade of Zumper data. One-bedroom rent climbed 18.4% to $3,790, surpassing its previous peak of $3,720 set in June 2019, while two-bedrooms rose 22.6% to $5,270, exceeding the prior high of $5,120 recorded in September 2025.
This surge reflects a rapid rebound in demand, driven in part by the city’s resurgent tech sector, particularly AI-related hiring, and a broader return-to-office push that is pulling higher-income renters back to urban centers. At the same time, recent shifts in local leadership have helped improve overall sentiment around the city, contributing to renewed confidence among both renters and employers. Crucially, this demand is colliding with San Francisco’s longstanding housing constraints. The city’s rental occupancy rate had already reached 96.7% as of last September, signaling an extremely tight market, and conditions have likely tightened further since then. With limited new construction and structurally constrained inventory, the market has little capacity to absorb a renewed wave of renters. As a result, competition has intensified quickly, with bidding wars re-emerging in high-demand neighborhoods. Together, these dynamics point to a market that has moved out of its post-pandemic slump and is fully settled into a supply-constrained growth phase.
Softening rents continue across Florida as domestic migration slows while supply remains elevated
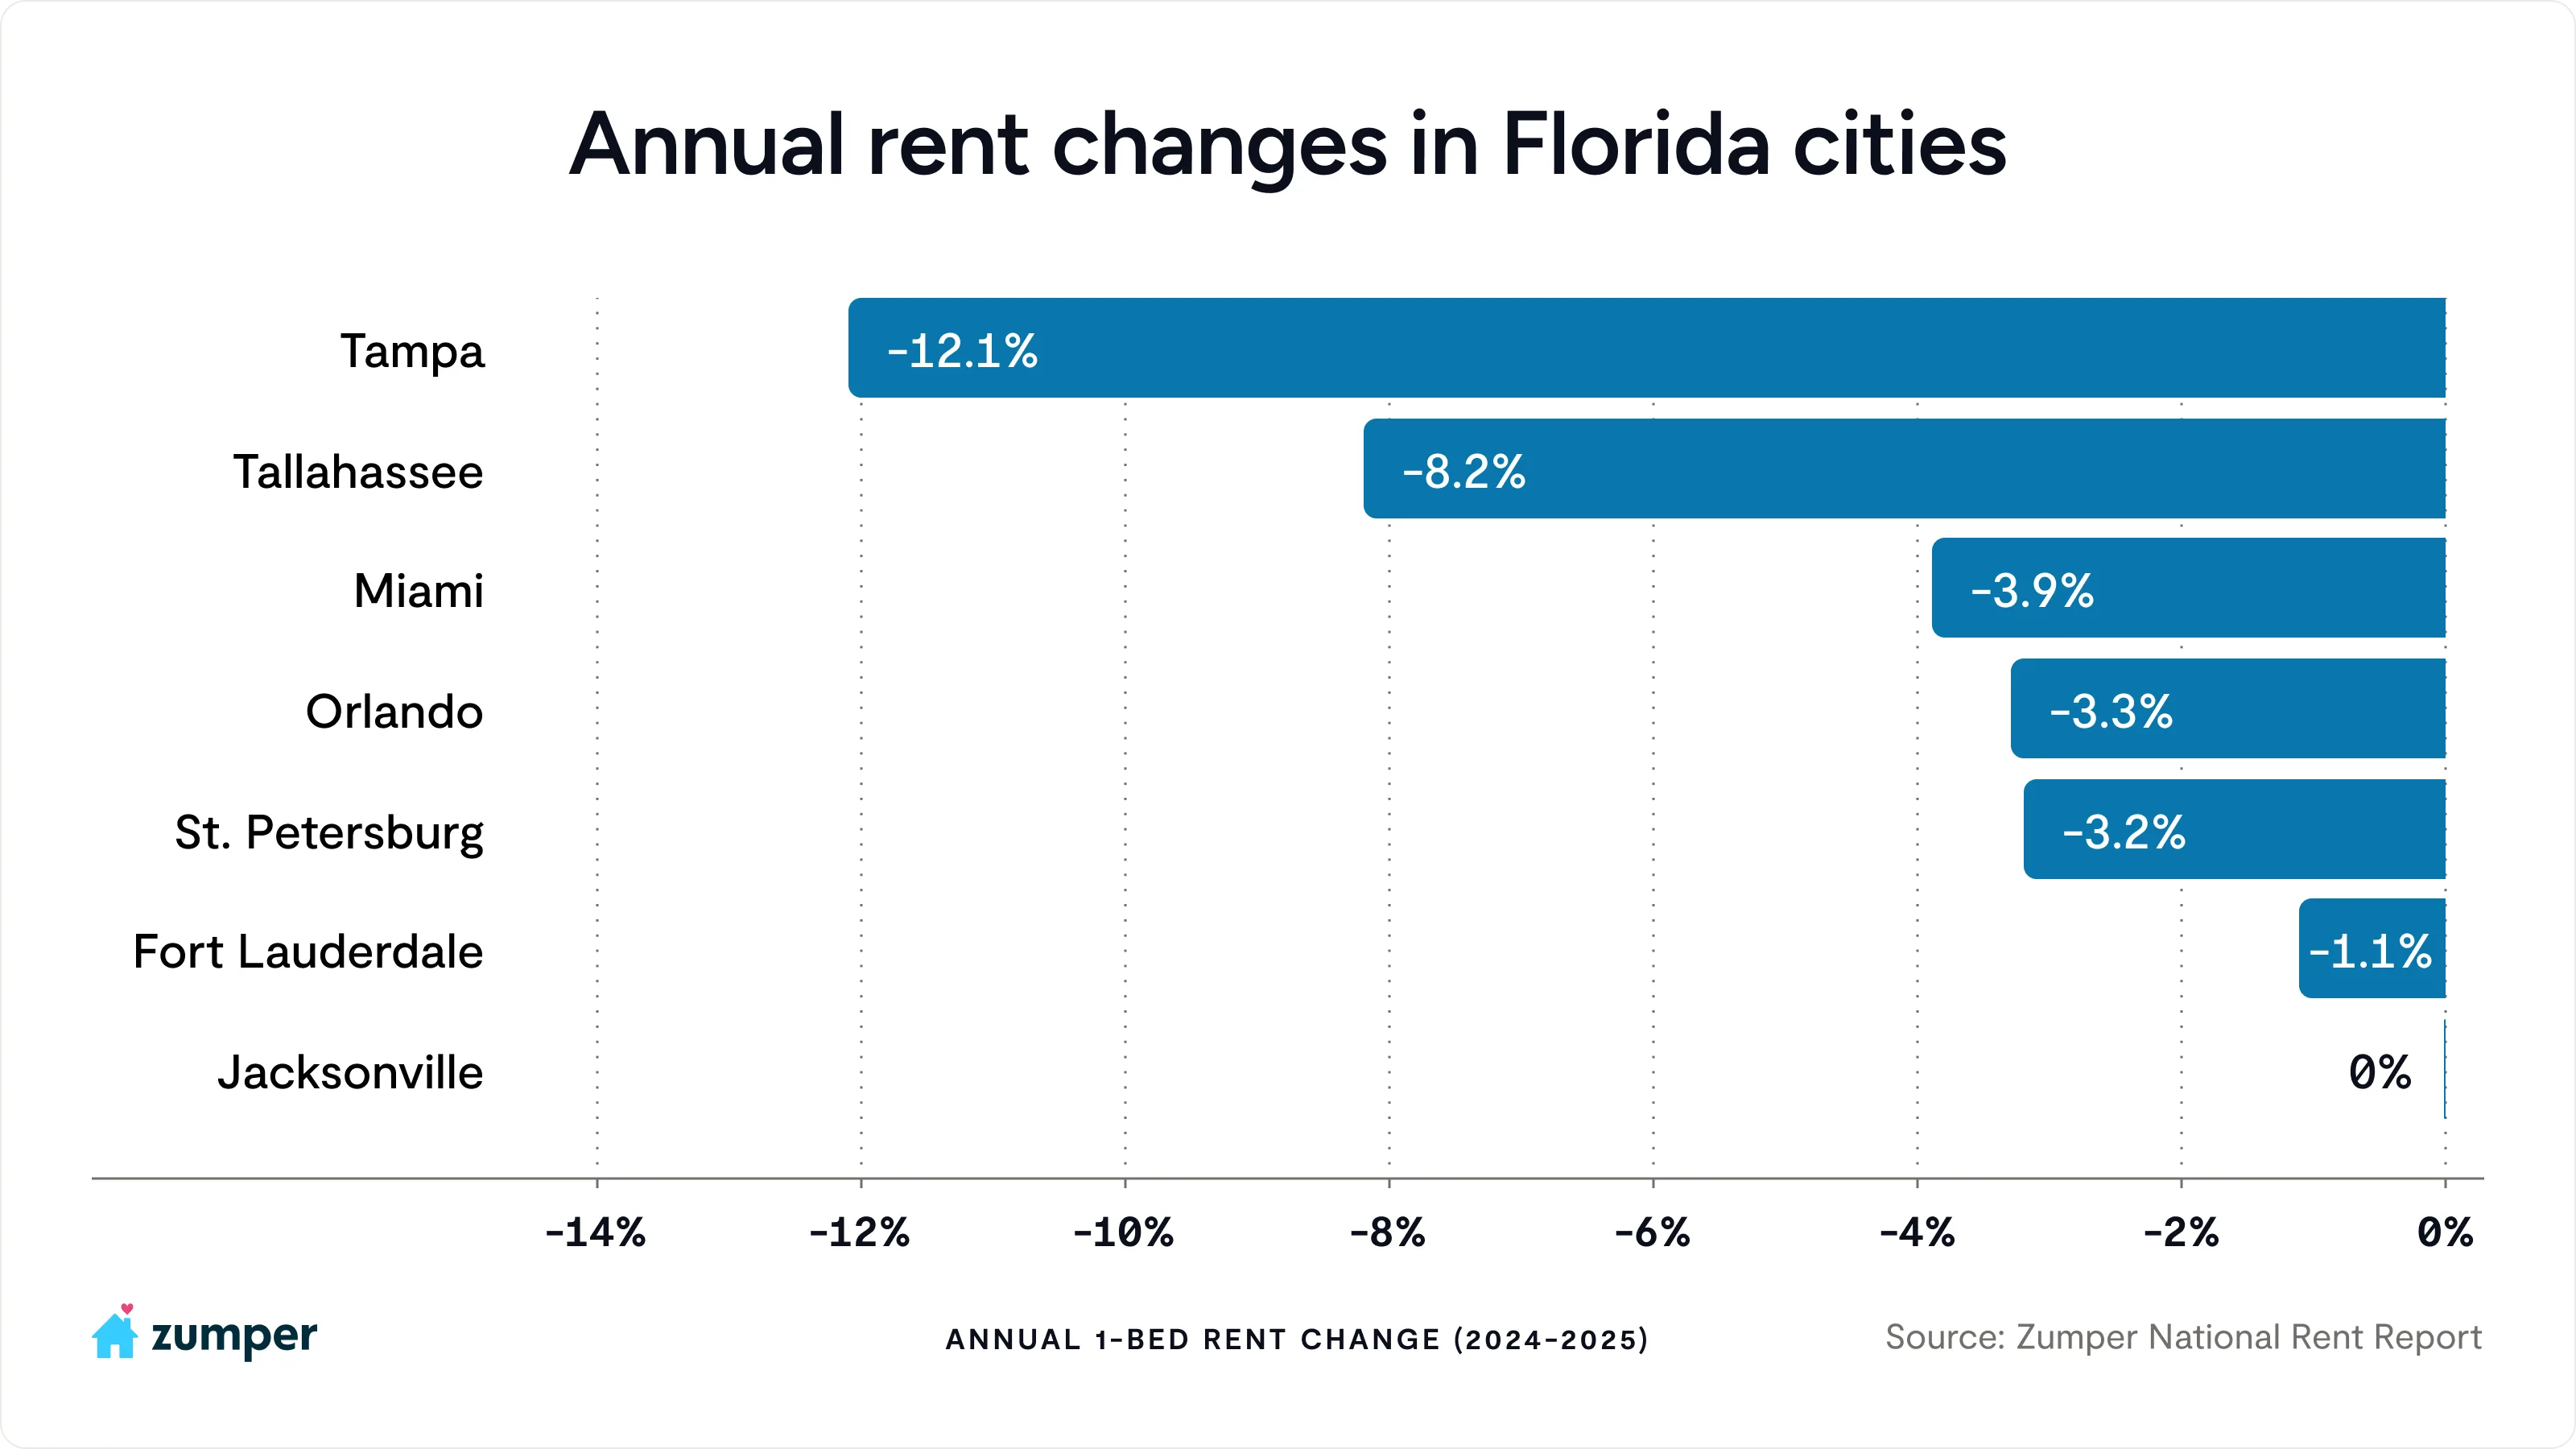
All Florida markets in our report had either flat or declining annual one-bedroom rent. Tampa led the declines with rent down 12.1%, followed by Tallahassee down 8.2%, and Miami down 3.9%, signaling softness across both large and mid-sized markets.
After an unprecedented pandemic-era surge, Florida became a top destination for both domestic and international migration. While the state remains a long-term growth market, domestic migration has slowed meaningfully from peak levels, contributing to more normalized demand conditions today. At the same time, supply has been catching up. Developers rapidly ramped up construction to capitalize on the demand boom, but the lag between project starts and completions has created a timing mismatch. Peak deliveries are now arriving after peak demand, pushing inventory higher and intensifying competition among property owners. As a result, many markets are seeing downward pressure on rents, increased concessions, and more choice for renters. While some markets that are already past their peak supply wave could stabilize sooner, areas still working through elevated inventory may take longer to rebalance as both migration trends and new supply continue to normalize.
Words by