


Key takeaway: National median rents turned a corner this month, but that calm masks a market still split by geography. Texas, Nashville, and Colorado remain deep in decline from oversupply, while San Francisco and Virginia Beach, which largely avoided it, are posting the fastest growth in the country.
Notable Trends
- The Zumper National Rent Index shows one and two-bedroom prices are positive annually at the same time for the first time in 16 months: one-bedrooms up 0.1% to $1,518, two-bedrooms up 0.5% to $1,903.
- San Francisco one-bedroom rent climbed to an all-time high of $4,400, up 25.4% year-over-year, narrowing the gap with New York City to just $180, the tightest margin of the year.
- All Colorado cities in the report had falling annual rents, with Denver, Aurora, and Colorado Springs experiencing declines of over 5%.
- Virginia Beach’s one-bedroom rent is up 16.4% year-over-year, the second-fastest growth of any market in the country after San Francisco.
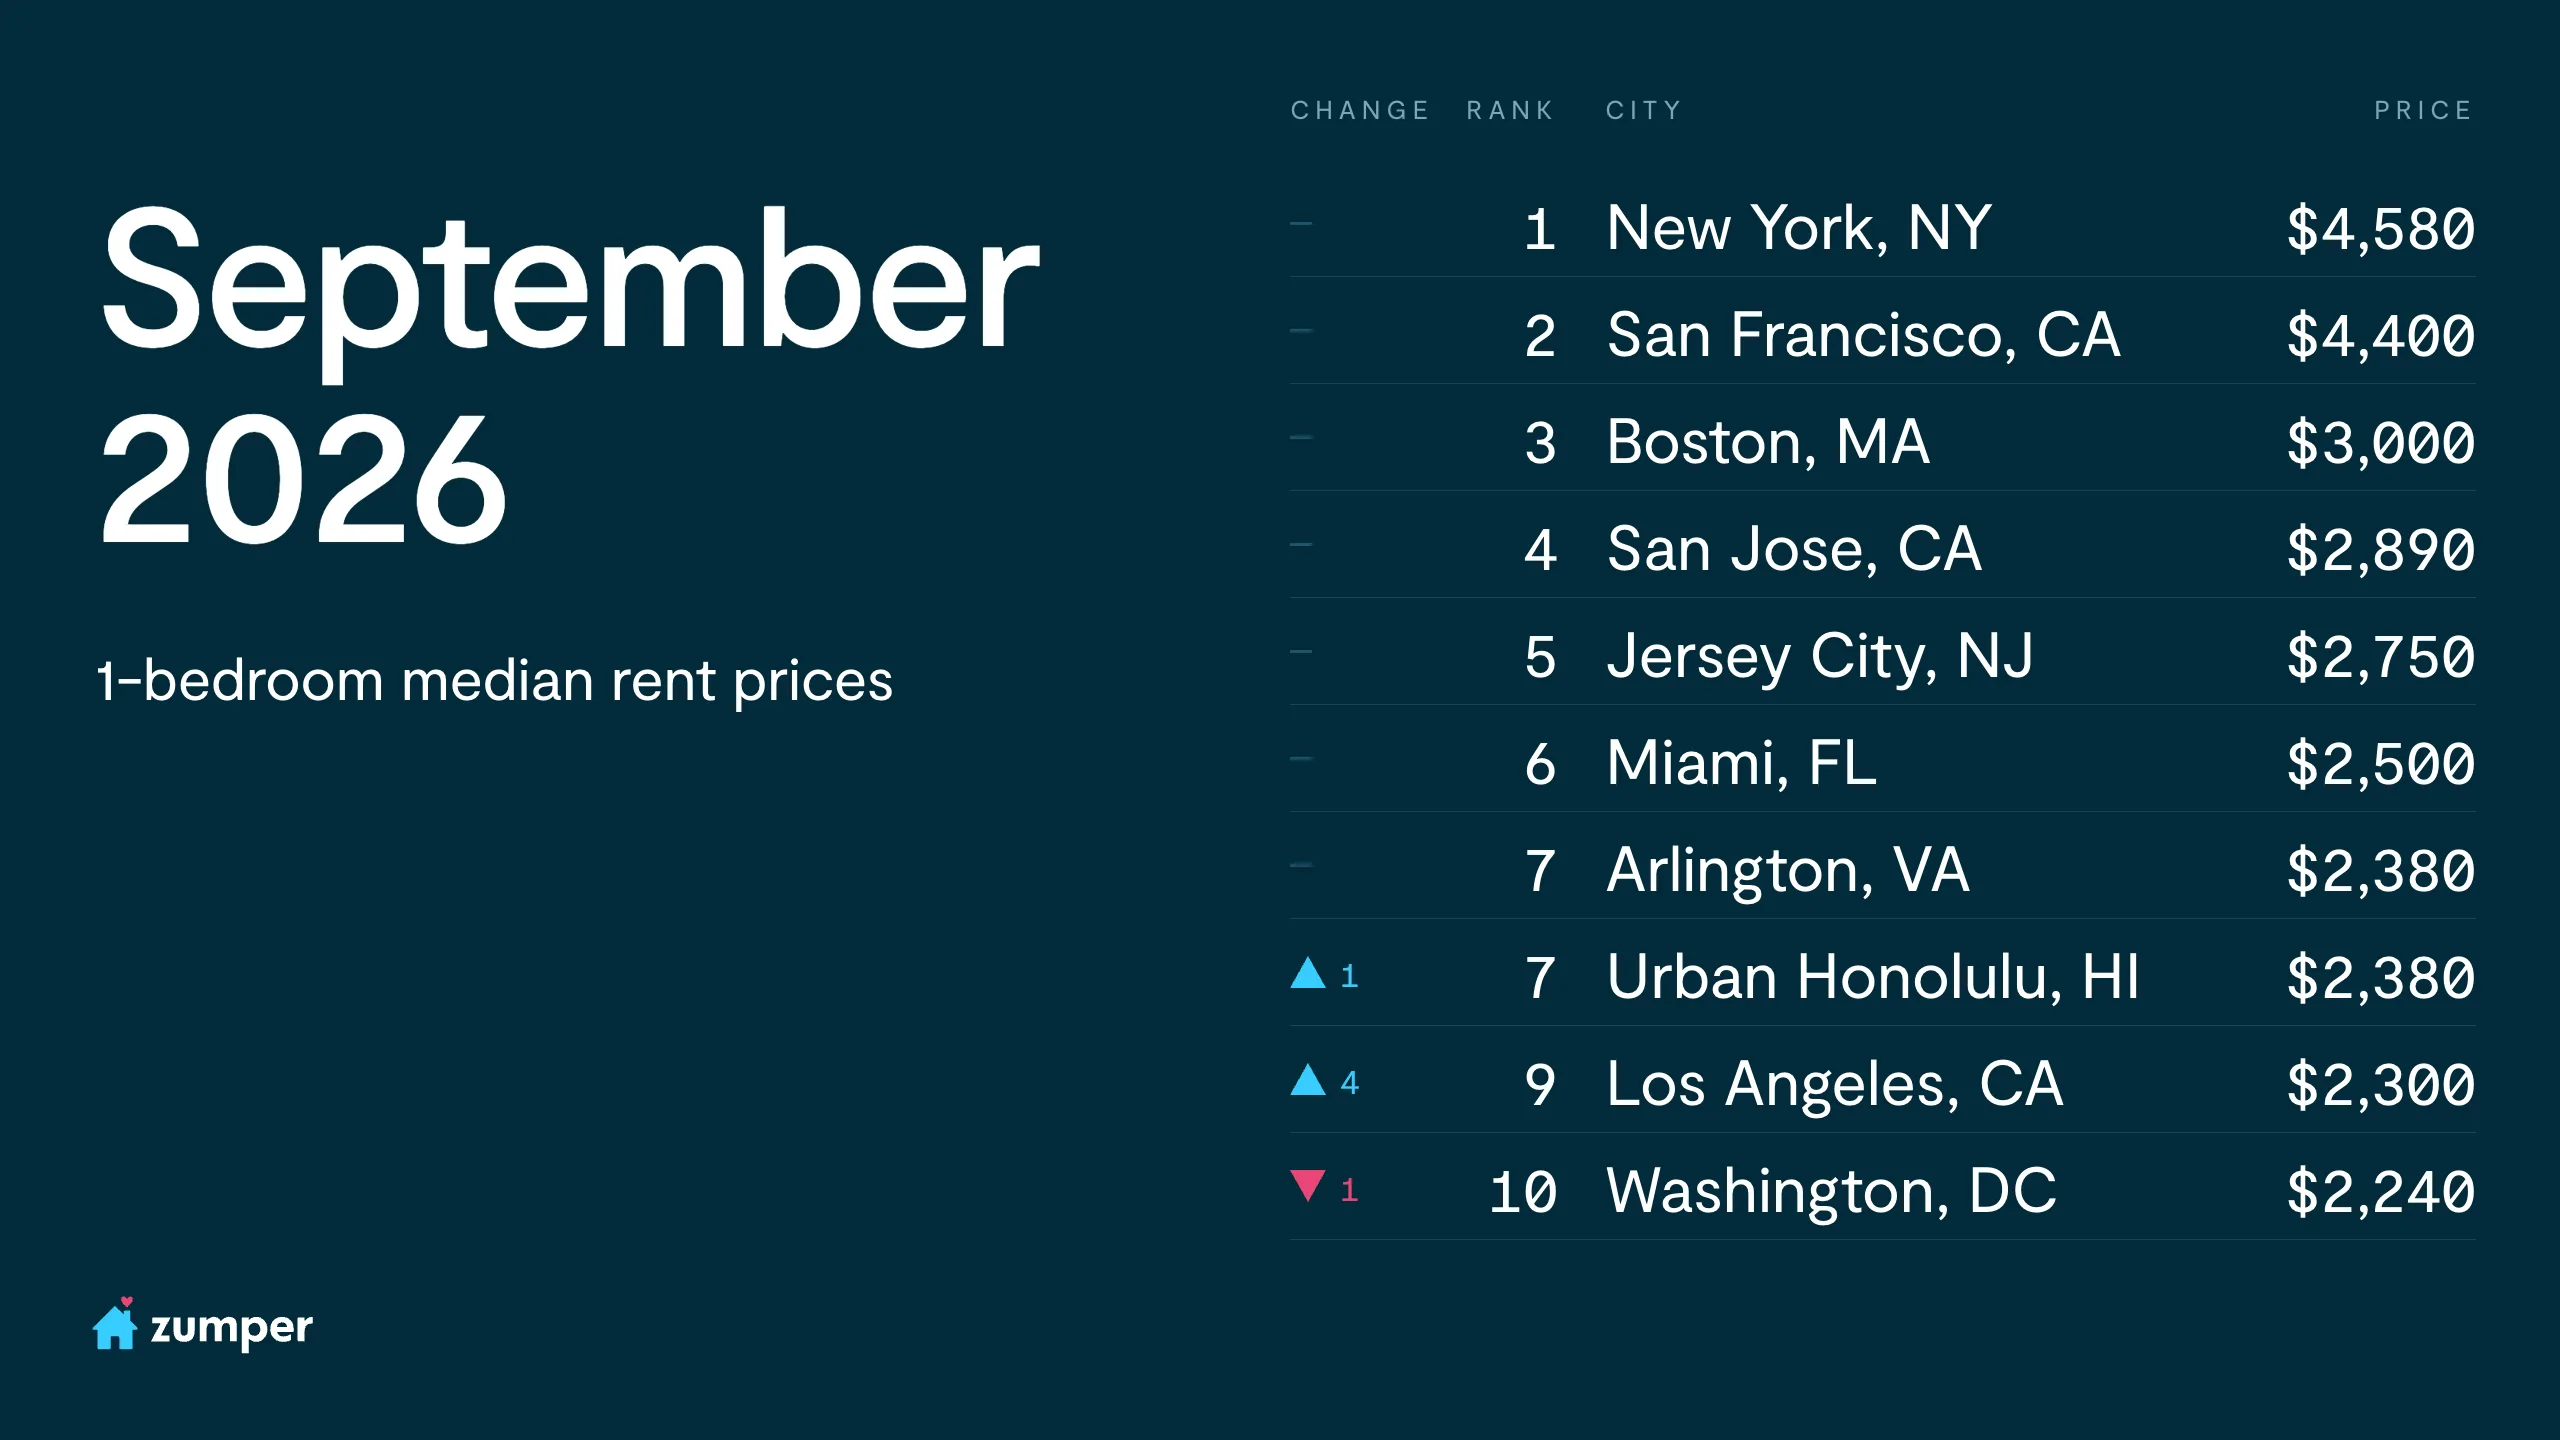
New York City held on to the top spot at $4,580 for one-bedrooms, with San Francisco closing the gap to just $180, the tightest it’s been all year. San Francisco continued to set record highs for both one and two-bedroom rents this month. Honolulu climbed into a tie with Arlington, VA for 7th. San Diego dropped two spots to #12, edged out by Santa Ana and Los Angeles. Miami and Washington, DC were the only two markets in the top 10 posting annual declines in both bedroom types this month.
National rents both turn positive annually for the first time in 16 months
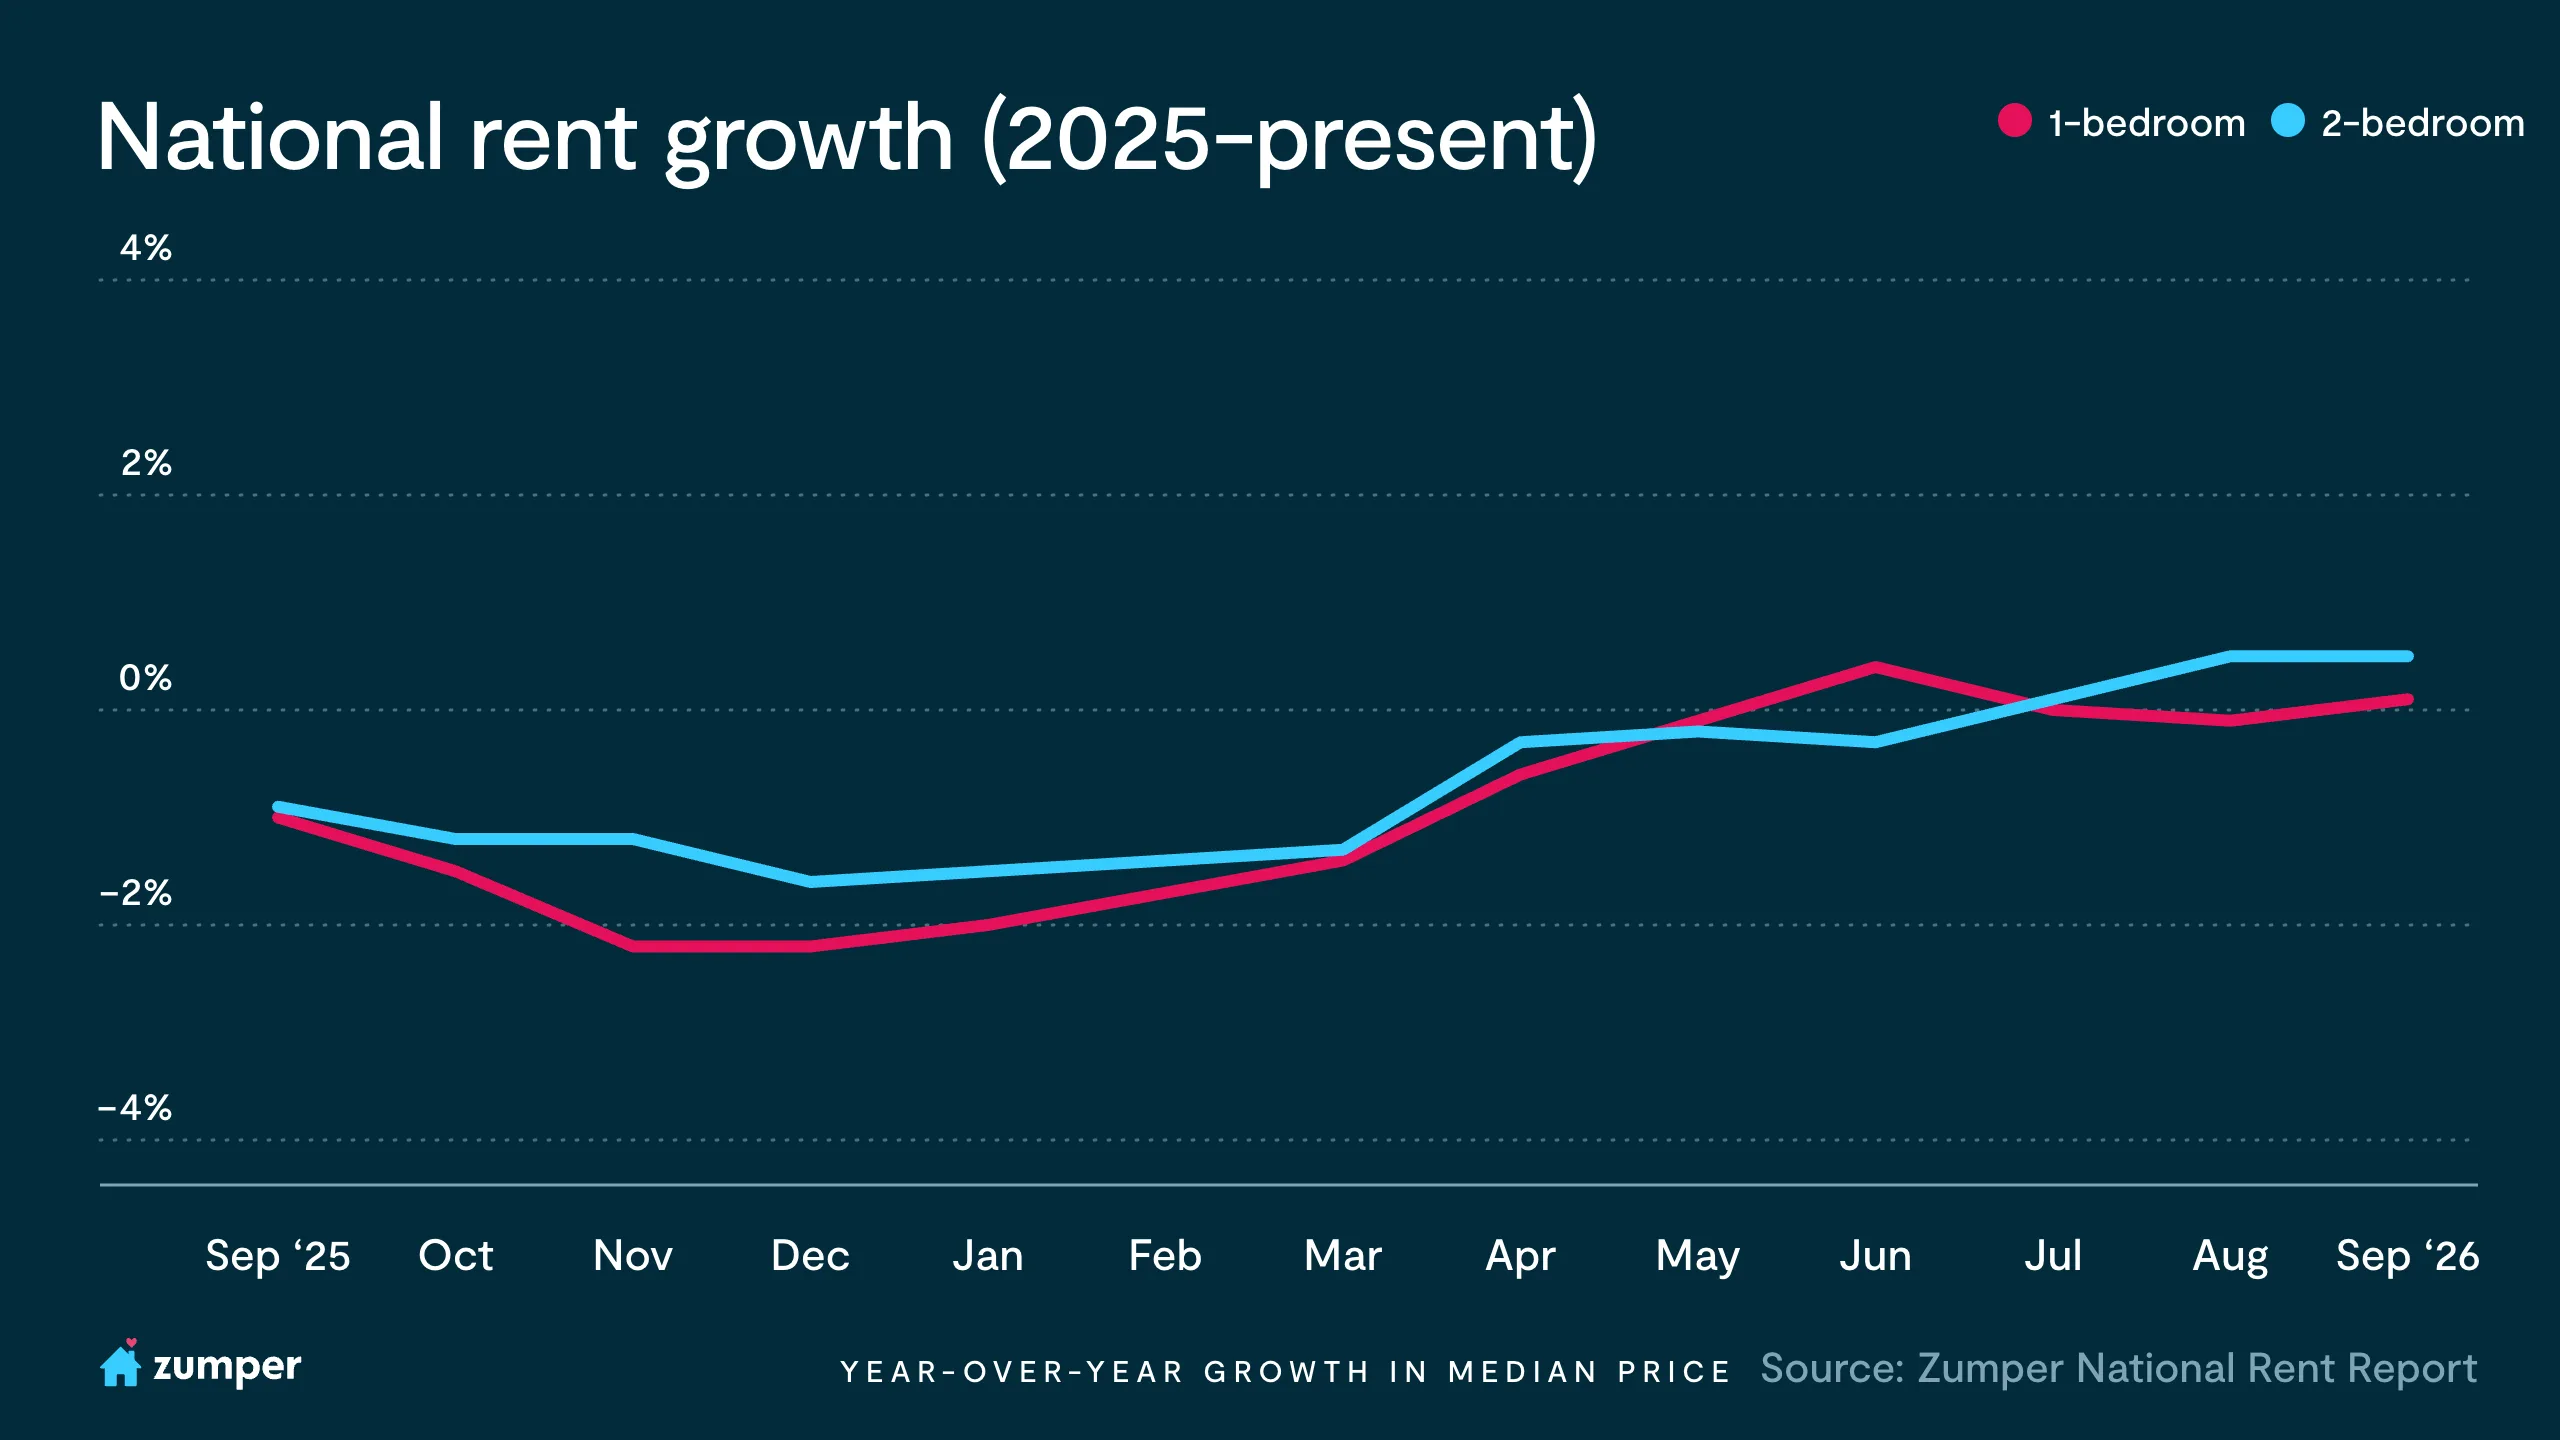
The Zumper National Rent Index showed the median one-bedroom rent rose 0.2% month-over-month to $1,518, while two-bedroom rent eased slightly, down 0.2% to $1,903. On an annual basis, one-bedroom rent increased 0.1%, while two-bedroom rent held its gain at 0.5%. This report marks the first month in 16 months (since May 2025) that both bedroom types have posted positive annual growth simultaneously.
“There really isn’t one U.S. rental market right now,” says Zumper CEO Shawn Mullahy. “Austin is down nearly 18% while San Francisco is up more than 25%. The common denominator is supply: markets still absorbing the building boom are competing aggressively for renters, while markets that avoided it are tightening quickly.”
That momentum lines up with a national rental market that’s holding fairly steady while new supply pulls back. The U.S. rental vacancy rate was 7.3% in the second quarter of 2026, statistically unchanged from a year earlier and essentially flat from the first quarter’s reading, according to the Census Bureau’s Housing Vacancy Survey. New deliveries are cooling too. Fewer new units moving through the pipeline is typically what it takes to tighten a market from here, even if vacancy hasn’t caught up to that yet.
The latest CPI data shows that the shelter index remains one of the stickiest components of inflation. Zumper’s index offers an early signal into where the CPI may be headed. For a deeper look, read our full analysis: https://www.zumper.com/blog/zumper-consumer-price-index.
Colorado continues to see rent softness
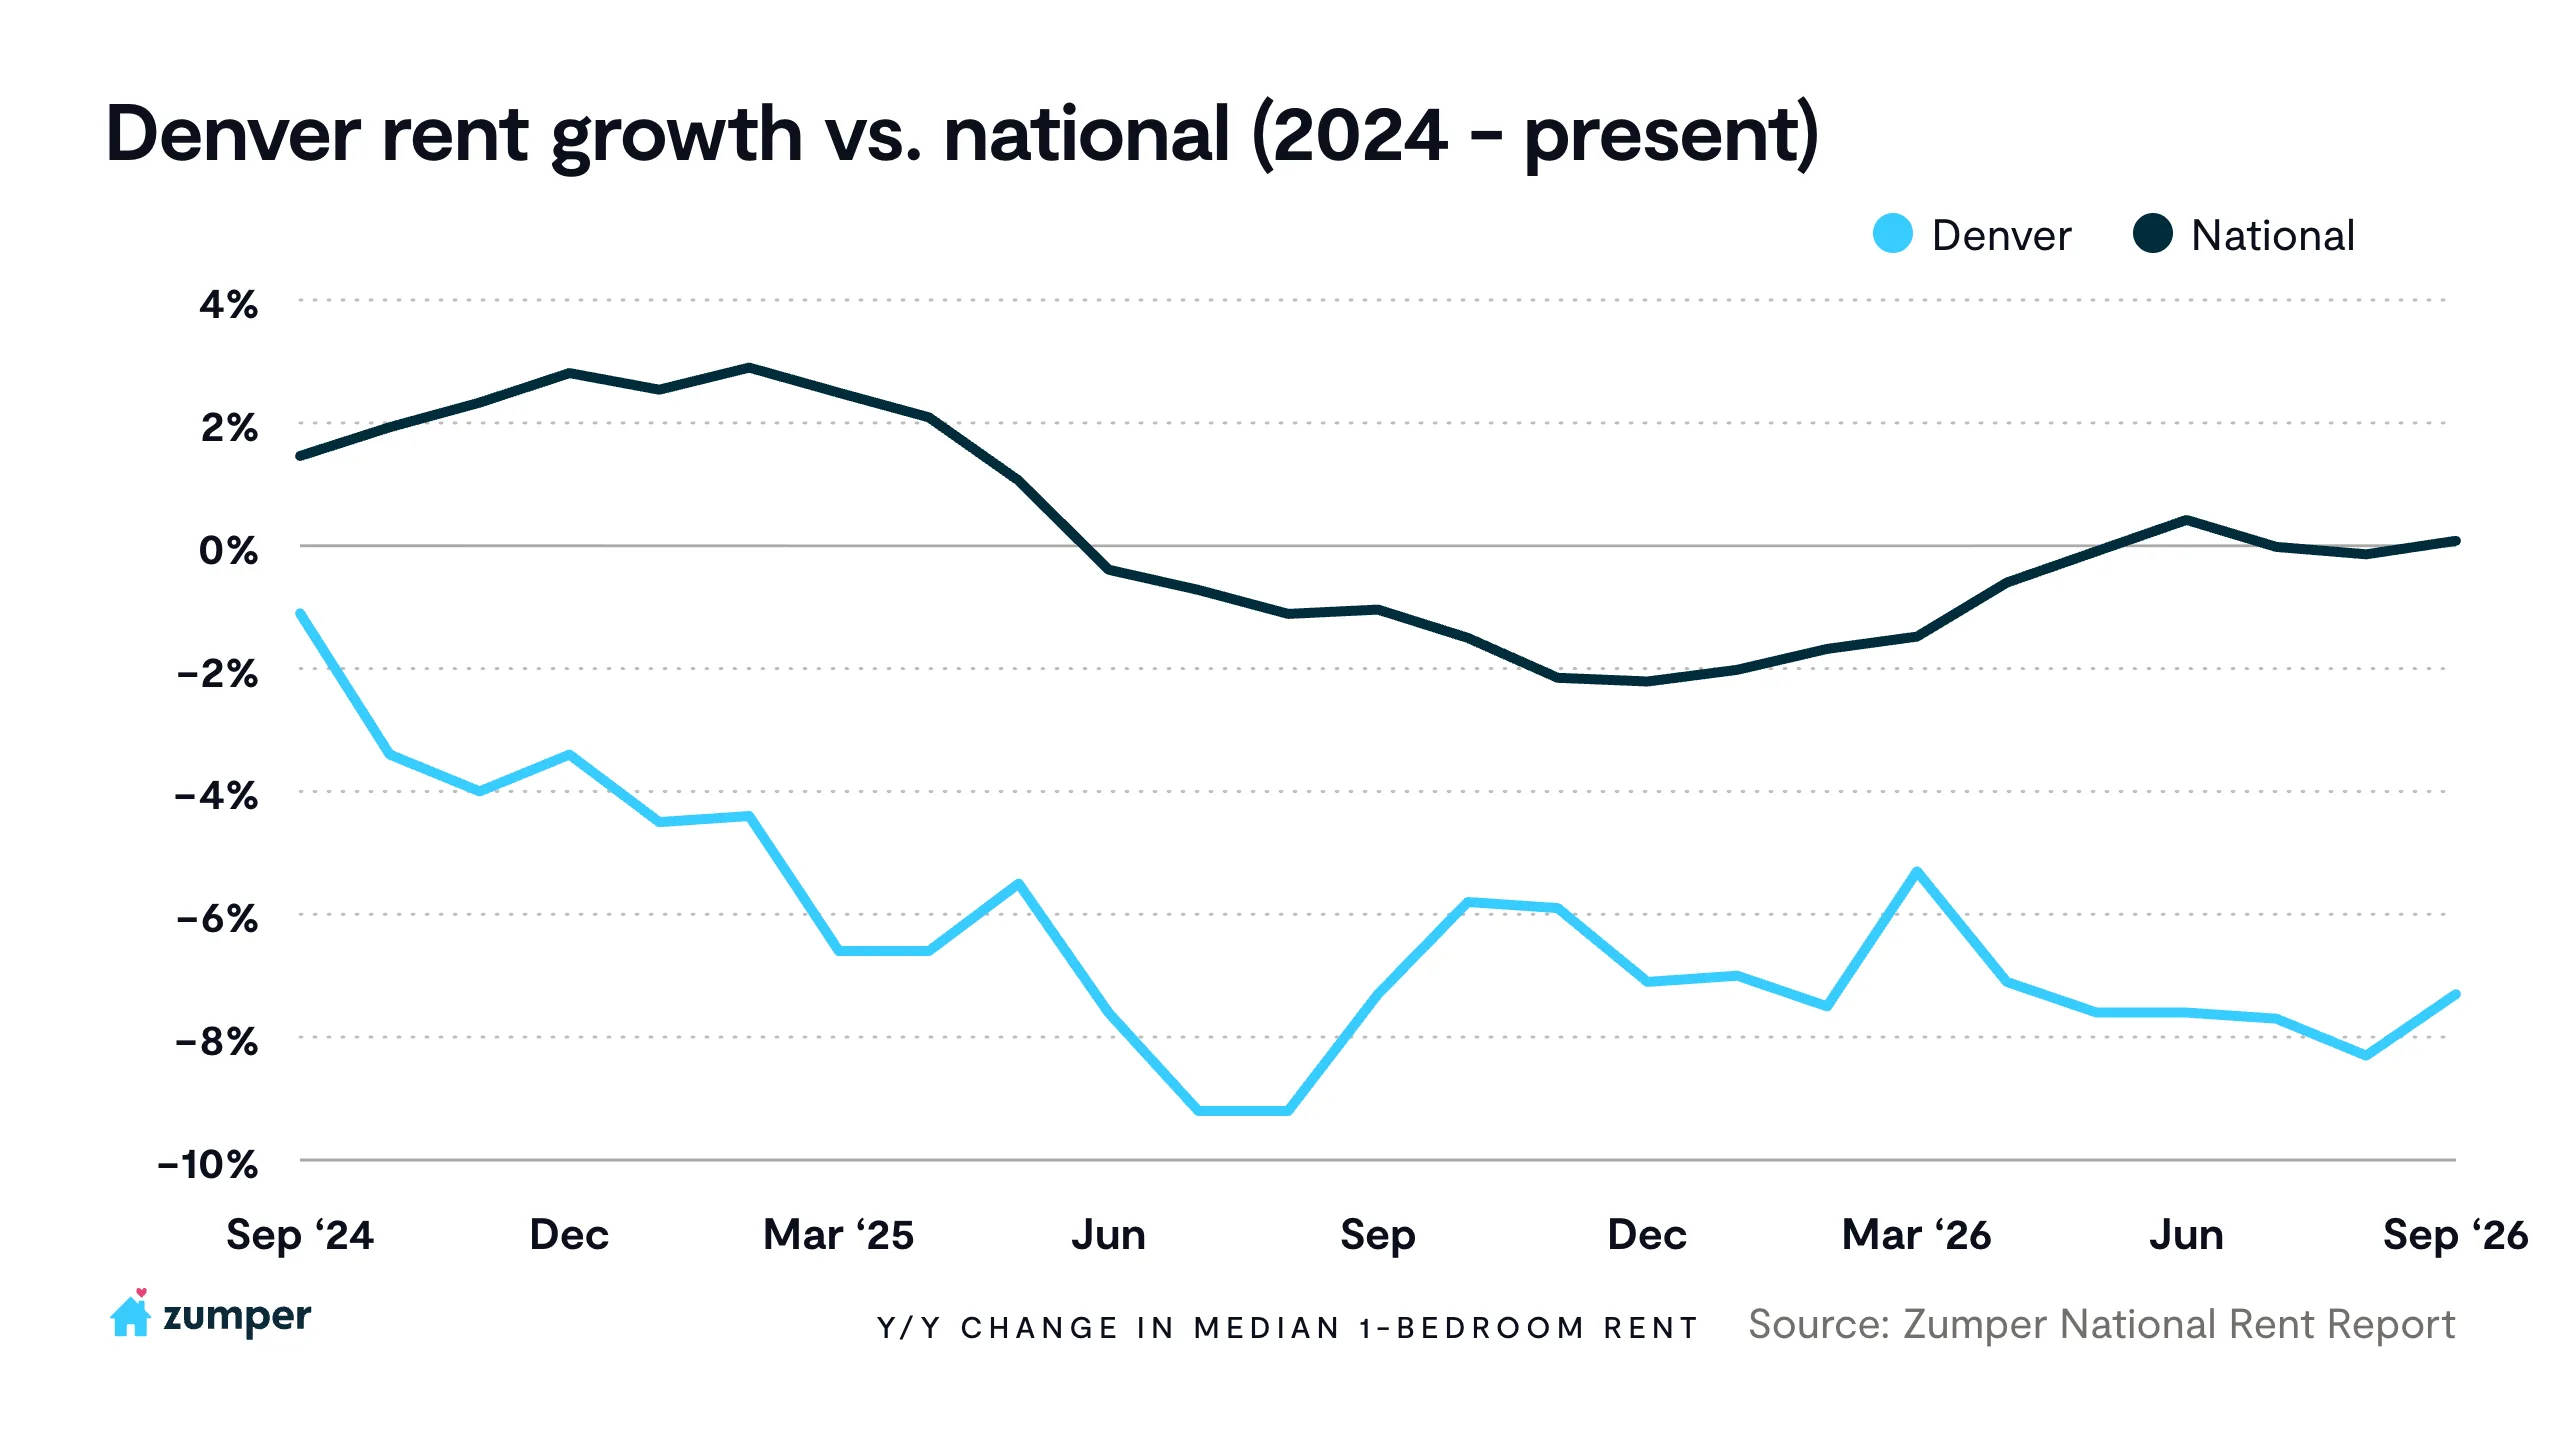
All Colorado markets in our report, Denver, Aurora, and Colorado Springs, posted annual rent declines this month, with one-bedroom rents down 7.3%, 7.7%, and 5.4%, respectively. As of January 2026, occupancy sat below the national rate, with 92.9% in Denver and 93.2% in Colorado Springs, according to RealPage Market Analytics. This points to evidence of a market still absorbing new supply against comparatively soft demand. Zumper’s own listing data shows property owners responding accordingly: about 25% of Denver apartment buildings were offering concessions in August 2026, up from 18% over the same period in 2024, as more properties compete to fill units.
“Colorado built through the same boom that hit Austin and Phoenix, just a little quieter,” says Mullahy. “Denver and Colorado Springs still have real supply to work through, and until that clears, we’d expect property owners there to keep leaning on concessions to fill units rather than push rent.”
Virginia Beach: the quiet #2 in national annual rent growth
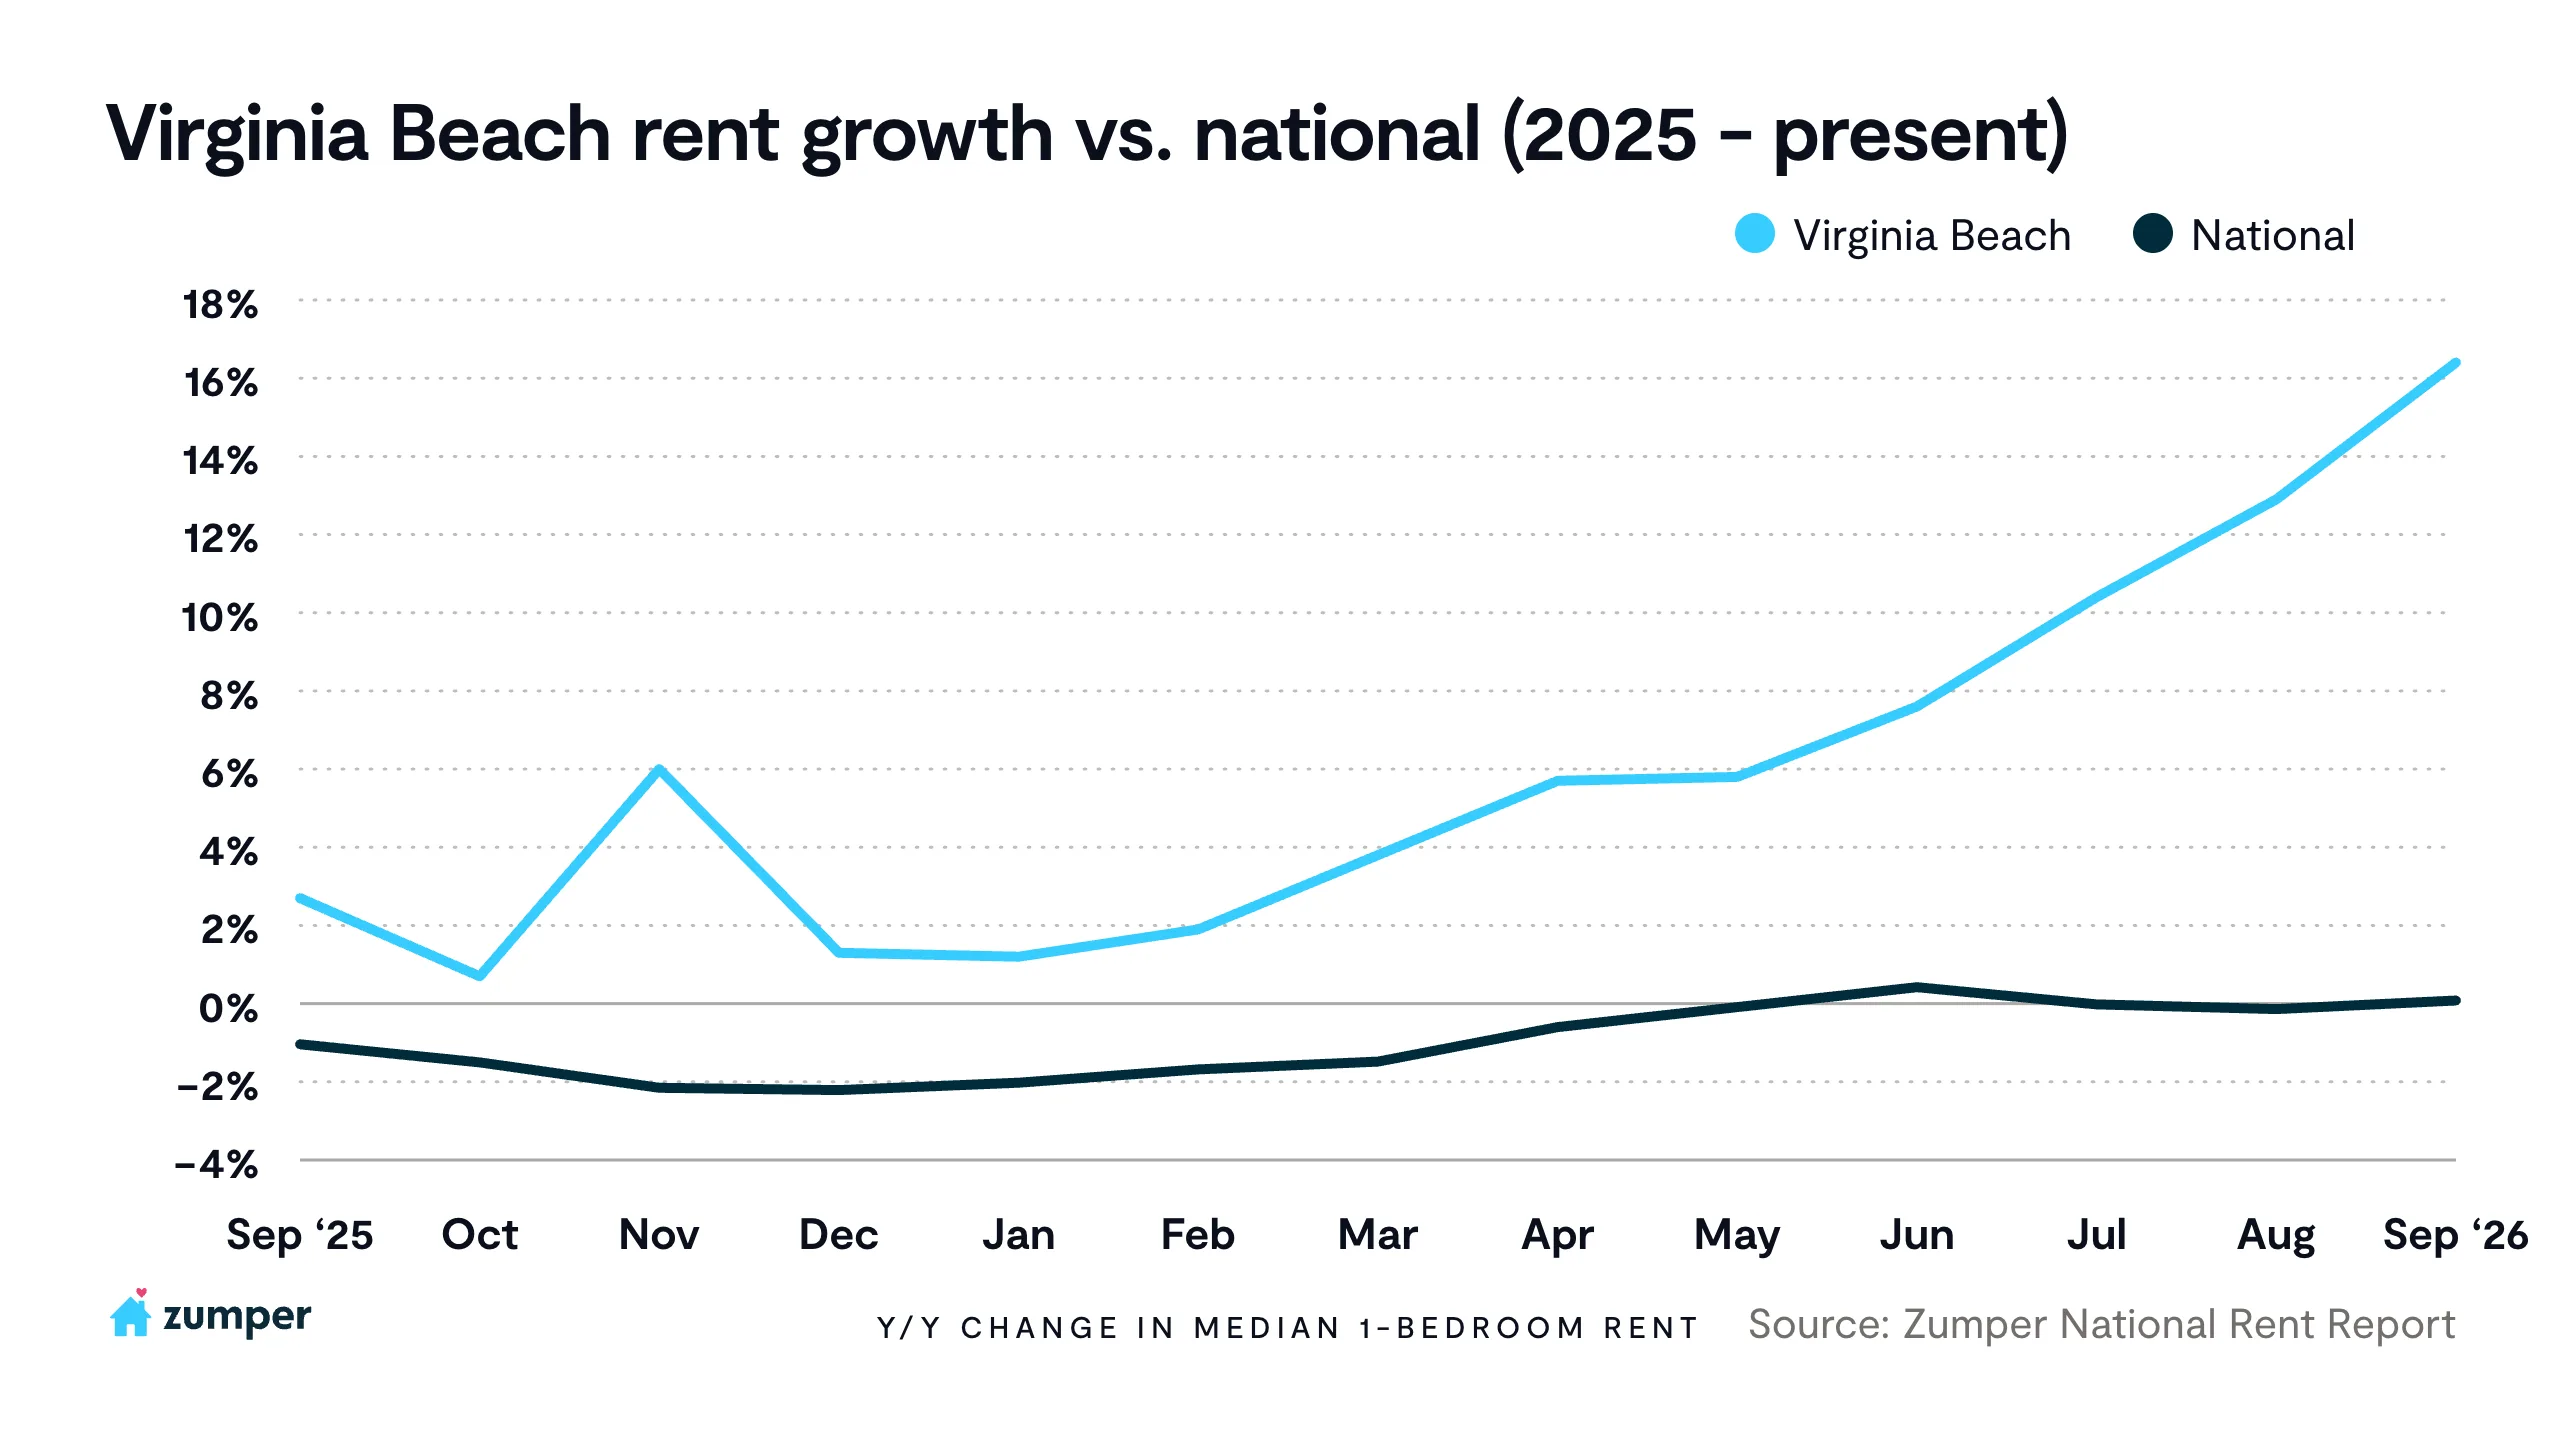
Virginia Beach posted the second-fastest rent growth of any market in the country this month, trailing only San Francisco. One-bedroom rent is up 16.4% year-over-year to $1,770, and two-bedroom rent climbed 9.4% to $1,970.
Unlike the Sun Belt markets driving this month’s steepest declines, Virginia Beach never took on a major wave of new supply. The market stayed relatively insulated from the national softness of the past few years; it posted positive rent growth through 2025 even as the national index was slipping, and that growth has only accelerated since. Steady, well-funded demand from the region’s military bases, anchored by Naval Station Norfolk, has kept the market tight, making Virginia Beach a foil to the oversupplied Sun Belt this year.
Top risers & fallers
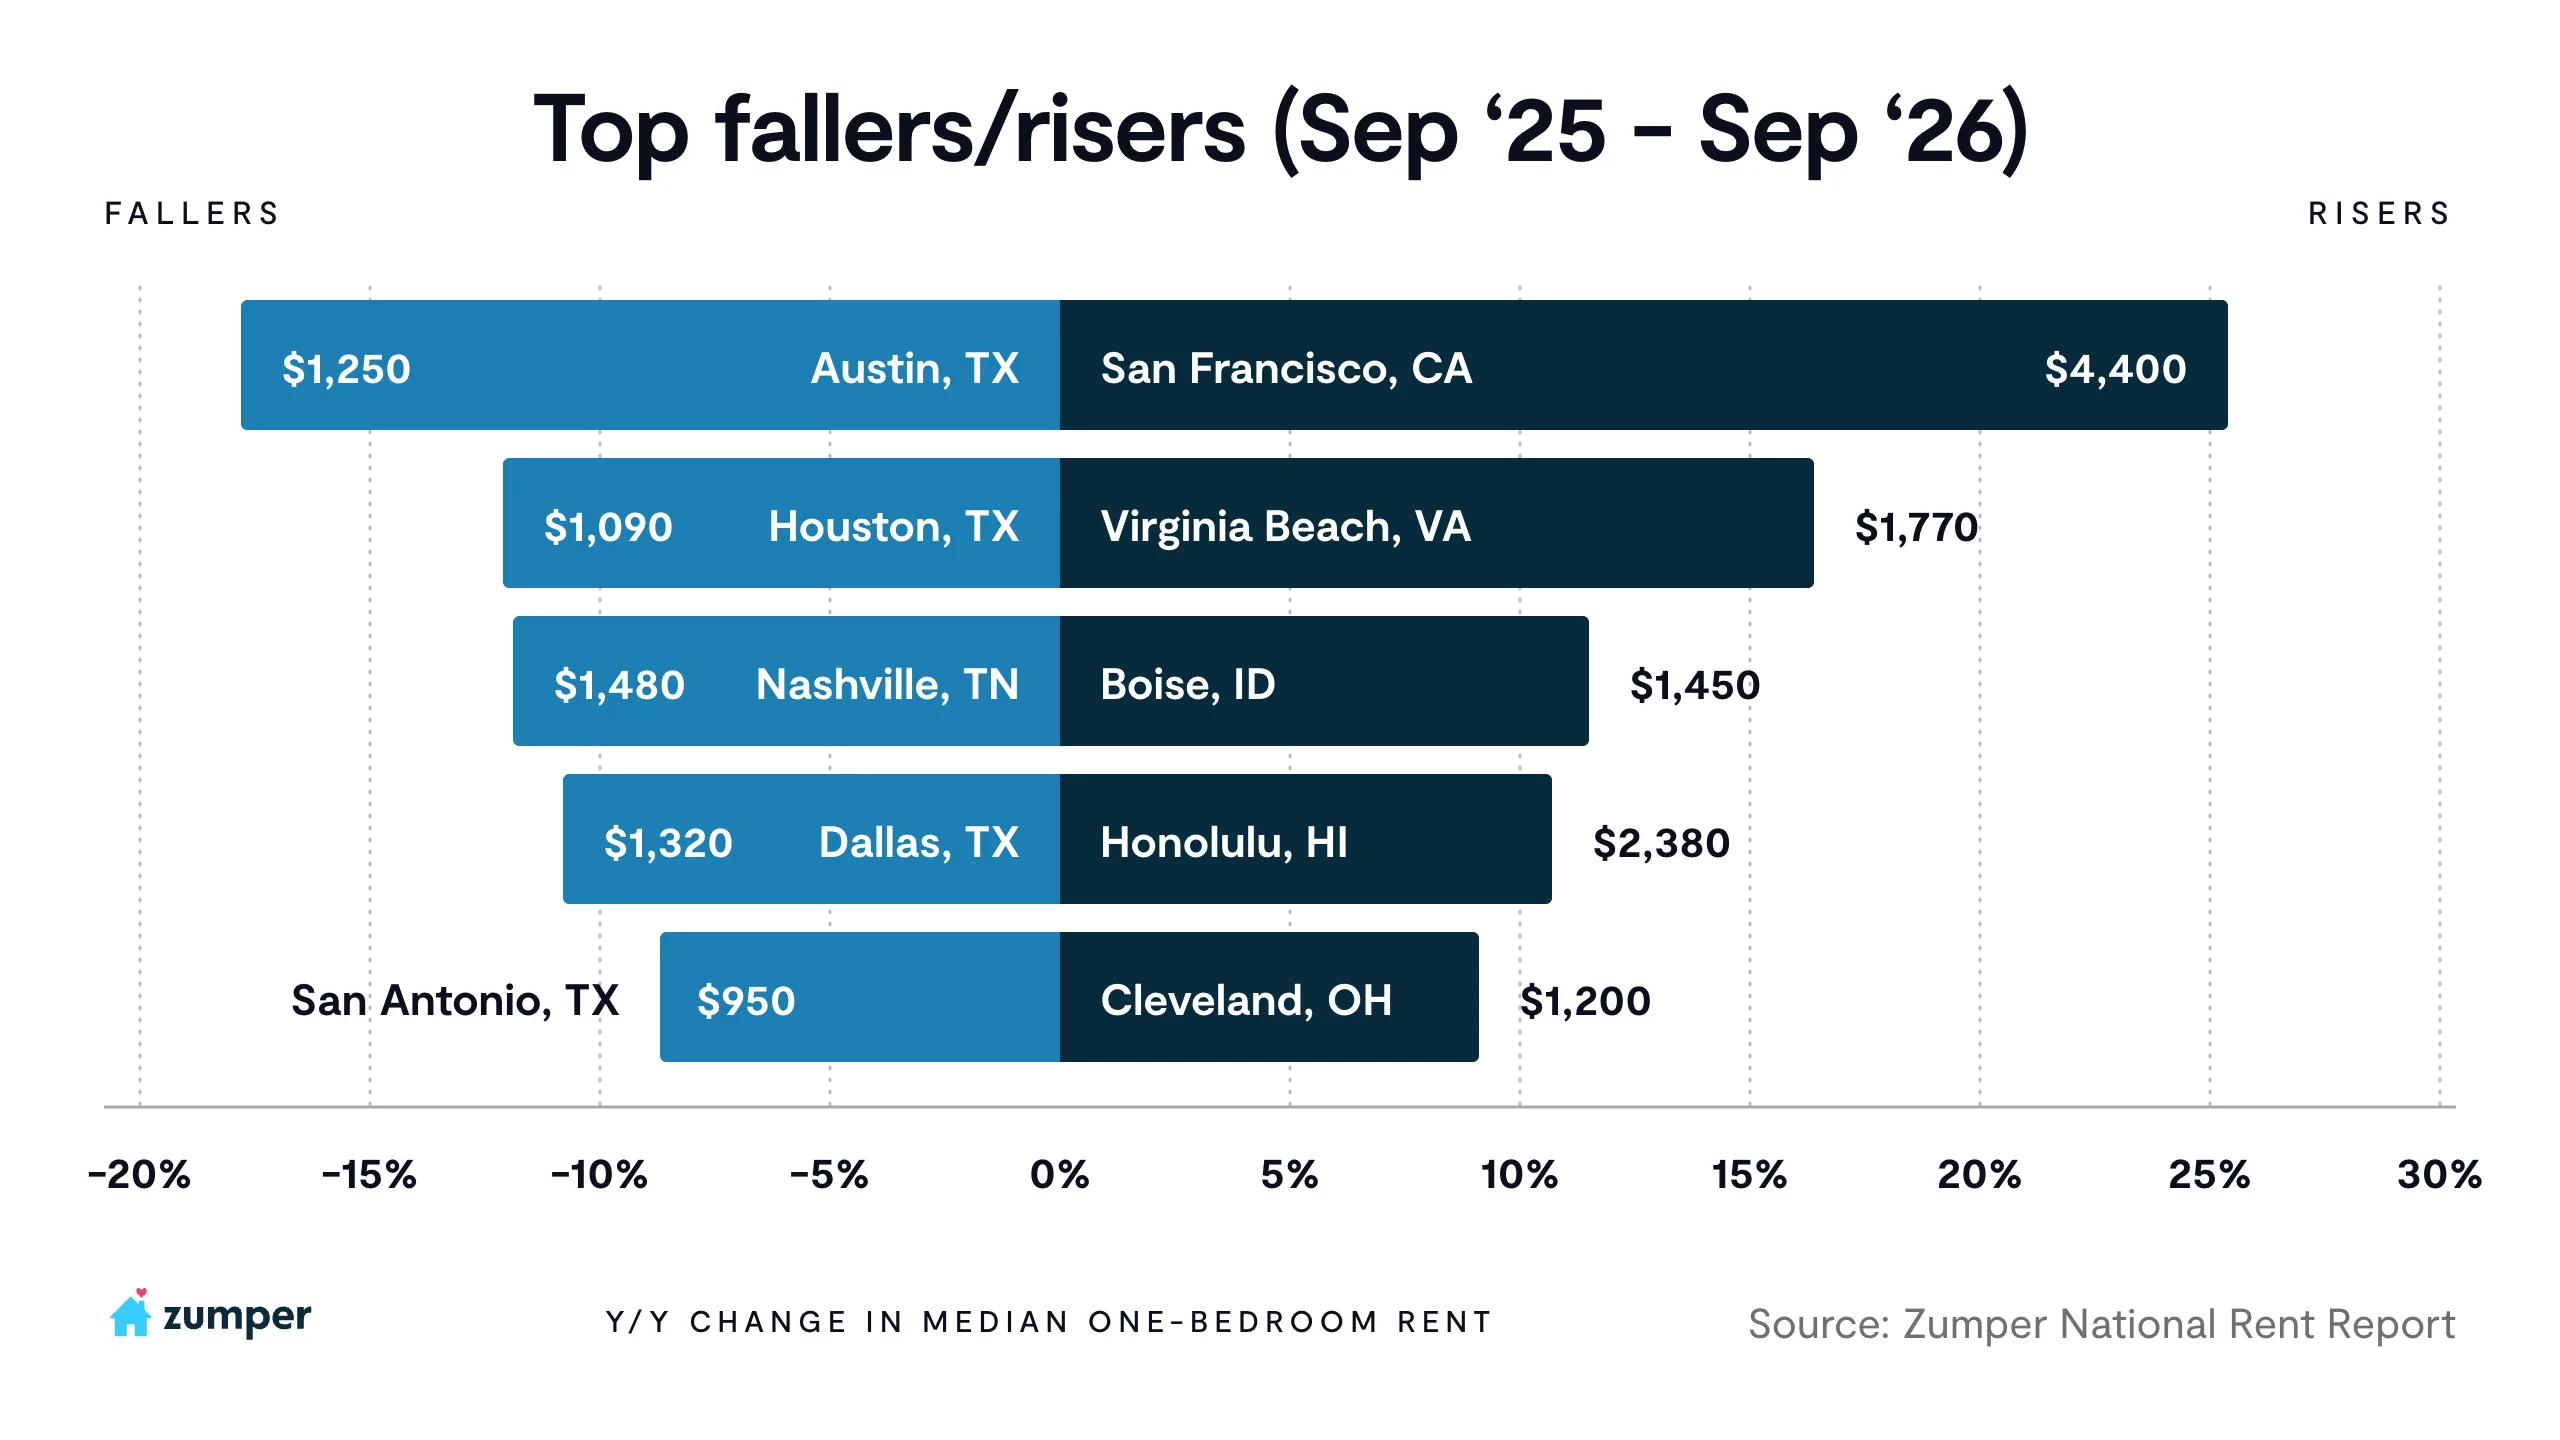
Texas continues to dominate the list of steepest decliners, claiming four of the five biggest annual drops: Austin (-17.8%), Houston (-12.1%), Dallas (-10.8%), and San Antonio (-8.7%). Nashville (-11.9%) rounds out the top five, still working through a construction wave of its own. All five are still absorbing supply delivered over the past few years.
Meanwhile, the thread tying the biggest gainers together is limited new supply, though it shows up differently market to market. San Francisco and Virginia Beach never took on the kind of construction wave hitting Texas; both have stayed comparatively tight for years. Boise tells a different version of the same story as its inventory boom peaked back in 2022, and with construction now down from that high, the market has had a few years to absorb it. Austin’s wave crested more recently, which helps explain why one market is now a riser and the other is still near the bottom of its cycle. Honolulu and Cleveland round out the top five.
FAQ
What is the Zumper National Rent Index?
It’s Zumper’s monthly snapshot of what renters are paying across the country. We track median asking rents for one and two-bedroom apartments in the 100 largest U.S. cities.
What is the national median rent as of September 2026?
$1,518 for a one-bedroom and $1,903 for a two-bedroom.
Which city has the highest one-bedroom rent in the country?
New York City, with rent at $4,580.
Why is San Francisco rent rising so quickly?
AI-sector hiring has created a lot of new demand in a city with very little new supply.
Why are Texas rents falling so sharply?
Texas cities built an enormous amount of new housing over the past few years, and that supply is still being absorbed.
Which cities are seeing the steepest rent declines?
Austin (-17.8%), Houston (-12.1%), and Nashville (-11.9%) are September’s steepest annual decliners.
Which cities are seeing the biggest rent increases?
San Francisco (+25.4%), Virginia Beach (+16.4%), and Boise (+11.5%) lead the country in annual rent growth this month.
Is the national rental market recovering?
It’s headed that way, but slowly. September marks the first time both one and two-bedroom rents have been positive year-over-year at the same time since May 2025.
How often is the Zumper National Rent Report updated?
Every month, using the latest listing data from that period.
Methodology
The Zumper National Rent Report analyzes rental data from over 1 million active listings across the United States. Data is aggregated on a monthly basis to calculate median asking rents for the top 100 cities by population, providing a comprehensive view of the current state of the market. The report is based on all data available in the month of publication.
If you’re interested in a more in-depth explanation of how and why we calculate our rent data, view our methodology post.