Notable Trends
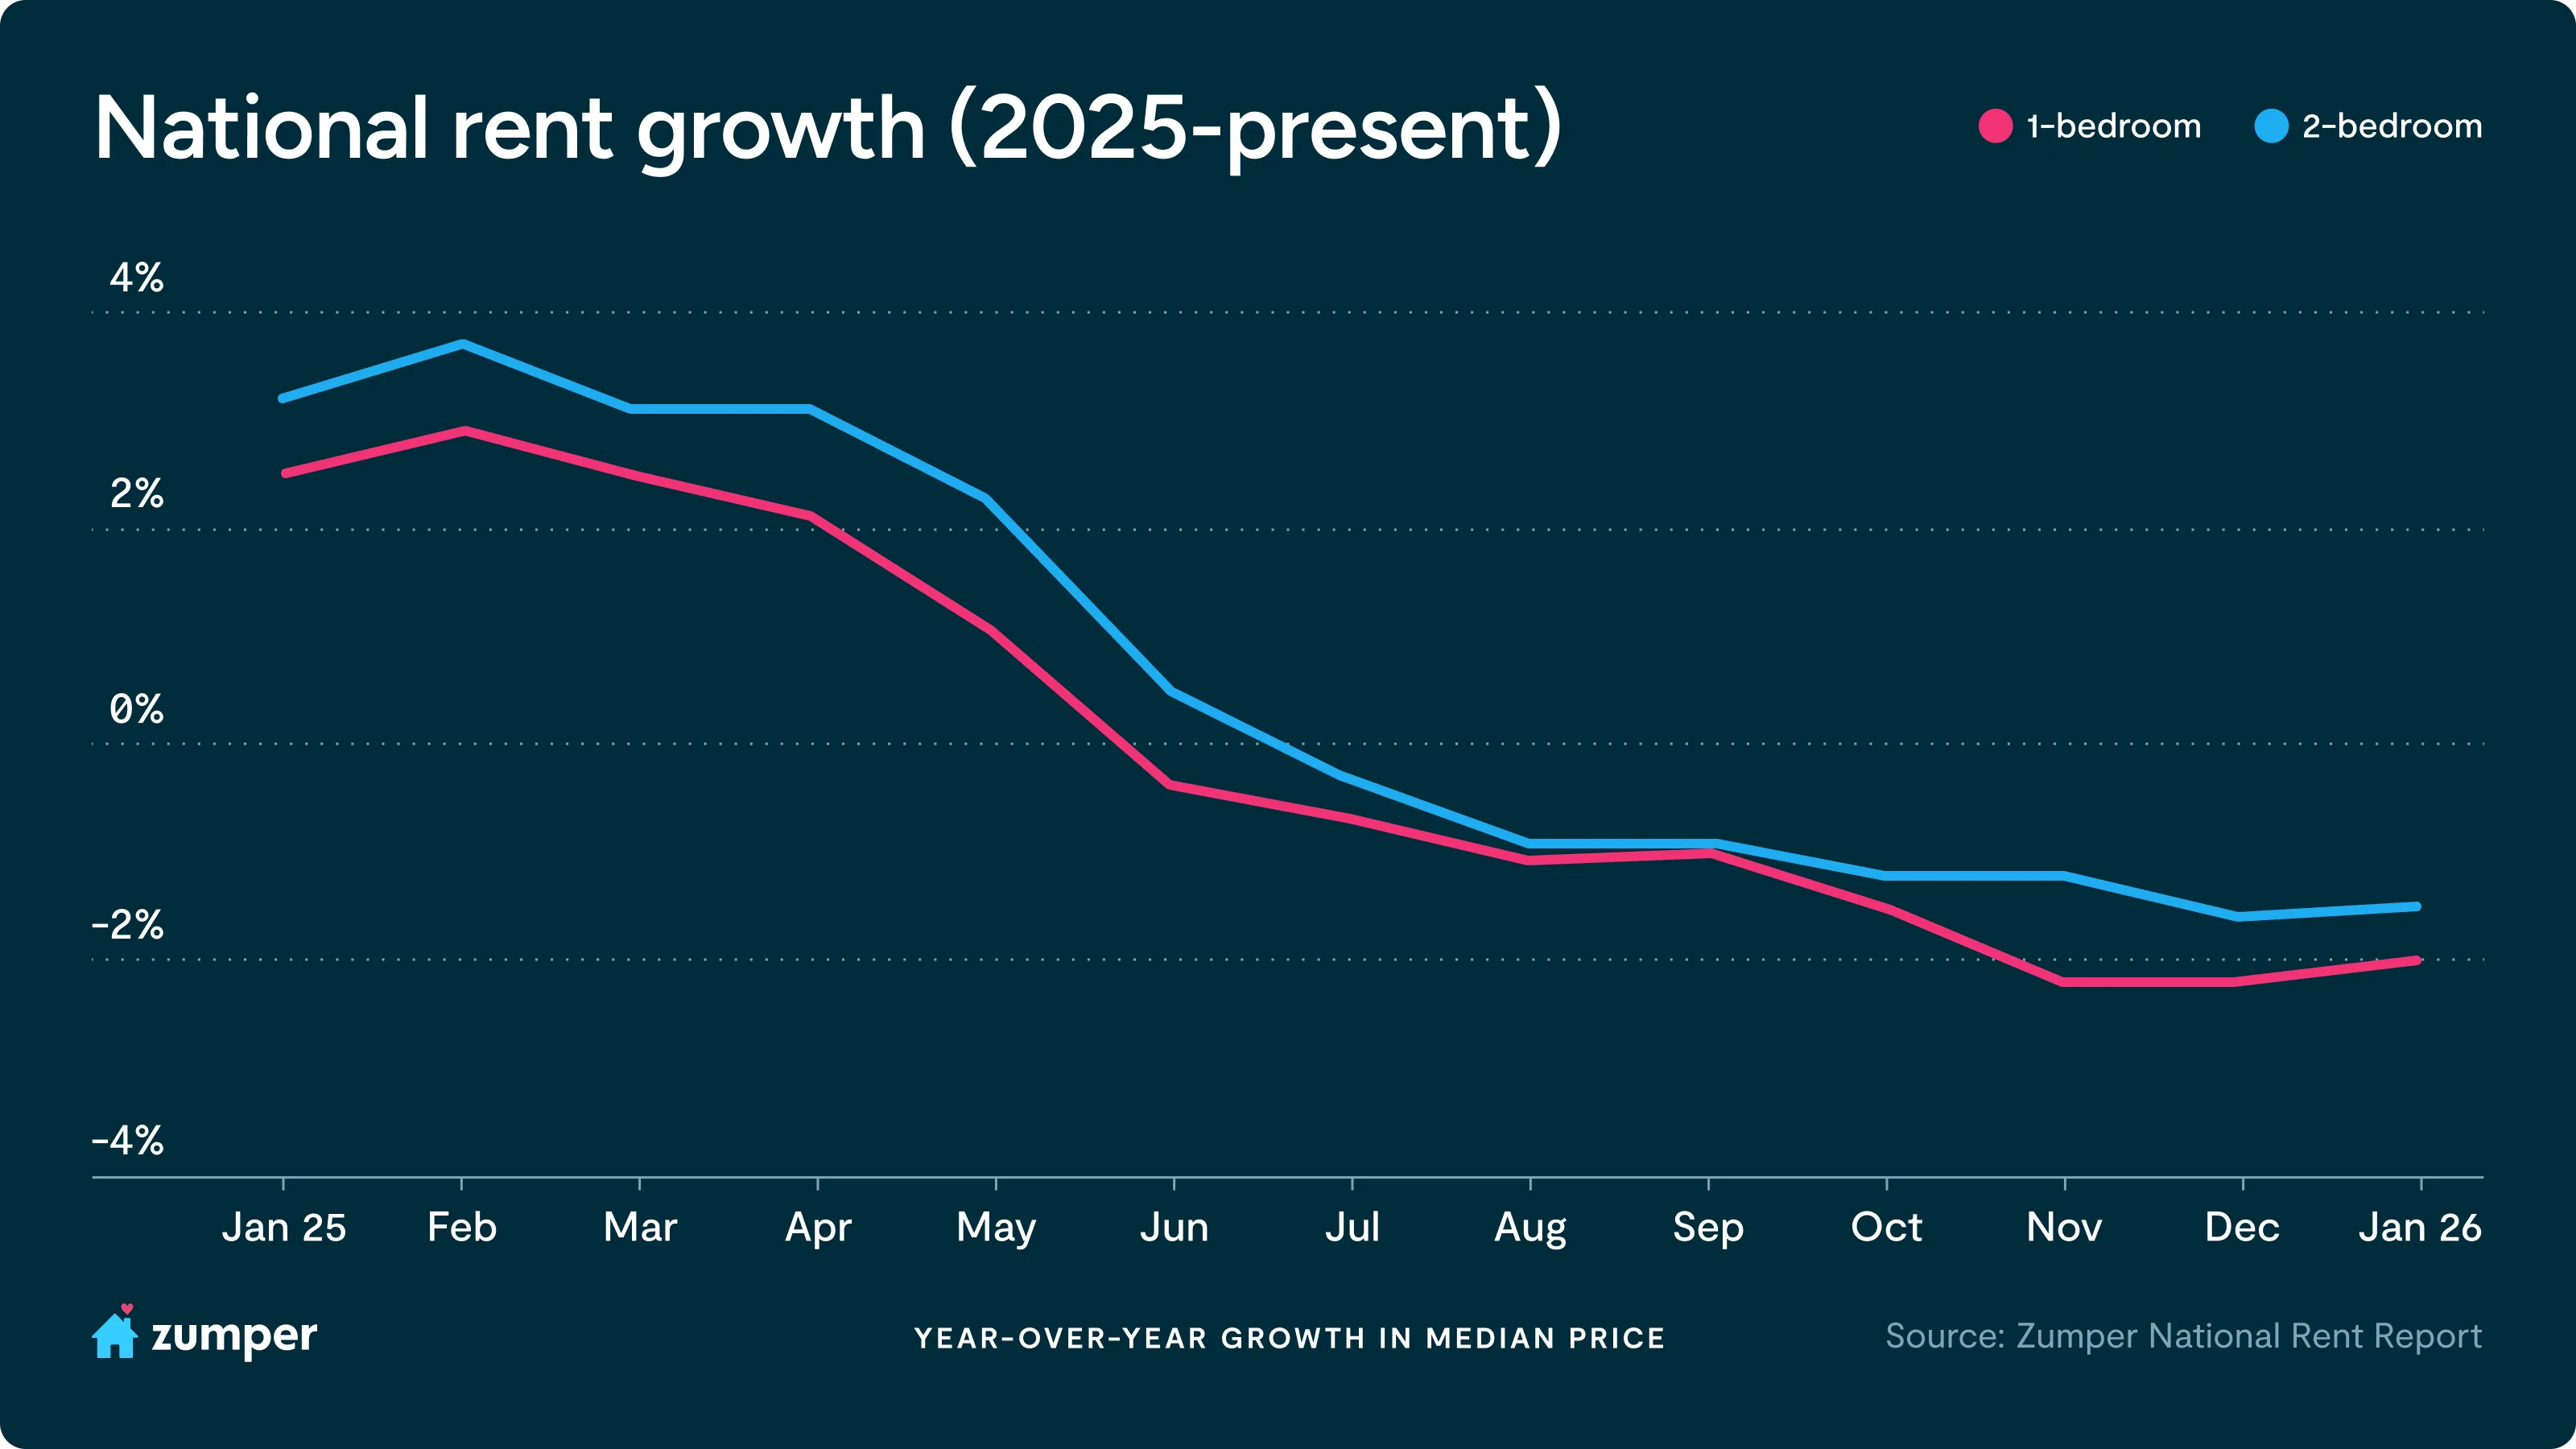
- Zumper’s National Rent Index showed continued softness entering the new year: one-bedroom median rent fell 0.1% month-over-month to $1,503, while two-bedrooms inched up 0.2% to $1,879. On an annual basis, one and two-bedroom rents are down 2% and 1.5%, respectively.
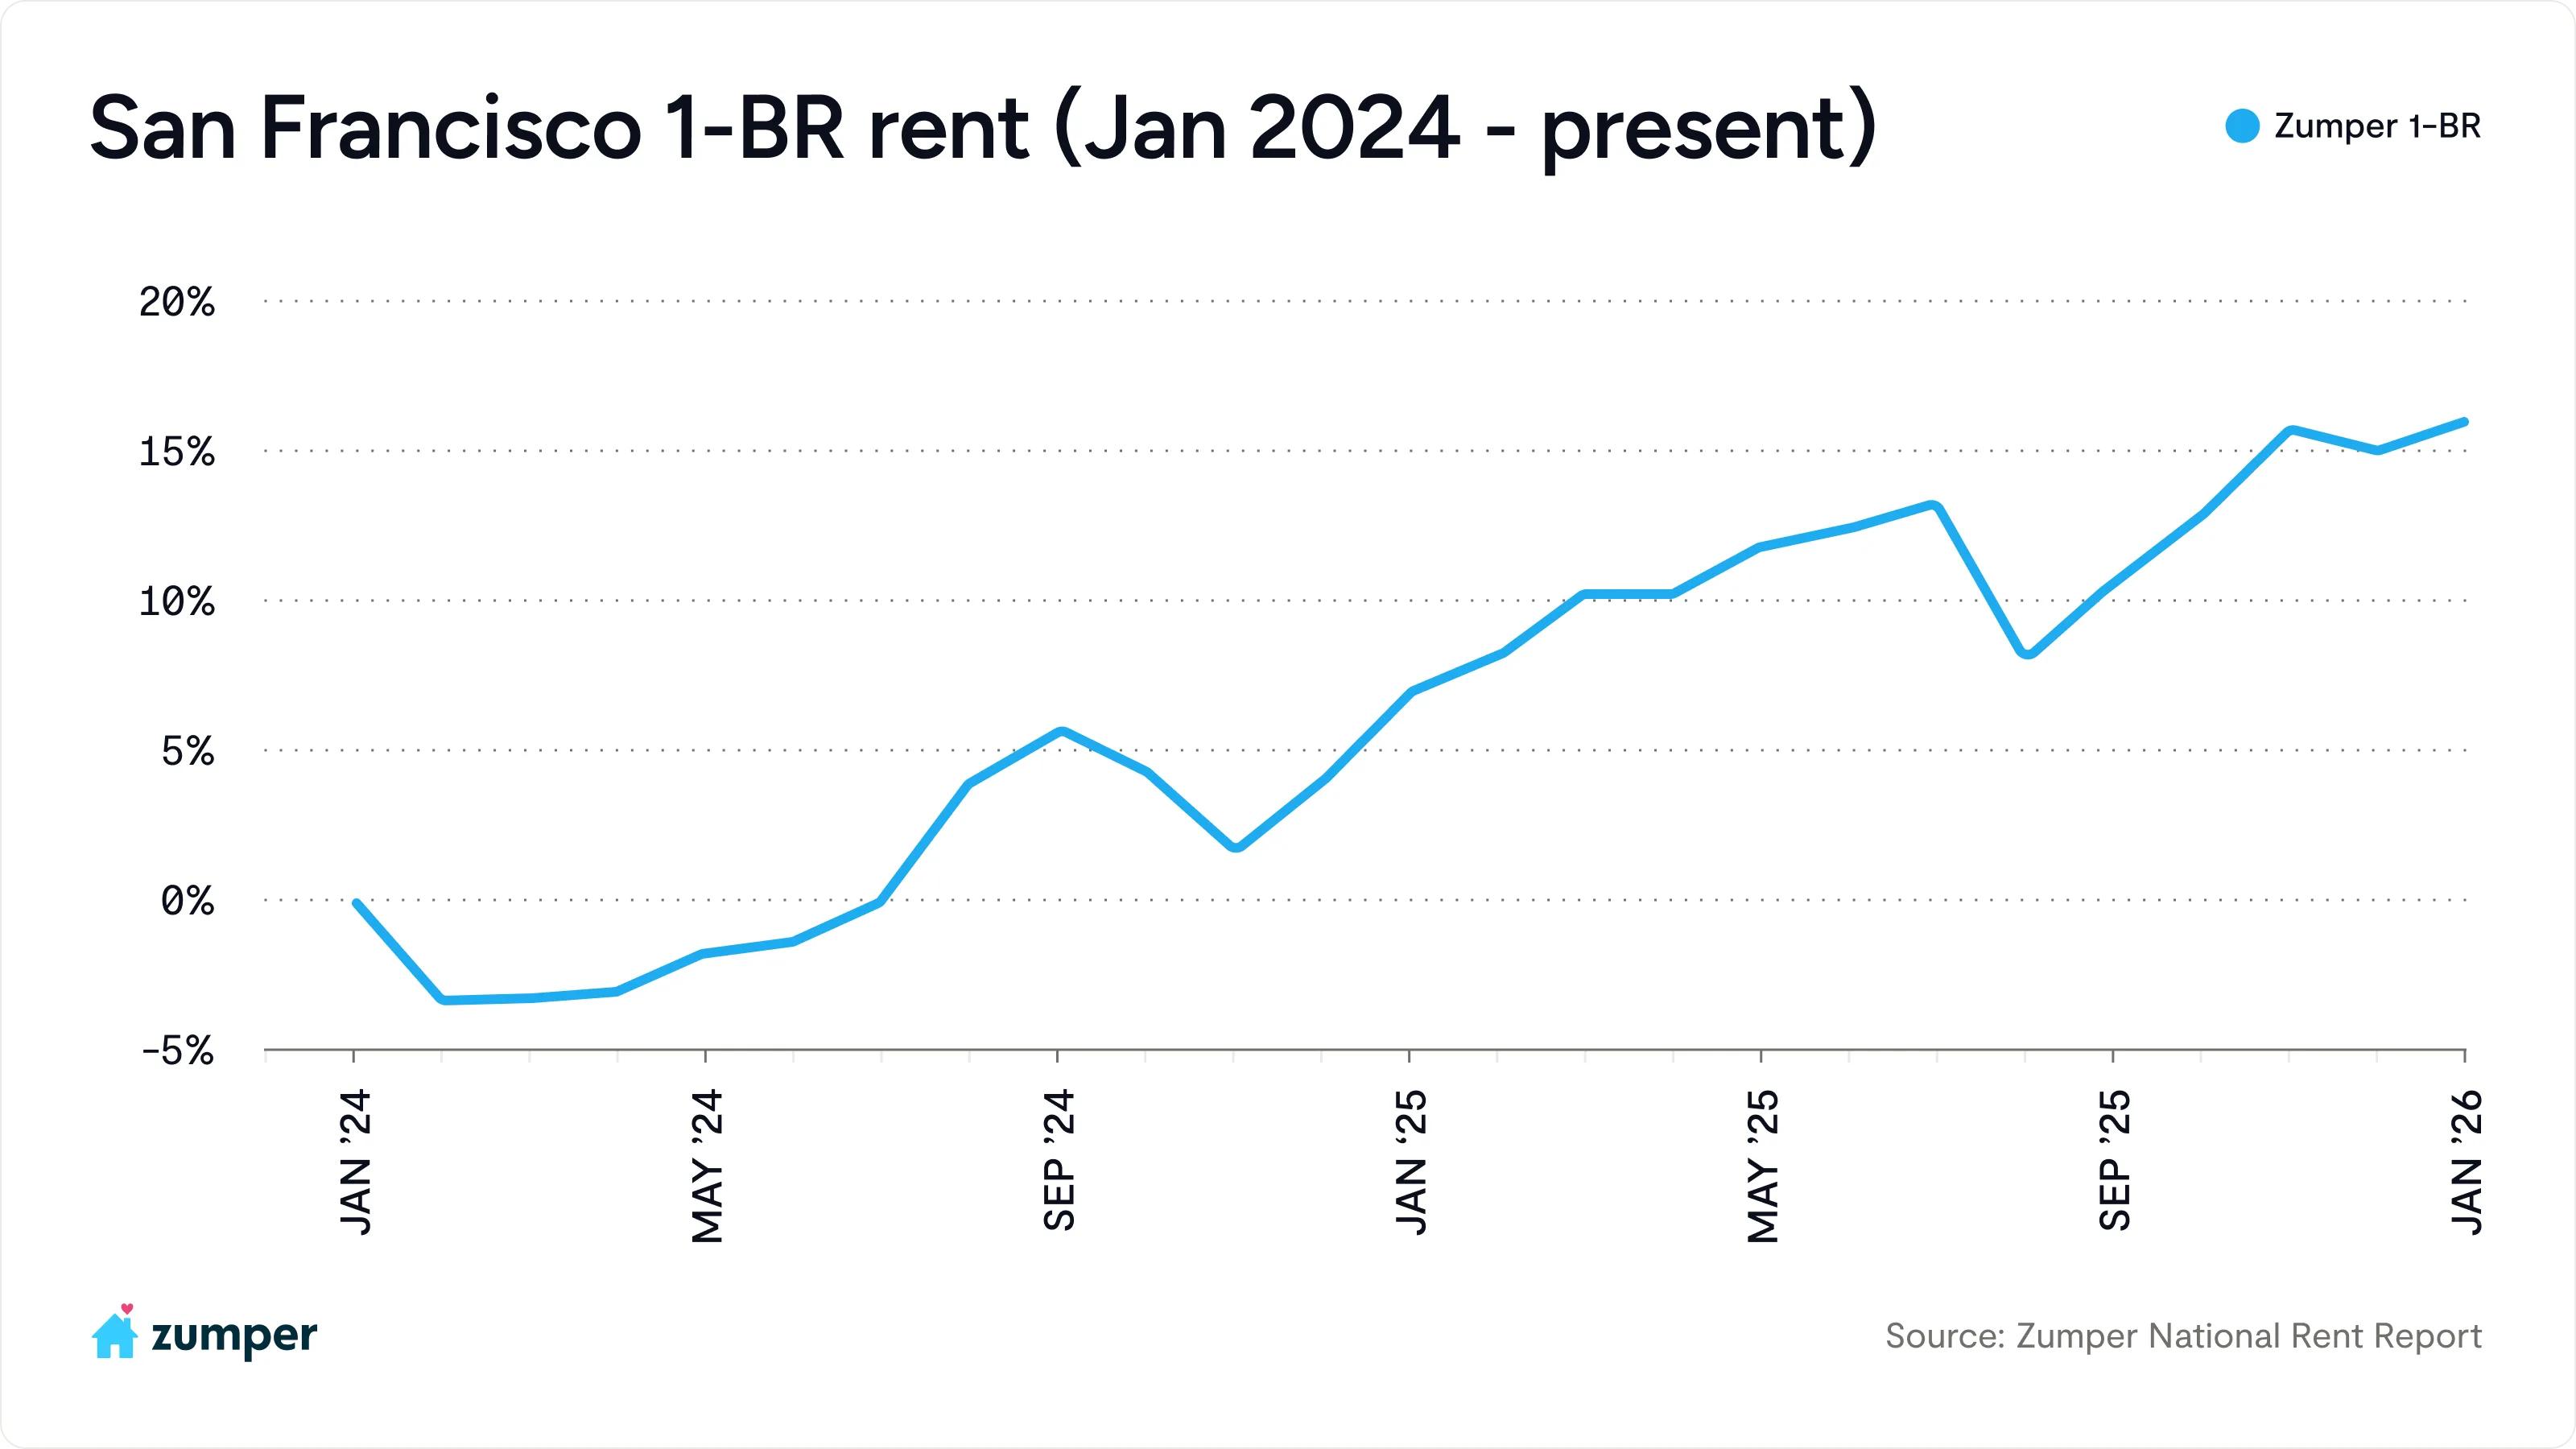
- San Francisco recorded its largest annual rent growth since Zumper began tracking rental trends over a decade ago, with one-bedroom rent rising 16.1% and two-bedrooms surging 19%.
- San Francisco is rapidly closing the gap with New York City at the top of the market, with two-bedroom rent now just $130 below New York’s, setting the stage for San Francisco to overtake New York as the most expensive two-bedroom market if current month-over-month trends persist.
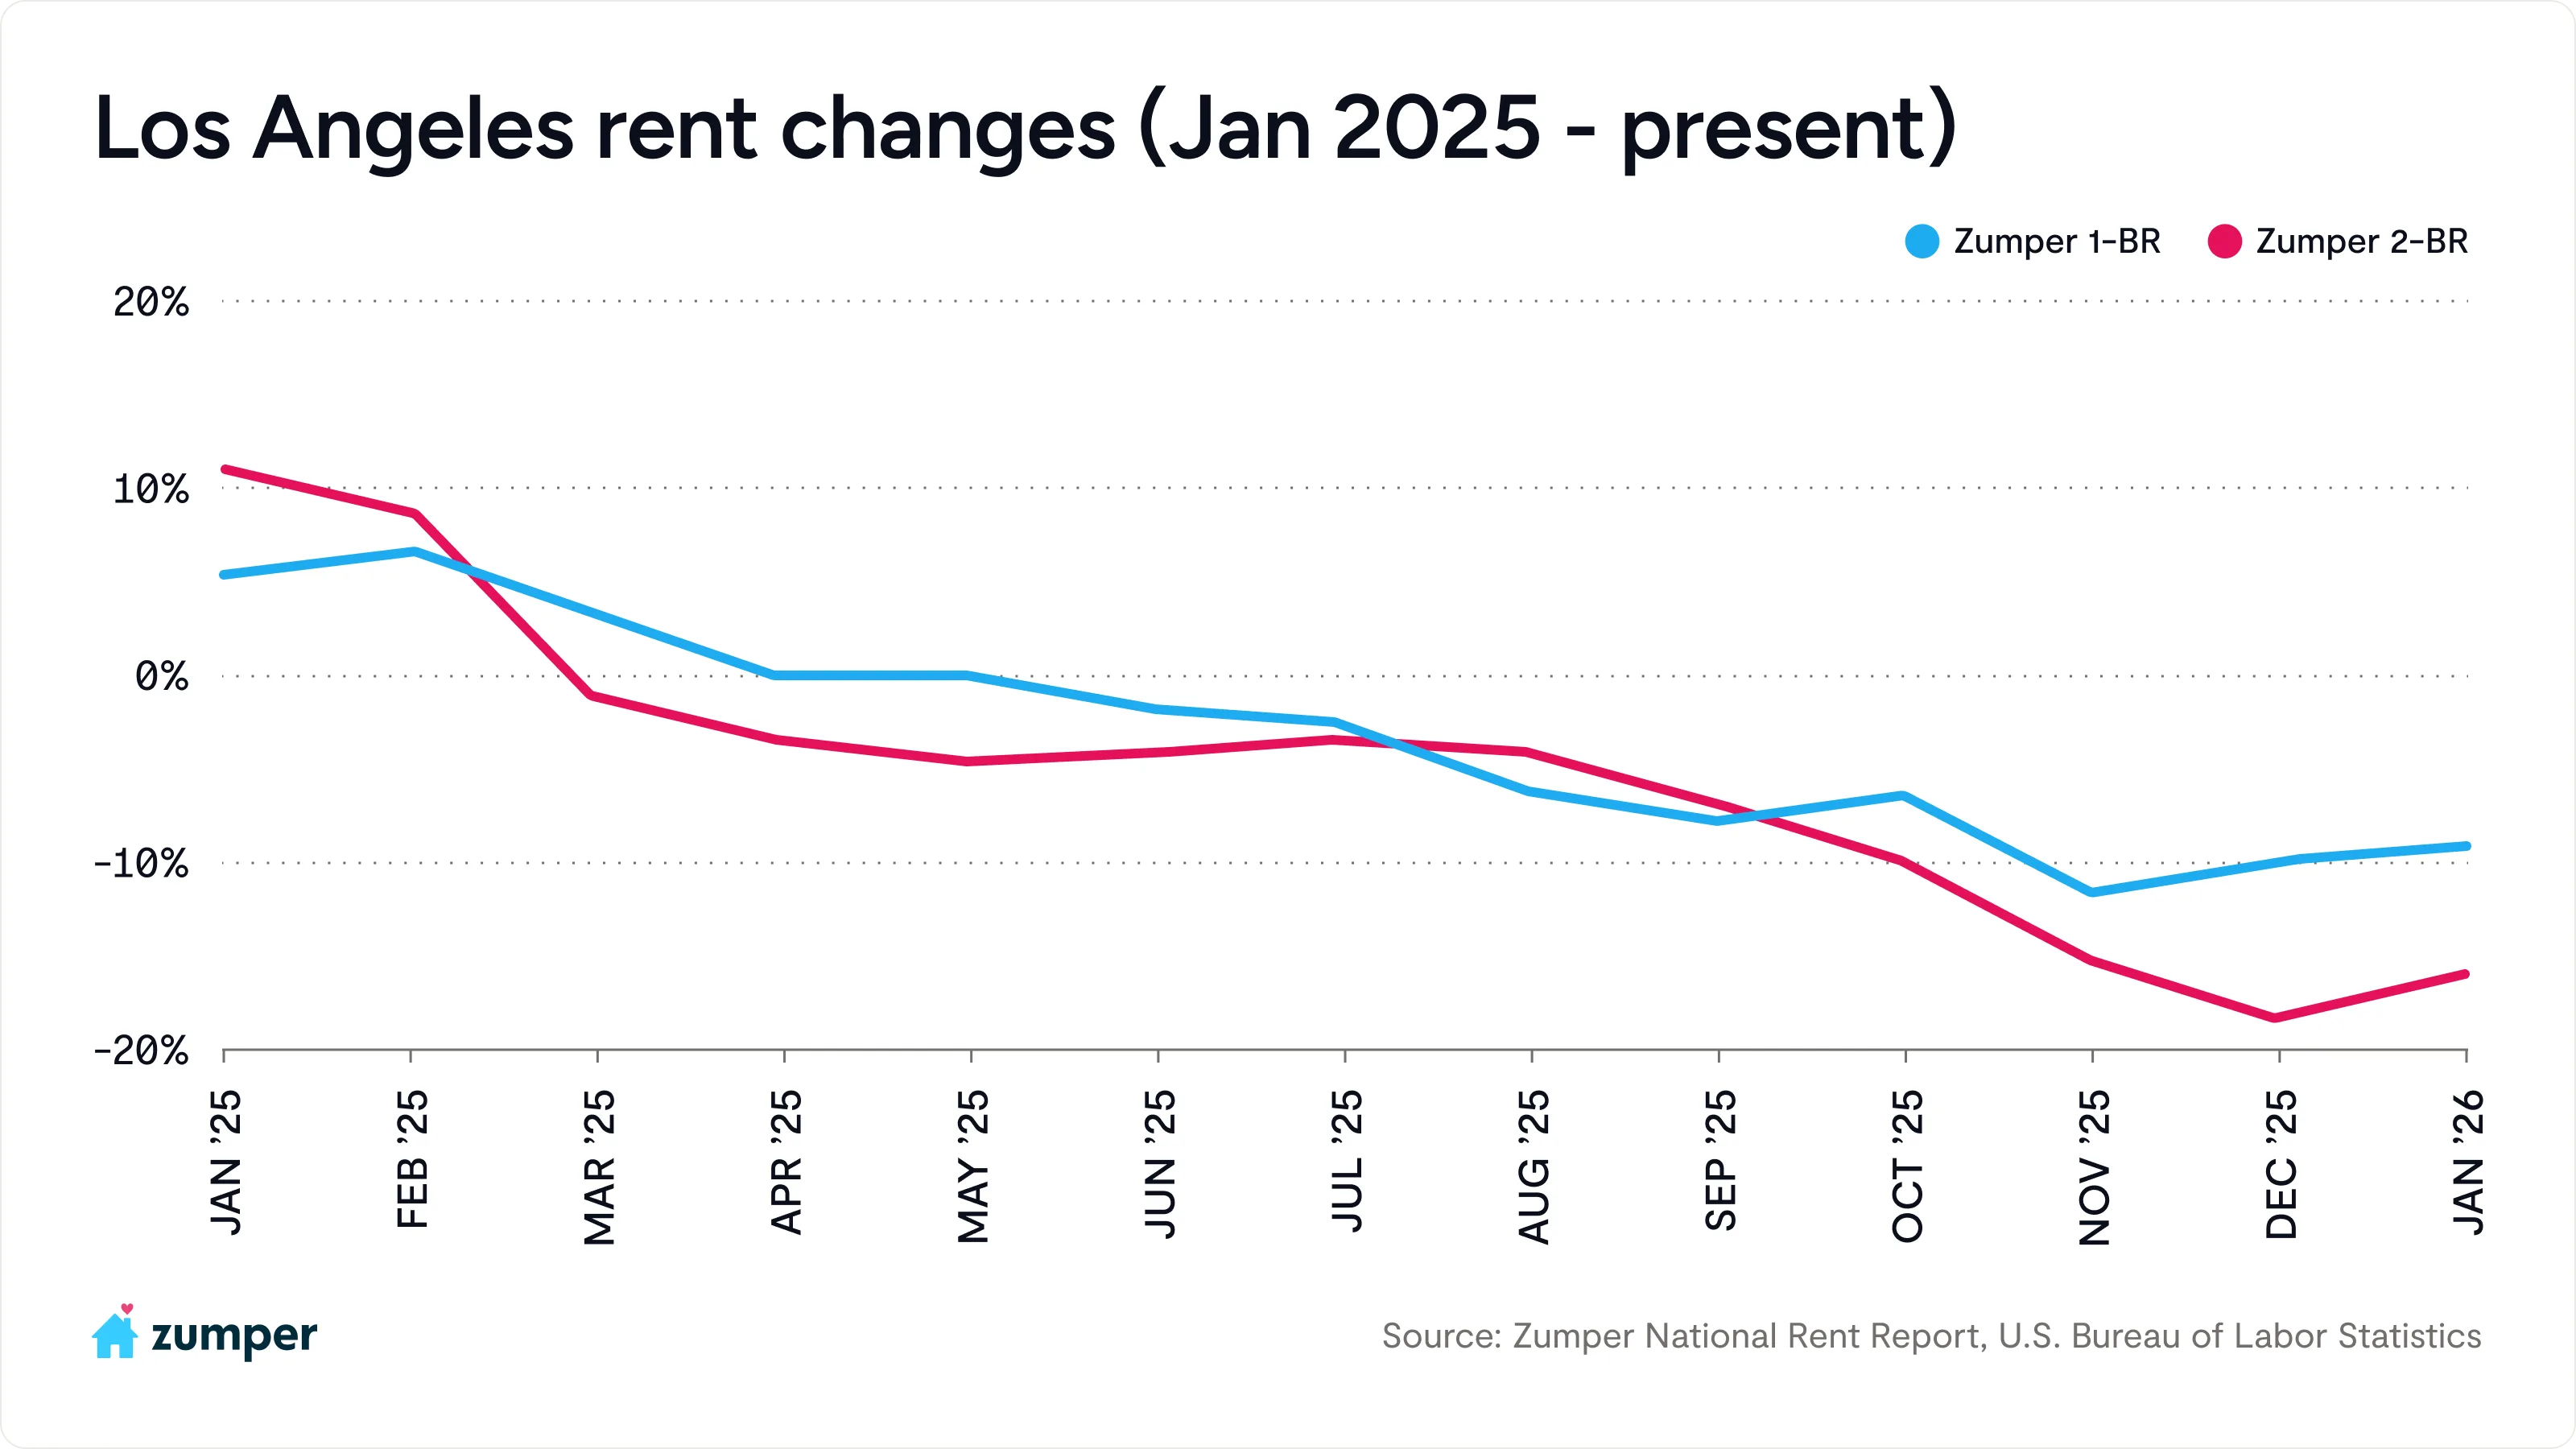
- Los Angeles posted its 10th consecutive month of flat or declining annual rents, with one-bedroom rent down 9.1% and two-bedrooms decreasing 15.9%.

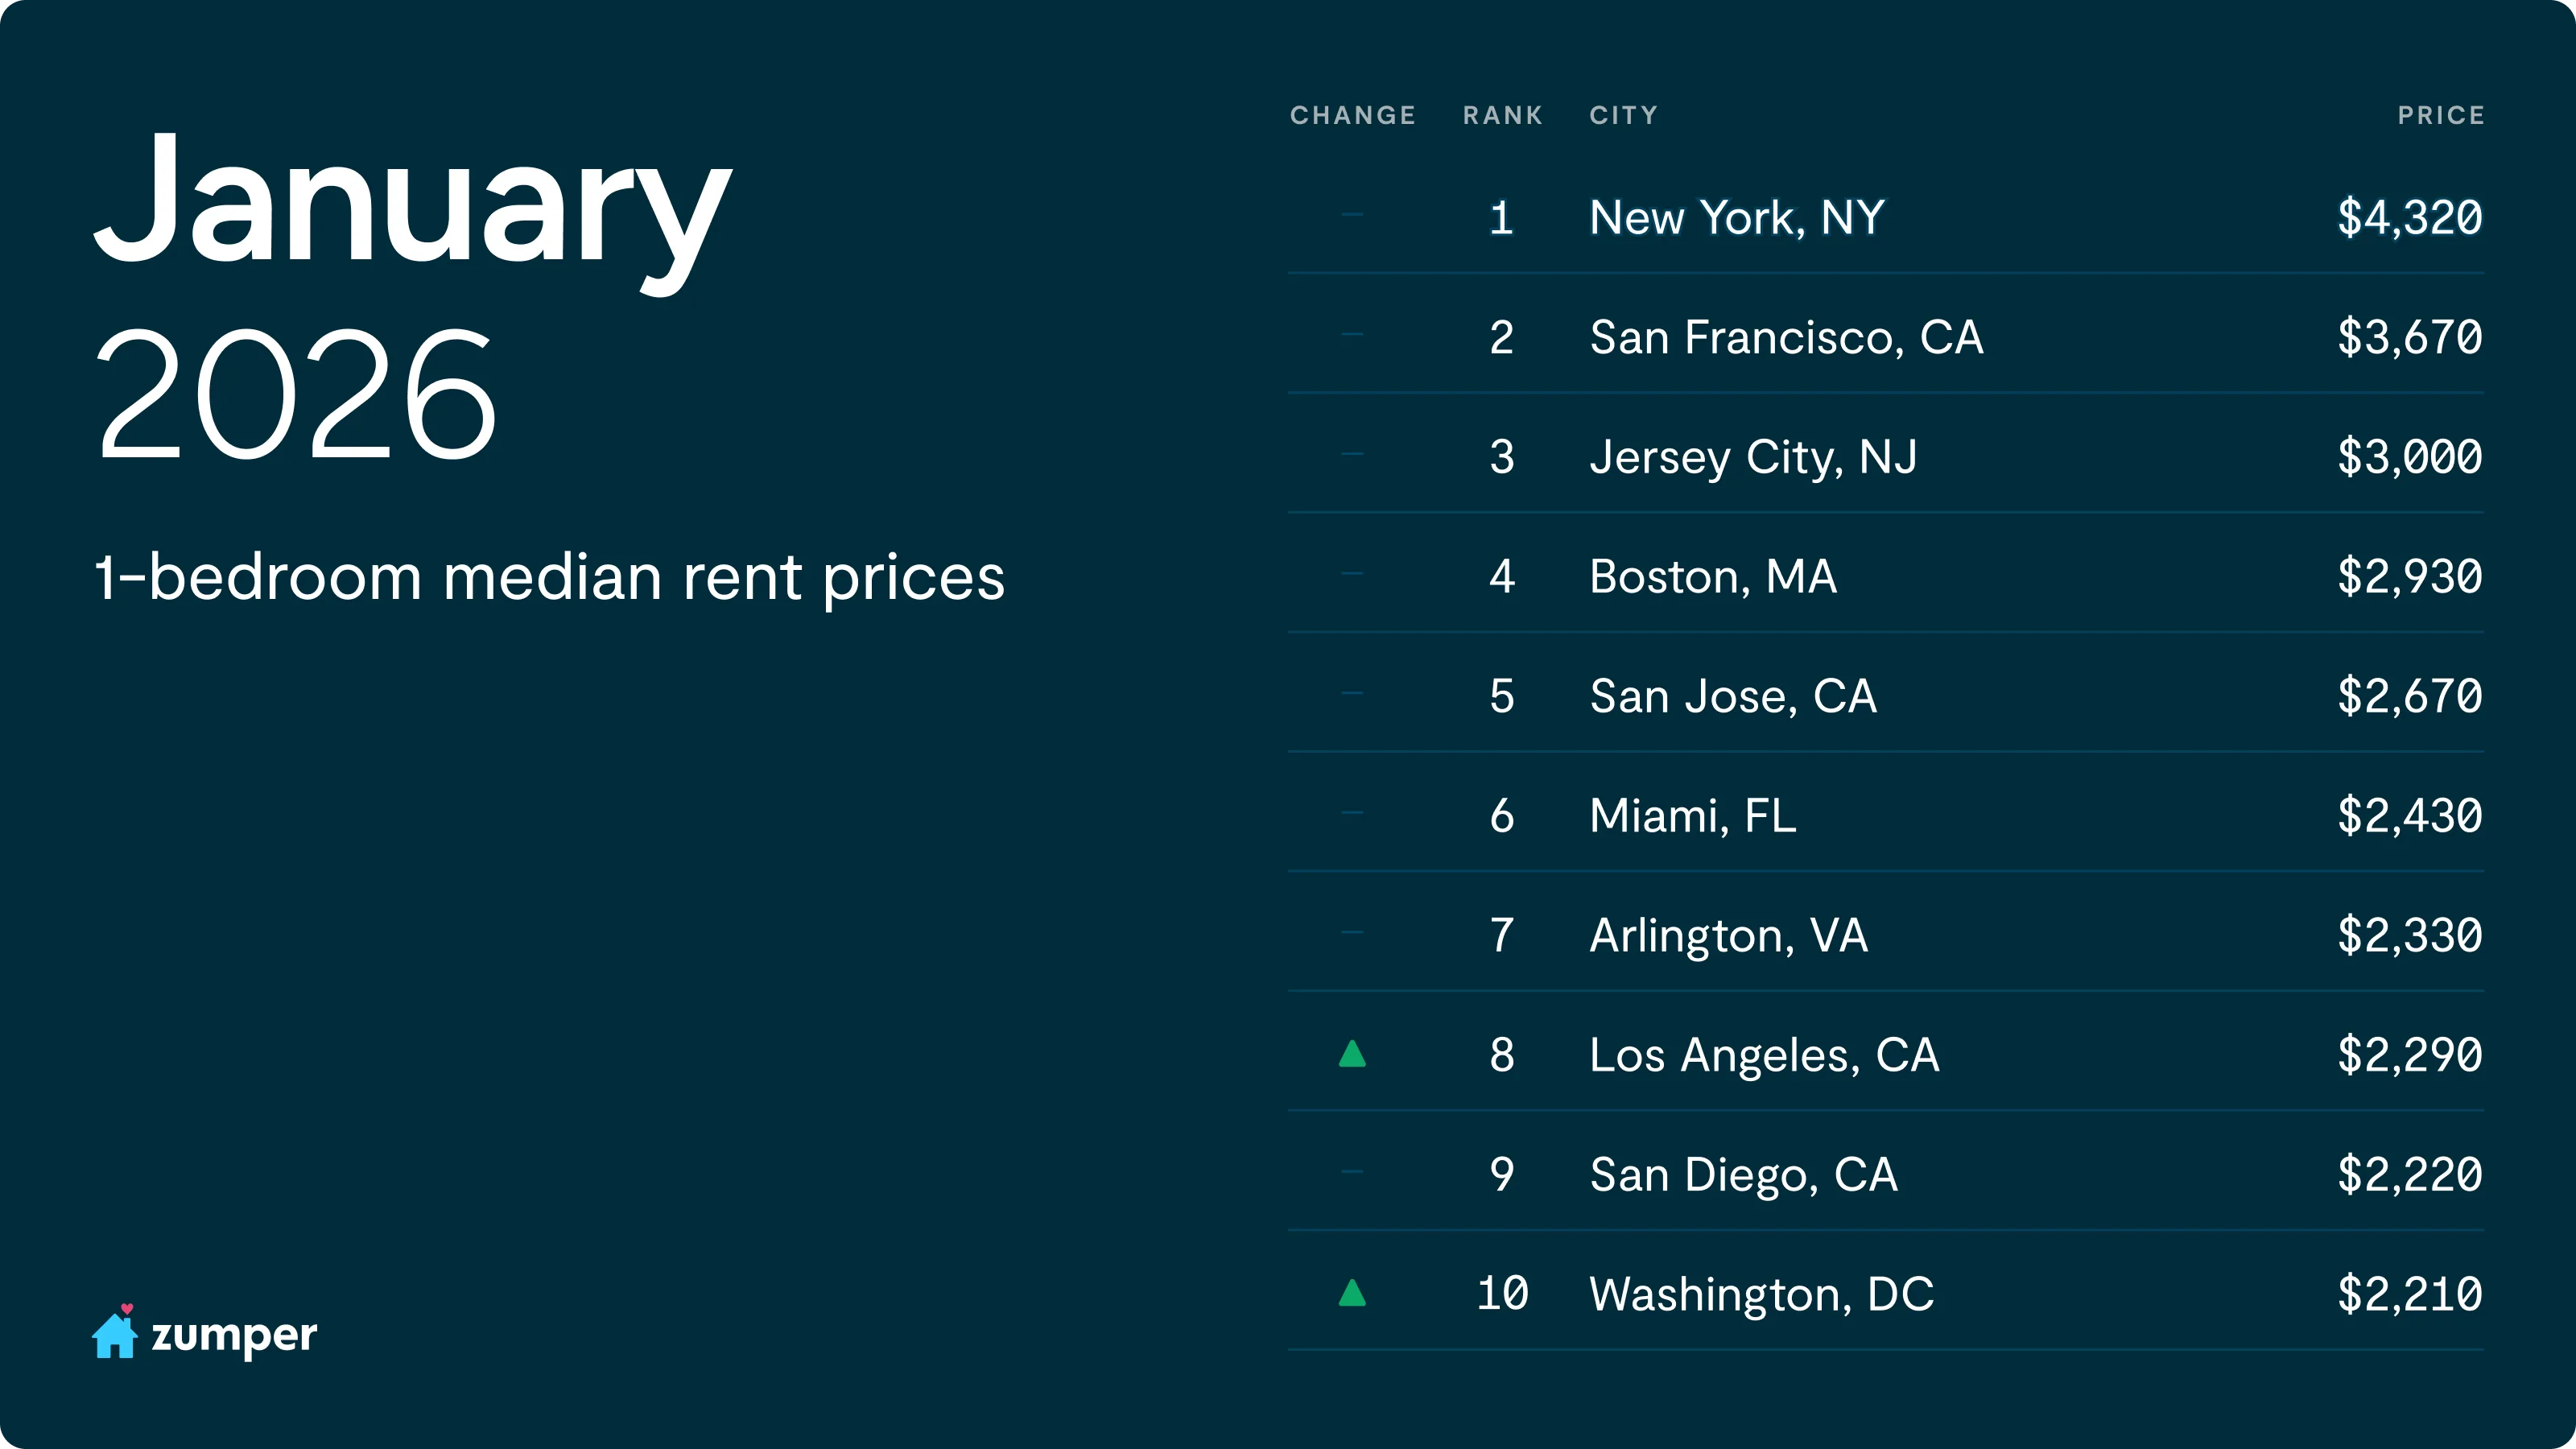
At the top, New York City began 2026 retaining its position as the nation’s most expensive rental market. San Francisco followed closely as the second-priciest city, posting the second-fastest annual rent growth in the country. Notably, median two-bedroom rent in San Francisco now sits only $130 below New York City’s. If current month-over-month trends persist, San Francisco could overtake New York City on two-bedroom pricing as soon as next month. Elsewhere among the most expensive markets, Washington, D.C. re-entered the top 10, while Honolulu slipped out.
National rent index continues expected cooling

According to Zumper’s National Rent Index, median one-bedroom rent fell 0.1% month-over-month to $1,503, while two-bedrooms inched up 0.2% to $1,879. On an annual basis, rents remain in negative territory, down 2% for one-bedrooms and 1.5% for two-bedrooms, highlighting the continued softness in national prices.
This stagnation reflects an intersection of factors weighing on renter demand. Elevated interest rates continue to sideline many would-be homebuyers, while broader economic uncertainty and a softening labor market have slowed new household formation and mobility. Adding to that, the wave of new supply delivered over the past two years is still being absorbed in many large markets, extending lease-up timelines and limiting property owners’ pricing power, particularly during these seasonally slow months.
“The U.S. rental market is largely frozen right now, caught between elevated economic uncertainty and the normal seasonal slowdown we see in the winter months,” said Anthemos Georgiades, CEO of Zumper. “While new supply deliveries are set to ease in 2026, any rebound in rents is unlikely to be uniform. Markets that have already worked through excess inventory may see a faster snapback than what national averages suggest. The spring leasing season will offer a clearer signal of where the market is headed.”
As inflation continued to cool and the labor market showed more signs of softening than expected, the Federal Reserve pivoted toward supporting economic growth, delivering three quarter-point interest rate cuts in 2025. For a deeper look at how Zumper’s national rent data offers an early signal into where the CPI may be headed, read our full analysis: https://www.zumper.com/blog/zumper-consumer-price-index/
San Francisco posts largest recorded annual rent price growth rates

San Francisco recorded its largest annual rent growth since Zumper began tracking rental trends over a decade ago this January, with median one-bedroom rent rising 16.1% to $3,670 and two-bedroom rents surging 19% to $5,010. Much of this momentum is being powered by a renewed return-to-office push across the Bay Area’s tech sector, which is pulling higher-income workers back after several years of hybrid and remote flexibility, with some employers even offering rent stipends to employees for living within a 10 minute walk of the company’s office. At the same time, growing optimism about artificial intelligence has bolstered hiring expectations and boosted renter confidence, even amid broader economic uncertainty.
On the supply side, San Francisco’s long-standing zoning and development constraints continue to limit how quickly inventory can respond. With demand rebounding much faster than new housing is coming online, pricing pressure has intensified, pushing rents higher at a pace that now far outstrips national trends.
Los Angeles shows 10 consecutive months of flat or declining annual rents

Contrasting San Francisco, its southern neighbor, Los Angeles, saw one-bedroom rent drop 9.1% year-over-year to $2,290. In comparison, two-bedrooms fell an even steeper 15.9% to $3,110, marking the 10th consecutive month of either flat or declining annual rents for both bedrooms.
Major drivers of this declining trend are rising supply, as over 15k new rental units are set to be completed in Los Angeles by mid-2026, and weakening demand. The entertainment and media industry continues to contract after years of compounding shocks, from pandemic disruptions and the 2023 writers’ and actors’ strikes to deep cost-cutting across studios, networks, and streaming platforms. Recent waves of layoffs at major employers, including Paramount, NBCUniversal, and Warner Bros Discovery, have likely fueled out-migration among renters tied to Hollywood and adjacent sectors. At the same time, production has increasingly shifted to markets outside California. Despite the state’s expanded film and television tax credit program, near-term job recovery remains limited. Until the new surge of inventory is absorbed, hiring stabilizes, and production activity rebounds, rent growth in Los Angeles is likely to stay under downward pressure.
