


Key Takeaway: National rents held their gains for a second straight month, but the calm hides cities pulling in opposite directions. New York’s rents are up 5% as its first-ever rent freeze takes effect and San Francisco keeps setting records, while Aurora, San Antonio, and Durham are down more than 8% from a year ago.
Notable Trends
- The Zumper National Rent Index shows that one- and two-bedroom units have held their annual gains for the second consecutive month, with one-bedrooms up 0.5% to $1,519 and two-bedrooms climbing 0.7% to $1,901.
- San Francisco one-bedroom rent continues to hit another record high, now rising 26.2% annually to $4,430.
- New York City’s first rent freeze took effect this month in an already tight market, with one- and two-bedrooms both up about 5% year-over-year to settle at medians of $4,610 and $5,470, respectively.
- Chicago, Cleveland, and Akron lead the Midwest’s rent growth, all with one-bedroom rents increasing over 9% annually.
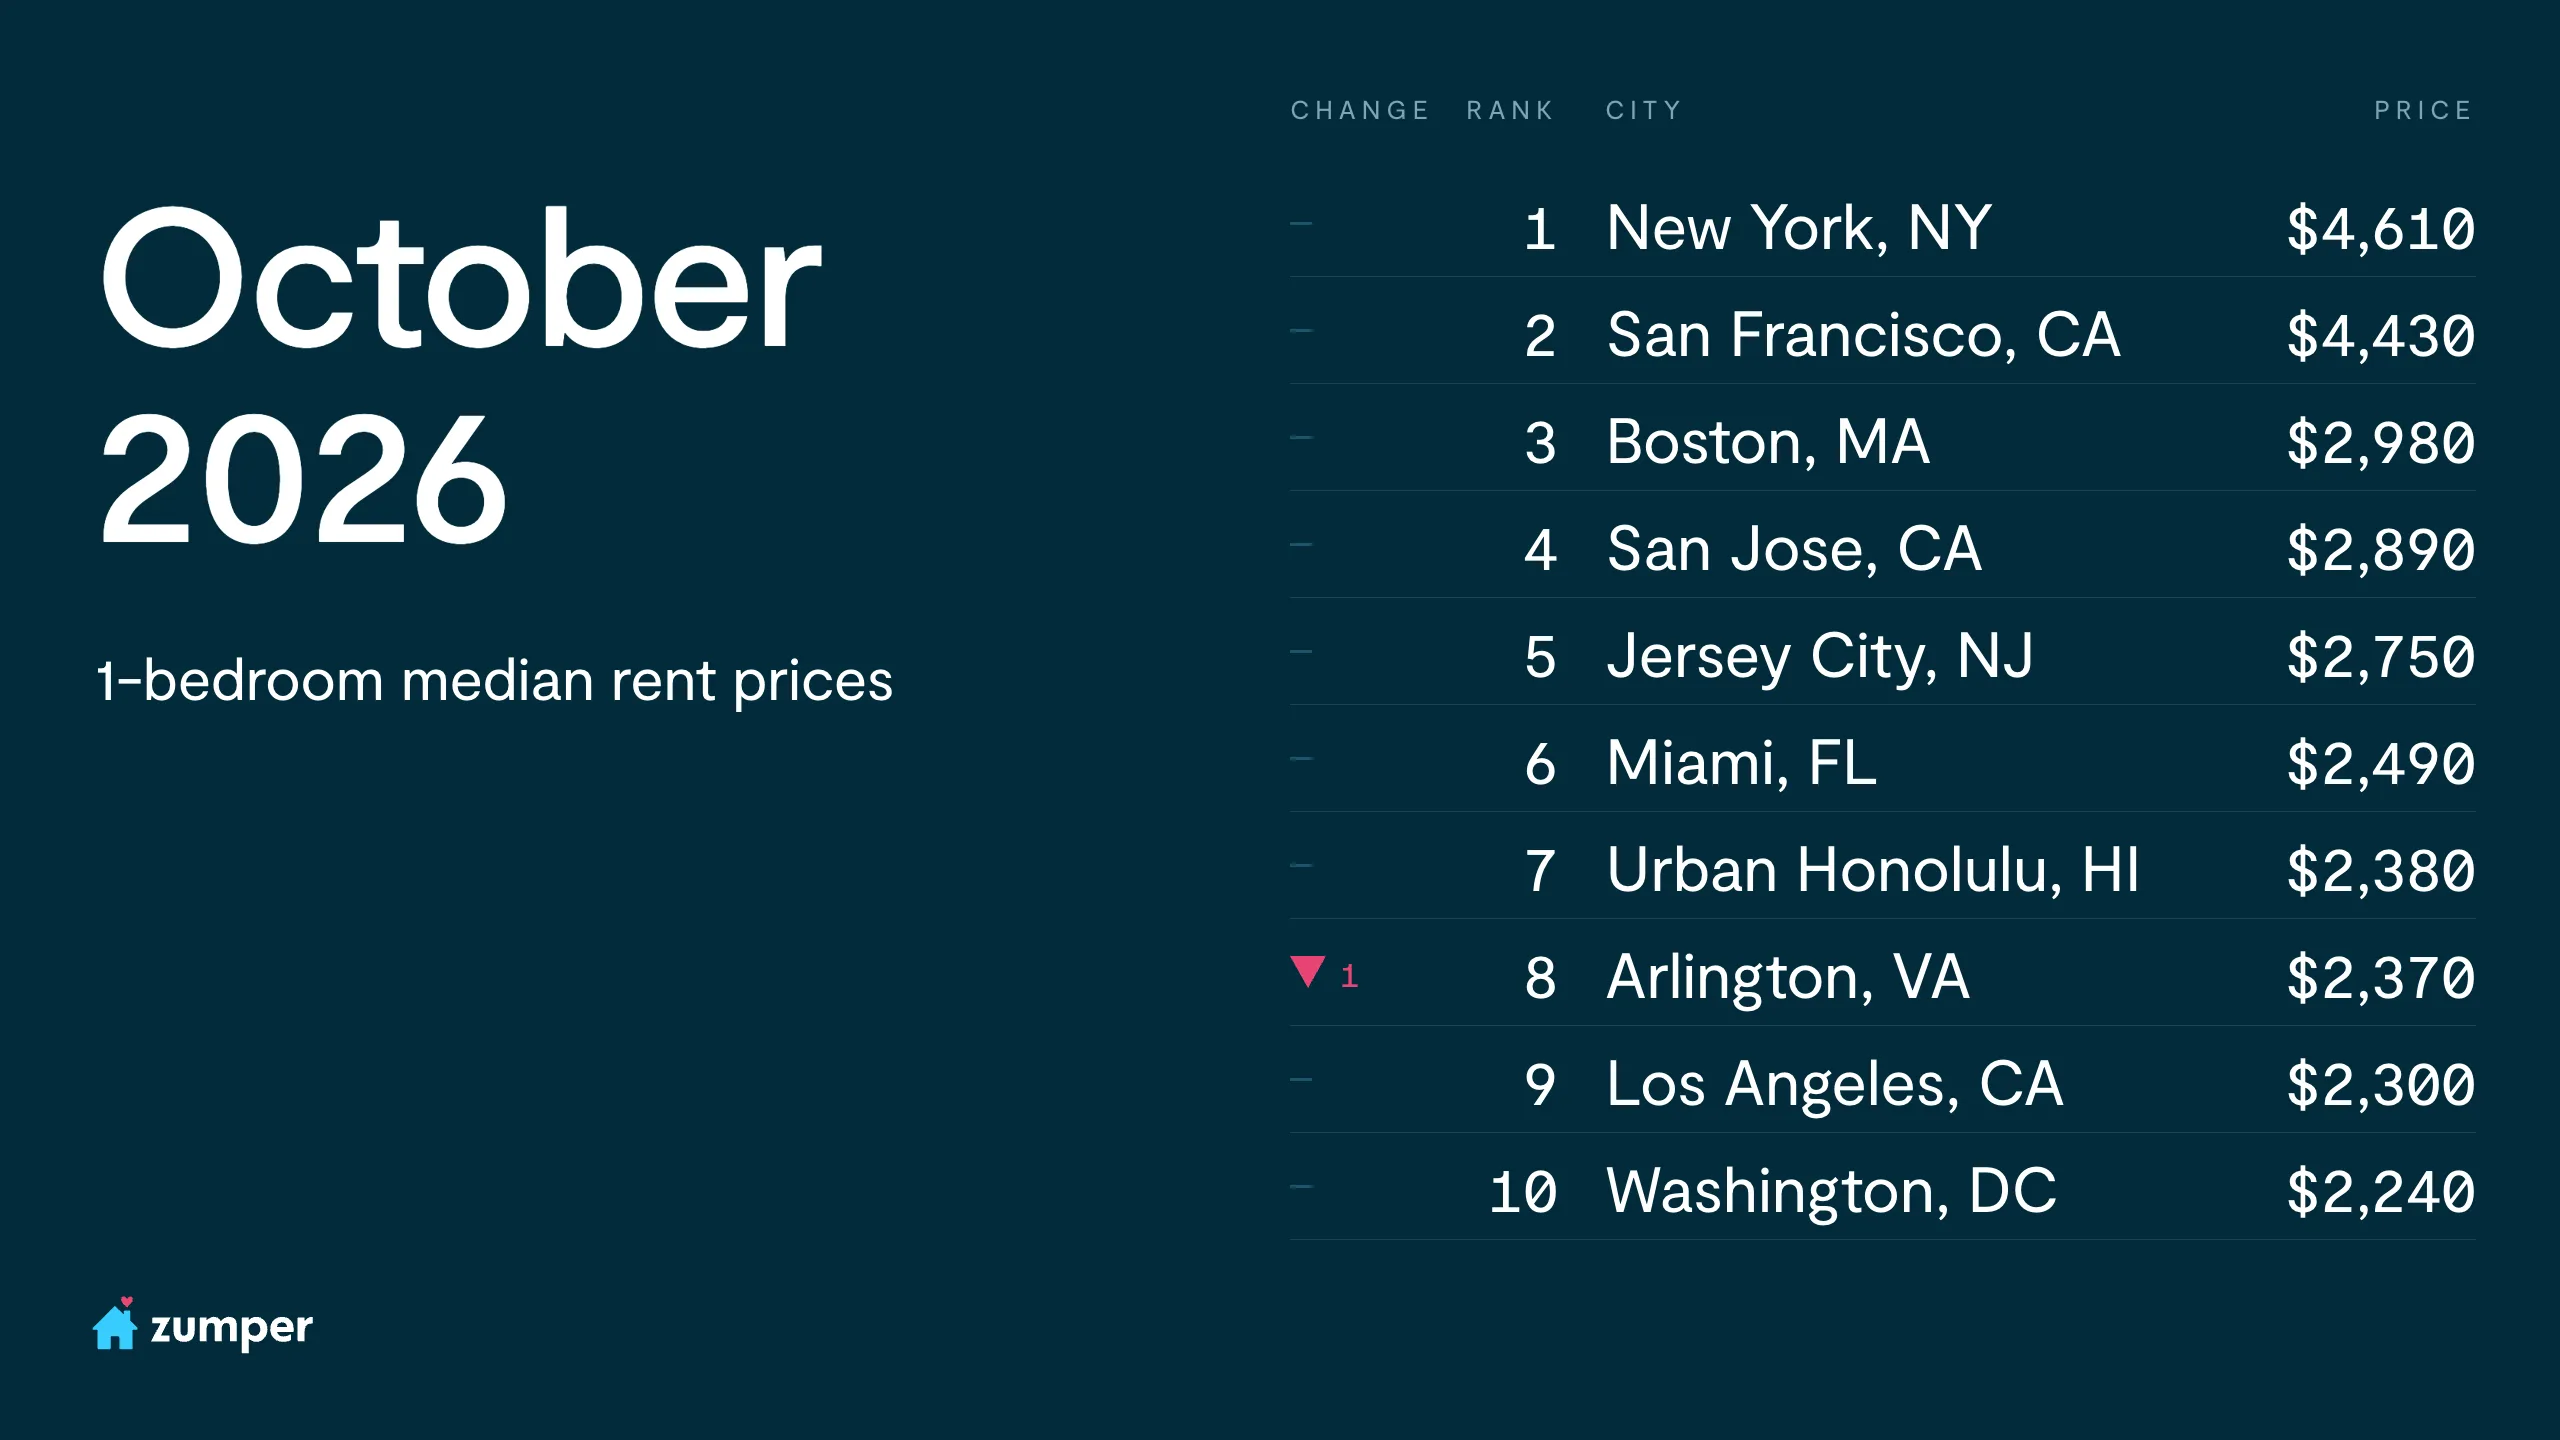
New York City held the top spot at $4,610 for one-bedrooms, with San Francisco a steady $180 behind at a record $4,430. San Francisco’s two-bedroom rent slipped slightly to $6,320 from last month’s record of $6,340, but it is still up 27.9% year-over-year. No market moved in or out of the top 10 this month, though Honolulu broke last month’s tie with Arlington, VA to take 7th. Miami and Jersey City were the only two top 10 markets with annual declines in both bedroom types; Washington, DC dropped off that list as its one-bedroom rent turned positive, up 1.8% year-over-year.
National rents hold their gains for a second straight month
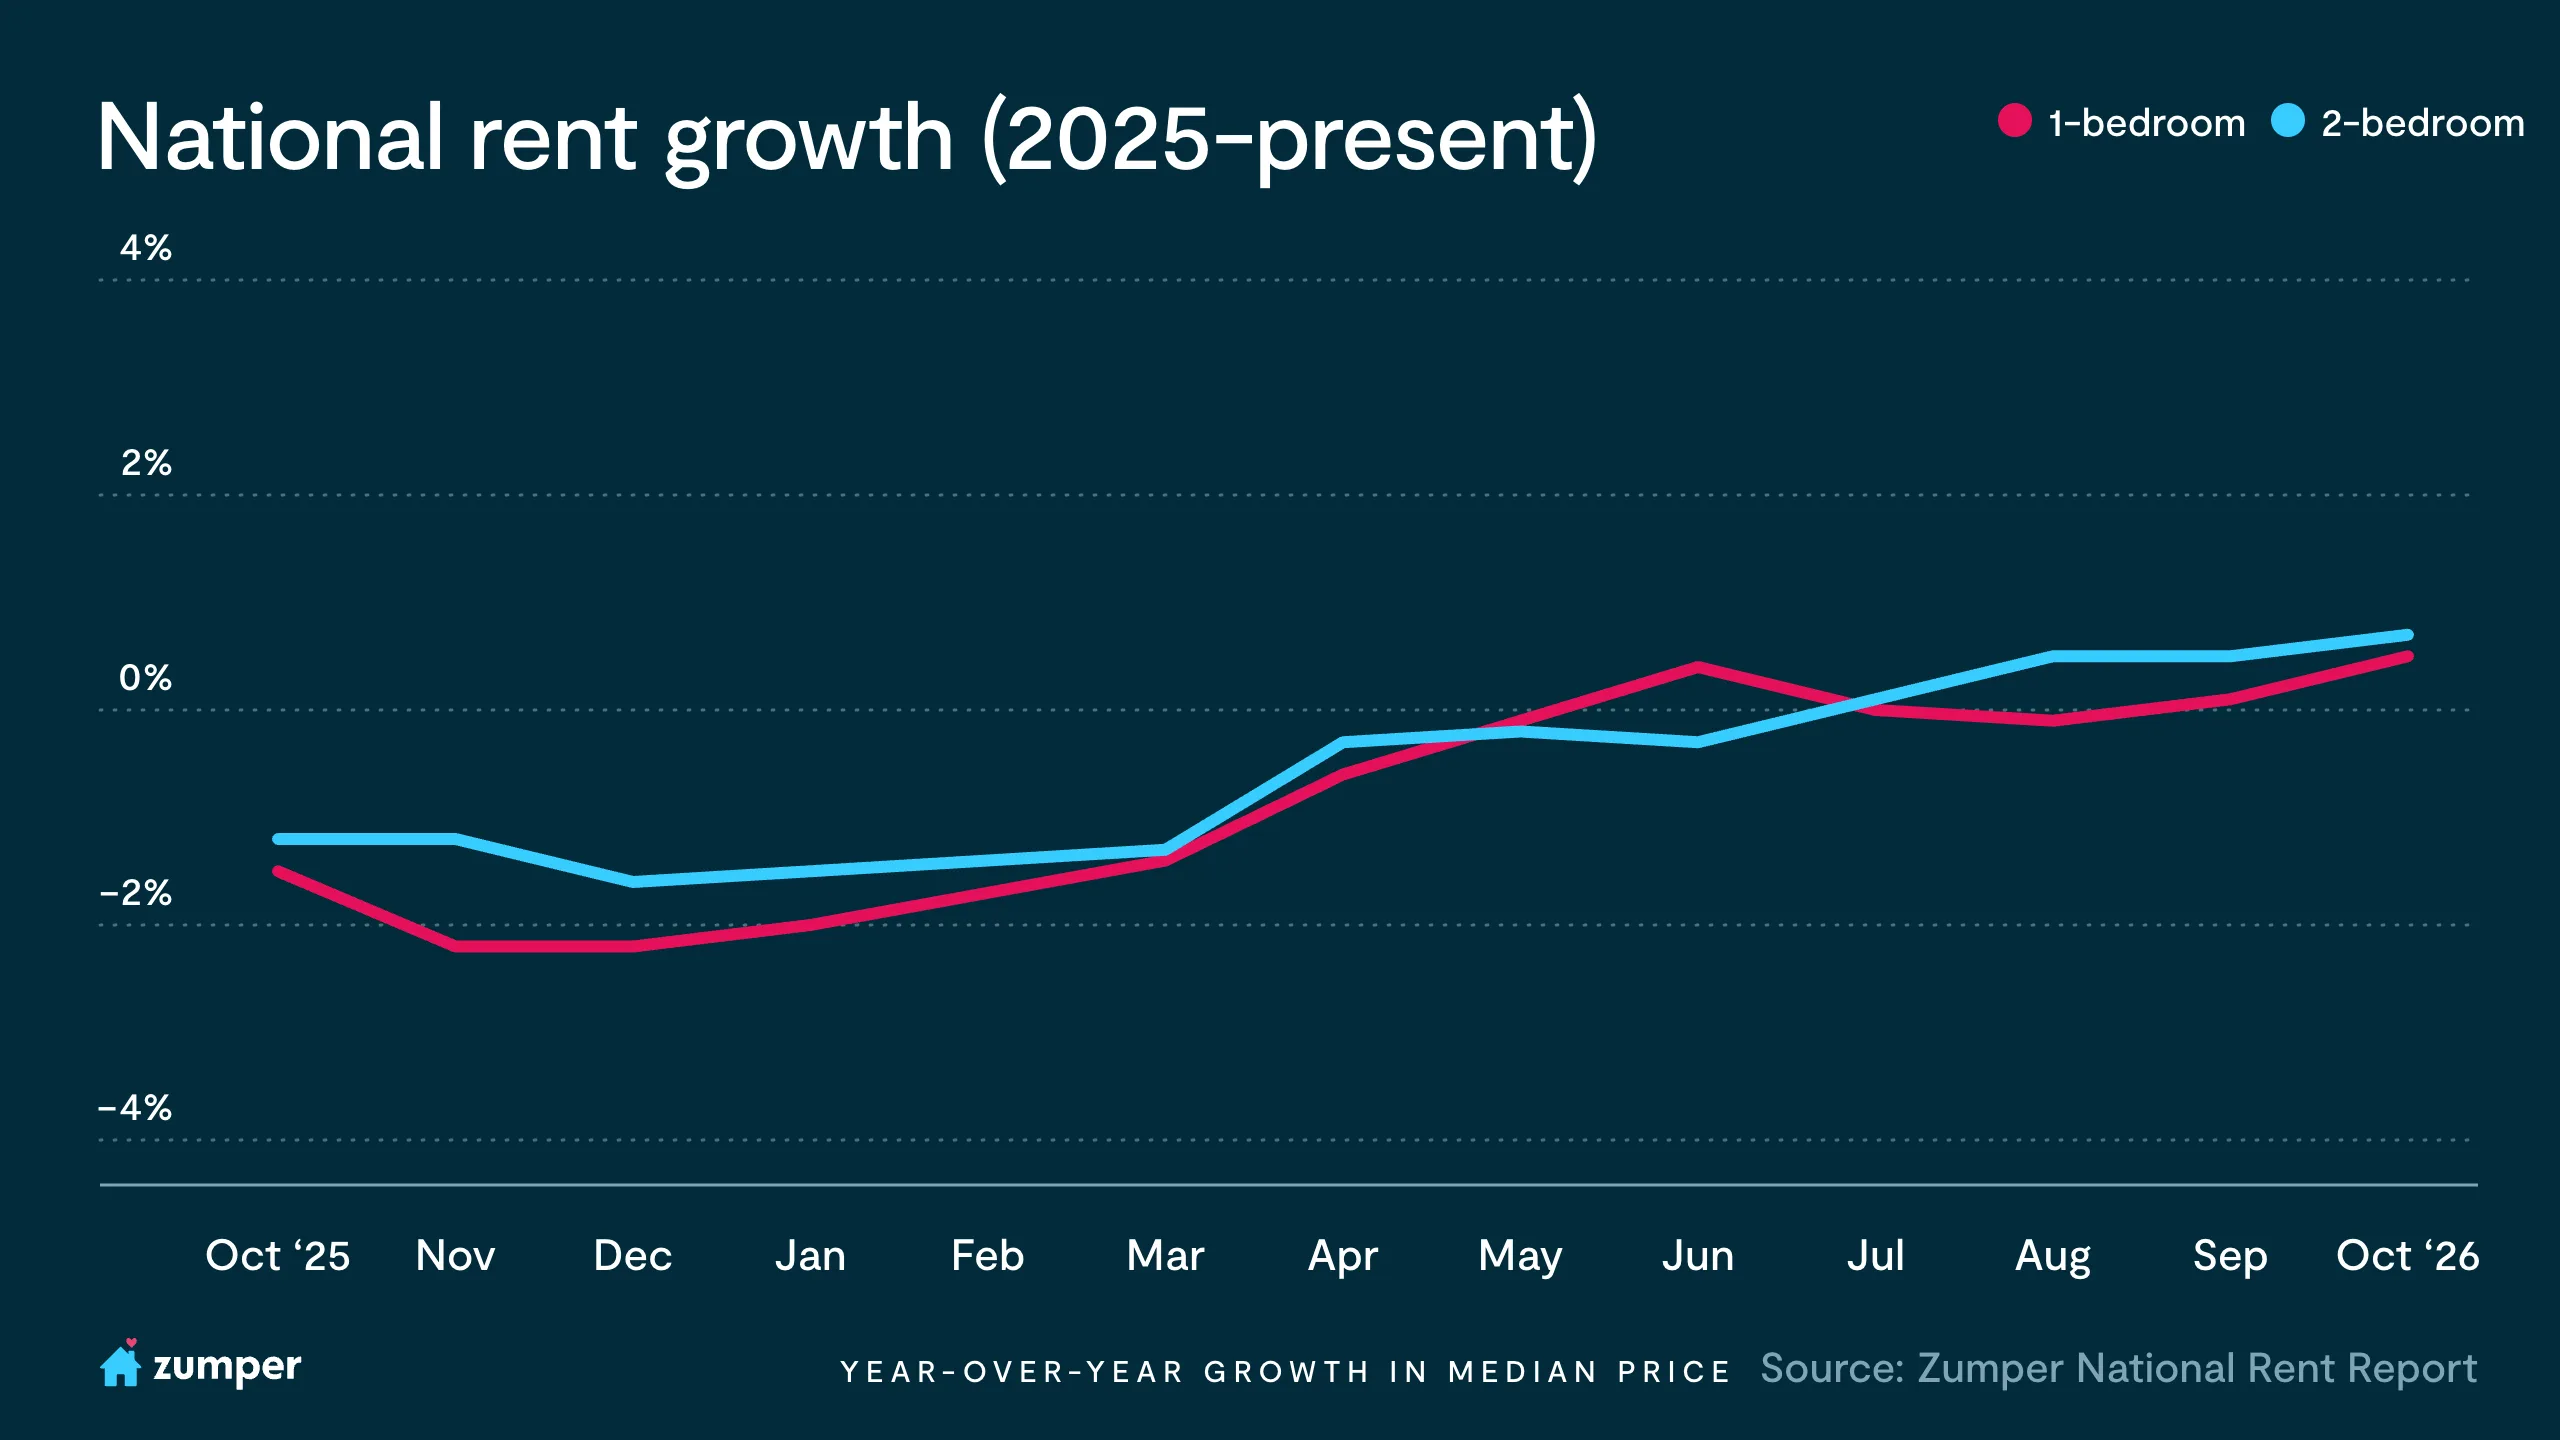
The Zumper National Rent Index showed the median one-bedroom rent edged up 0.1% month-over-month to $1,519, while two-bedroom rent slipped 0.1% to $1,901. On an annual basis, one-bedroom rent is up 0.5% and two-bedroom rent is up 0.7%, the strongest annual readings for both bedroom types since May 2025. It’s the second straight month that both have been positive at the same time, following 16 months without it. More than 40 of the 100 markets in our report posted positive annual one-bedroom growth, up from 36 last month.
“The same economic pressures are cutting both ways for the rental market,” says Zumper CEO Shawn Mullahy. “With elevated mortgage rates, would-be buyers are staying renters longer. But the same inflation that pushed rates up has wages lagging prices and employers hiring less, which leaves renters little room to absorb further increases and can slow the new household formation that drives demand. You end up with more renters but less room to raise rents, which helps explain why national gains are still measured in fractions of a percent.”
The latest CPI report showed shelter rose 0.4% in September, its biggest monthly gain since April. Zumper’s index offers an early signal into where the CPI may be headed, so for a deeper look, read our full analysis: https://www.zumper.com/blog/zumper-consumer-price-index.
New York City rents continue to climb, available listings down 9% annually
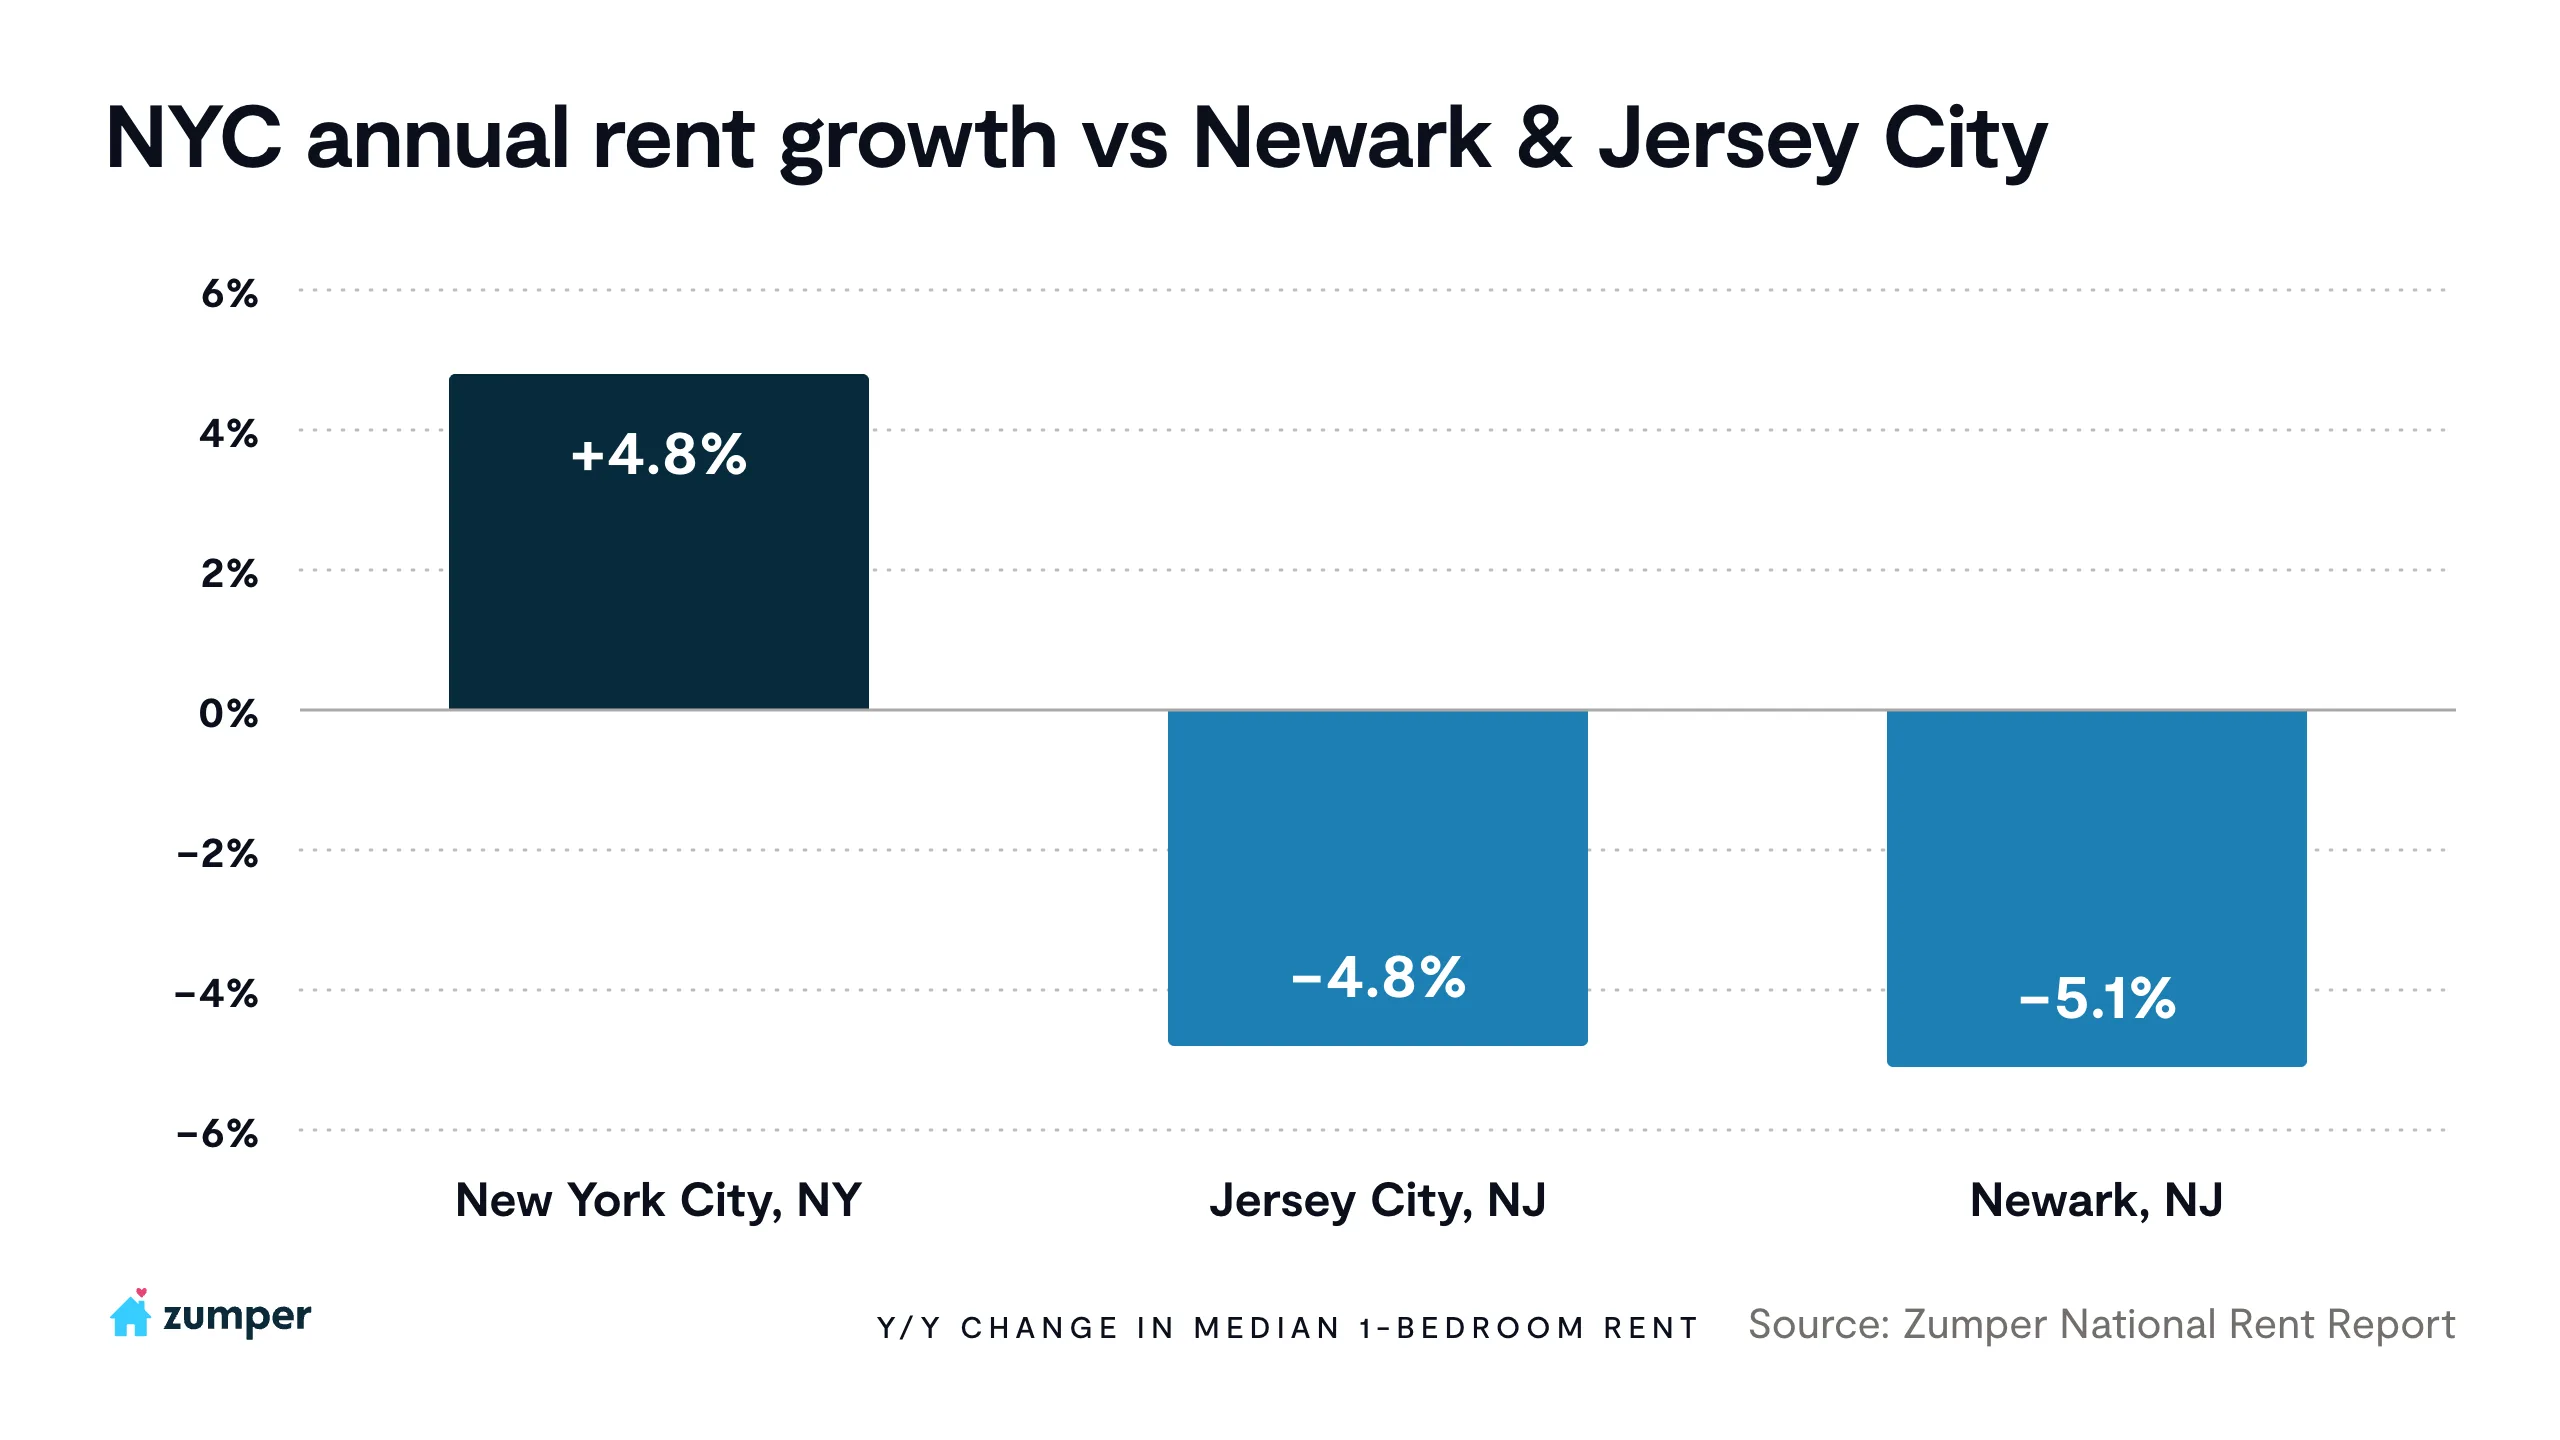
New York City’s first-ever two-year freeze on rent-stabilized leases took effect October 1, setting a 0% increase on one- and two-year renewals for about 1 million apartments. While it’s too early for the freeze to show up in rent data, it arrives in a market that was already tightening. One-bedroom rent in the city rose 4.8% annually to $4,610, the fastest annual growth since May 2025 and just $70 shy of the all-time high of $4,680 we recorded in May. Two-bedroom rent is up 5.2% to $5,470. The squeeze shows up in supply, too. Zumper data shows active listings in New York City are down 9.2%, when comparing September 2025 to 2026.
“The freeze only just took effect, so it can’t explain this year’s gains, but it could shape what happens next,” says Zumper CEO Shawn Mullahy. “When stabilized renters no longer face annual increases, there’s even less reason to move, which could mean fewer apartments coming to market for everyone else. With overall listings already down about 9% from a year ago, that’s a dynamic I’d watch closely over the next few months.”
Across the Hudson, the picture runs the other way. Jersey City one-bedroom rent is $2,750, down 4.8% year-over-year and about 20% below its mid-2024 peak of over $3,400, while Newark is down 5.1% and has been down between 5% and 7% annually in each of the last four months. Jersey City is still building, with more than 10,000 apartments under construction there. The one-bedroom gap between New York City and Jersey City is now $1,860.
Chicago and Northeast Ohio lead the Midwest’s rent growth
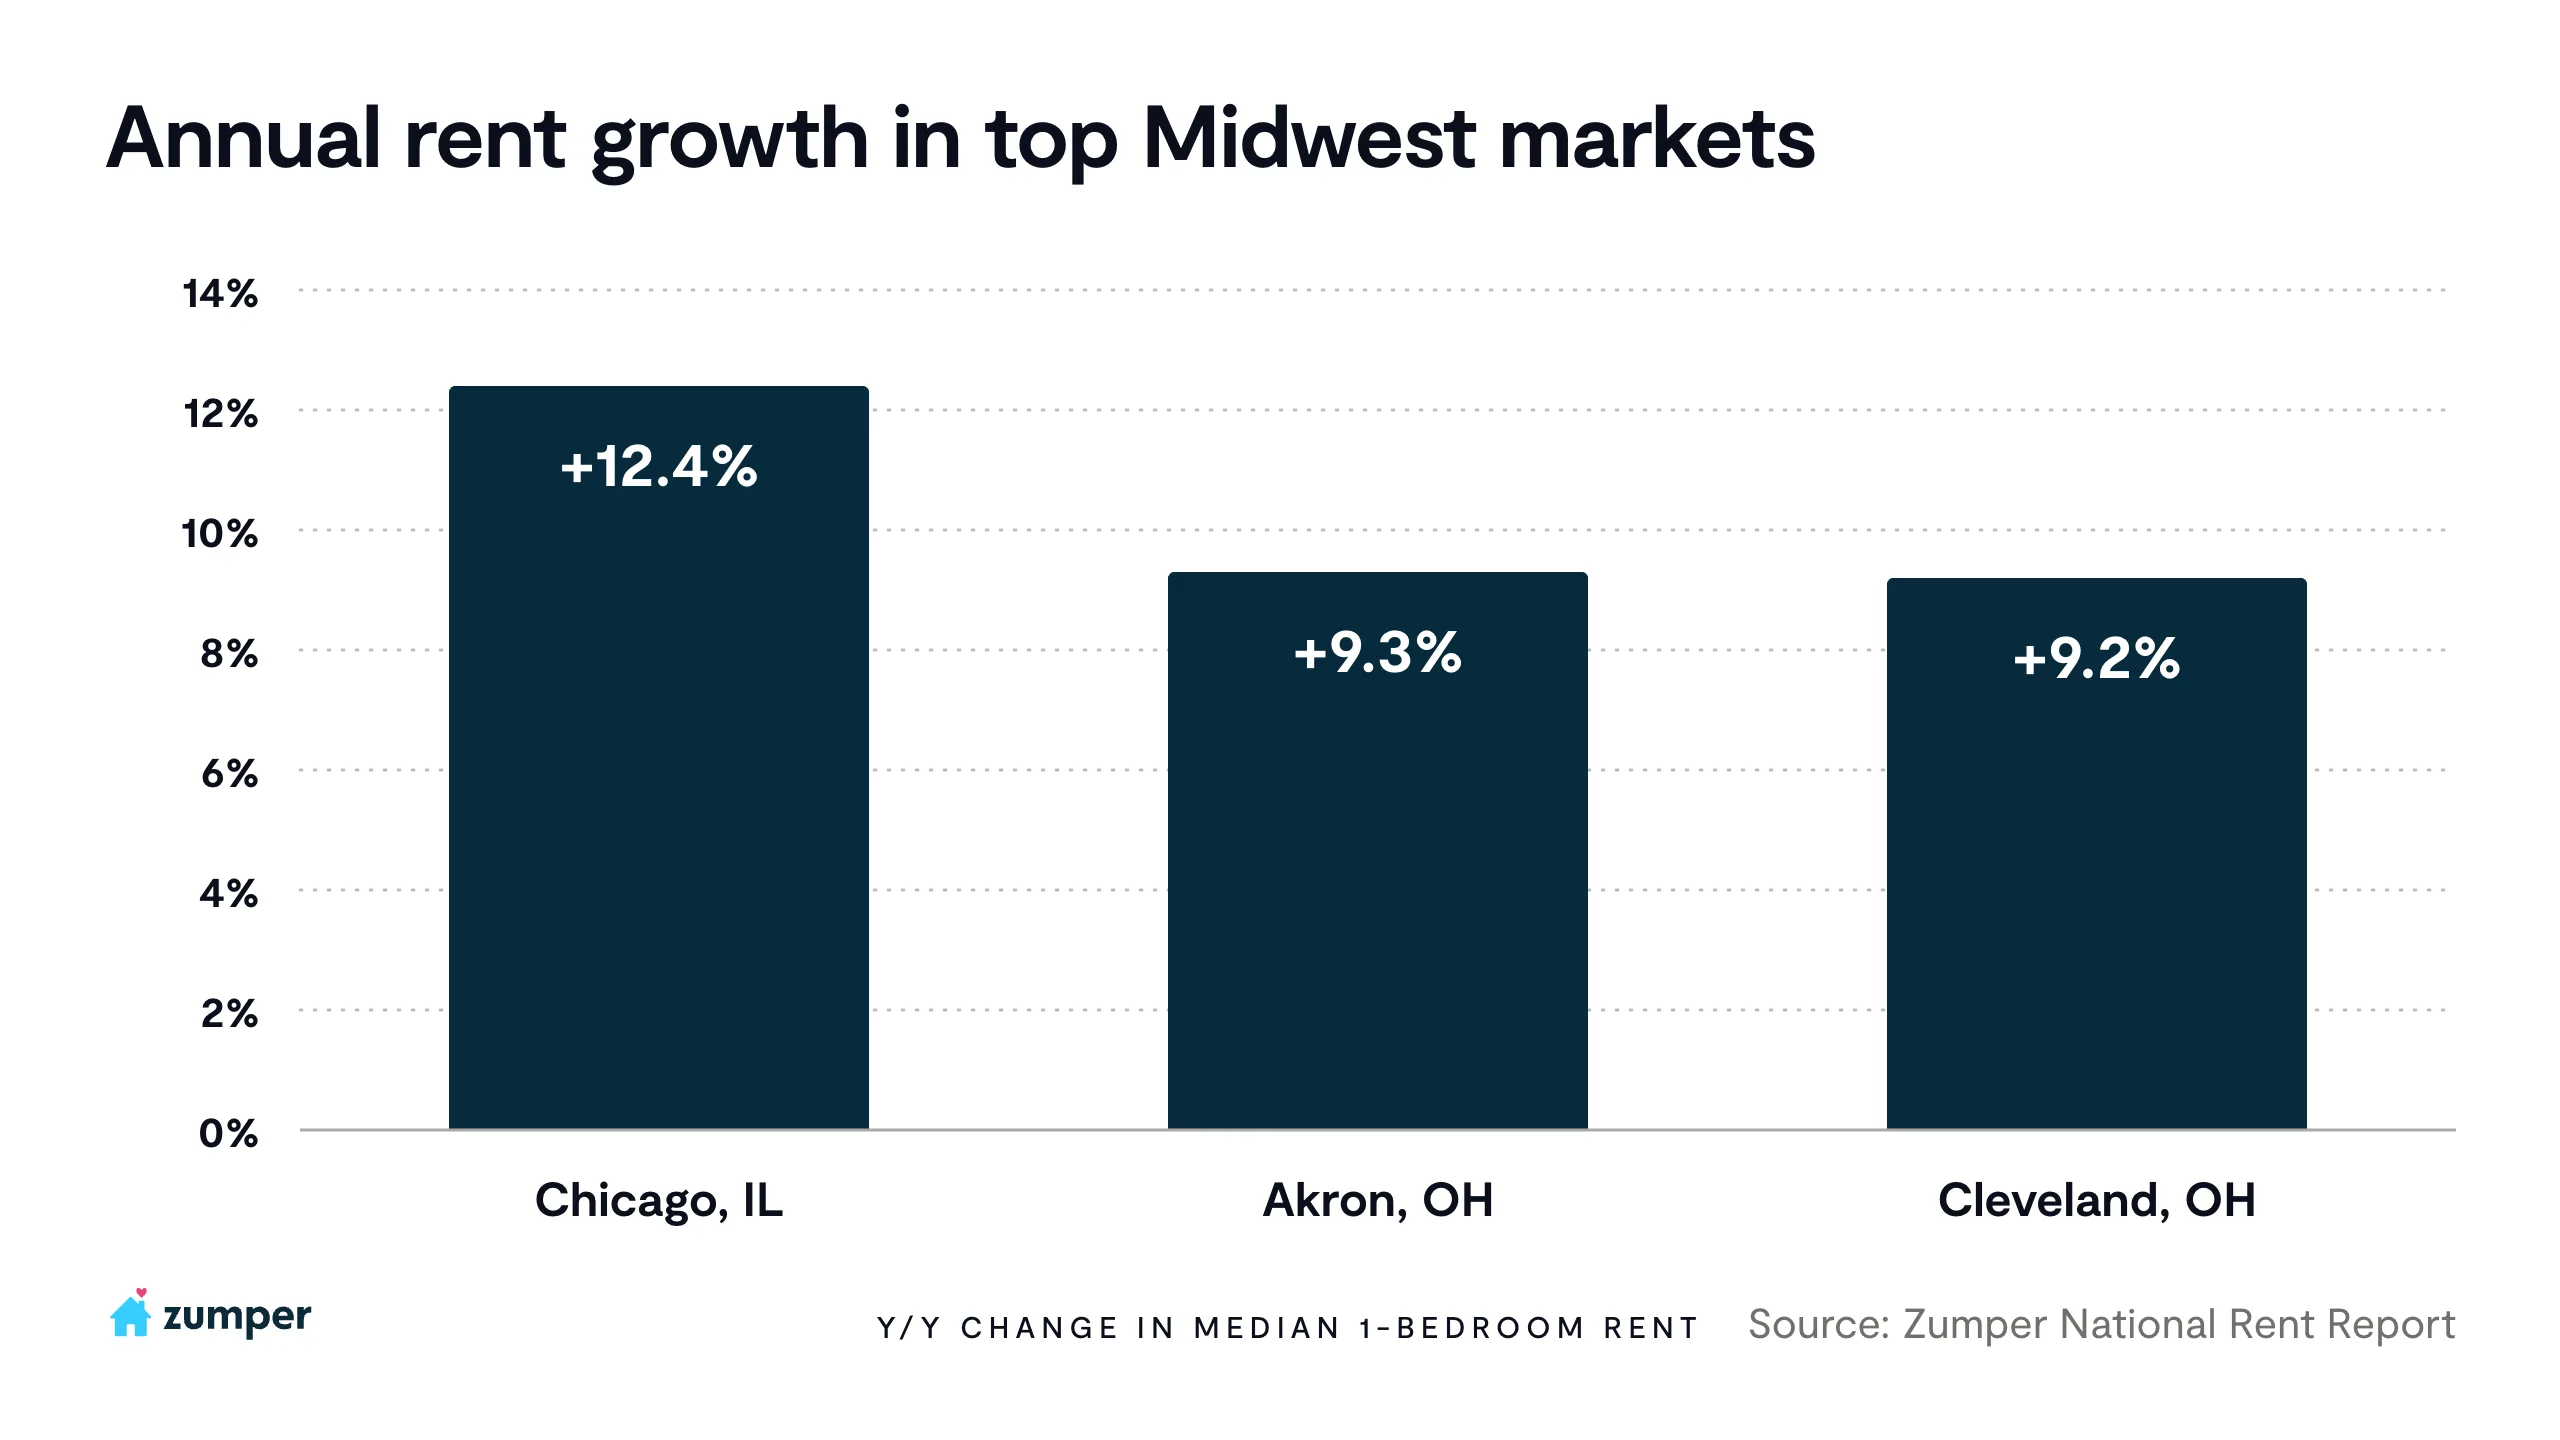
Chicago one-bedroom rent is up 12.4% year-over-year to $2,180, the third-fastest growth of any market in the country, behind only San Francisco and Virginia Beach. Akron, up 9.3% to $820, and Cleveland, up 9.2% to $1,190, are right behind Chicago in the region. The Midwest and Rust Belt are well represented across the leaderboard as 8 of the 16 markets with annual one-bedroom growth of 6% or more are Midwest or Rust Belt markets, including St. Louis (+8.8%), Wichita (+8.5%), Buffalo (+7.1%), Pittsburgh (+6.3%), and Rochester (+6%).
Chicago’s story is mainly supply. New apartments completed over the past 12 months added just 0.8% to existing inventory, and permits are down nearly half since 2022. Chicago’s one-bedroom price has held between $2,180 and $2,200 since July, so part of the annual jump reflects a softer comparison from last fall.
Ohio shows how much supply matters even within one state. Cleveland and Akron are up about 9%, while Columbus and Cincinnati are down about 5%. Over 9,100 apartments were under construction in metro Columbus in the first quarter, versus about 1,200 in metro Cleveland, whose pipeline has shrunk from a year earlier.
Top risers & fallers
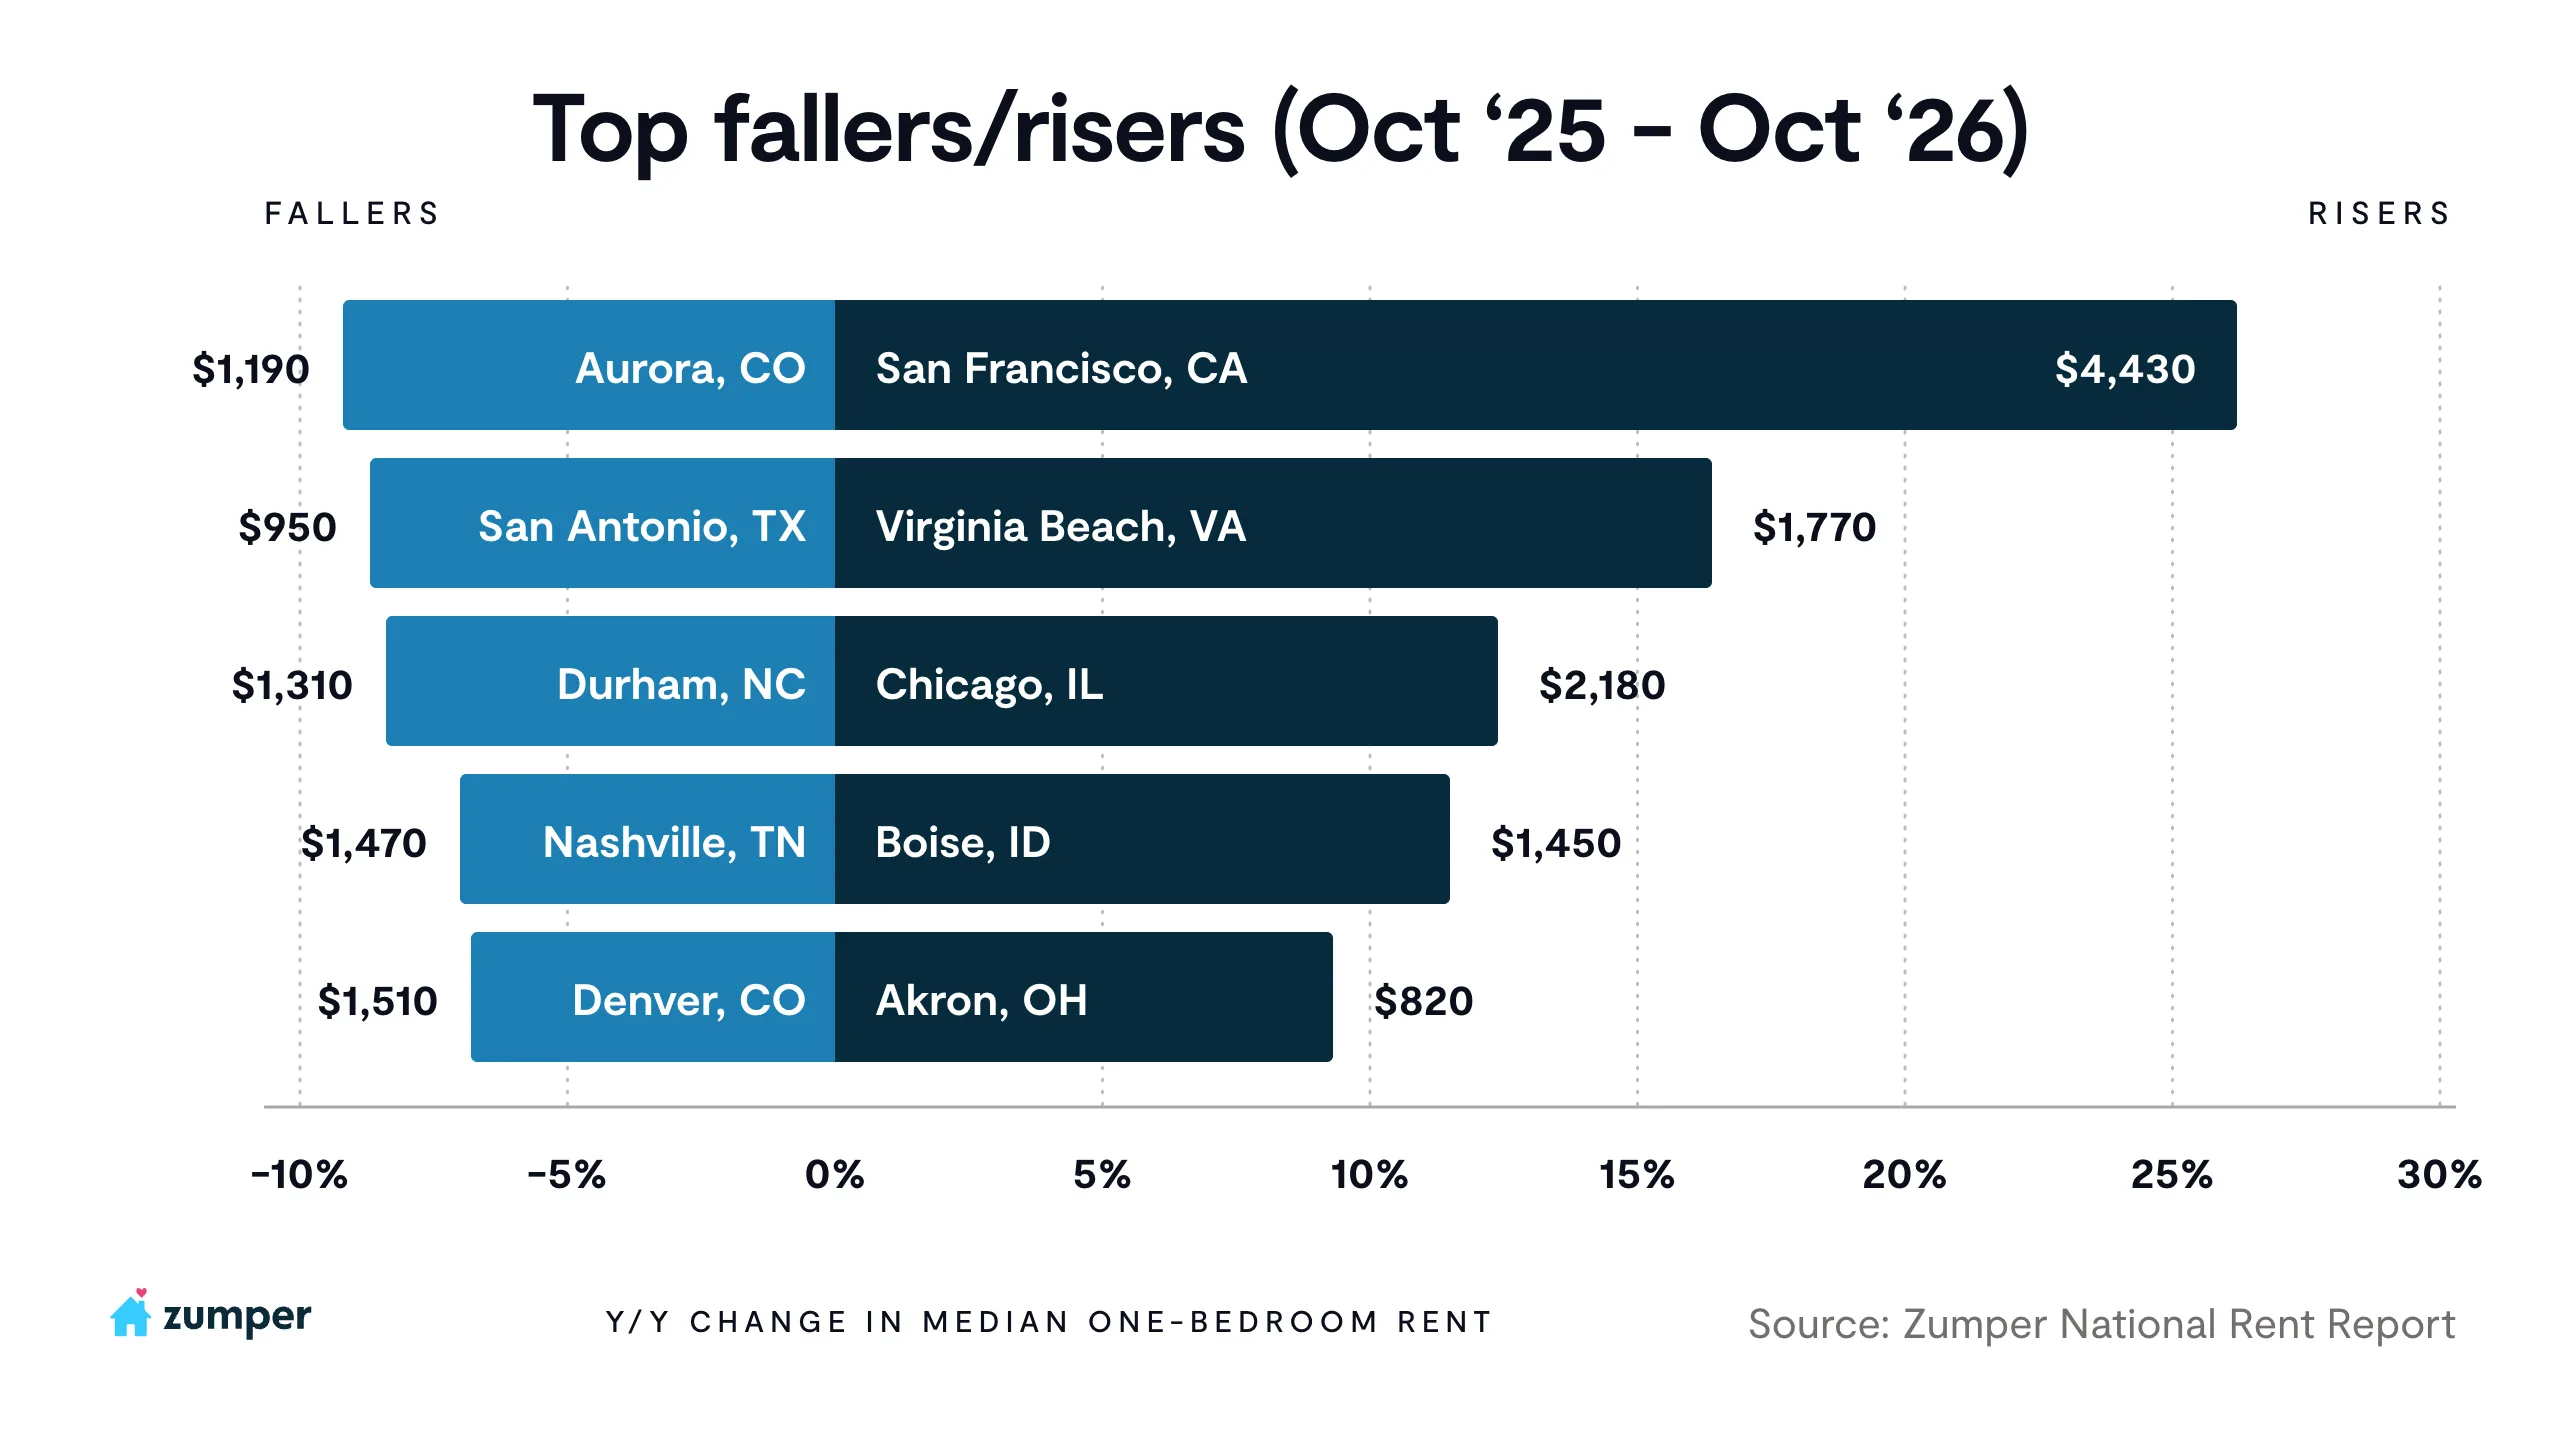
San Francisco (+26.2%), Virginia Beach (+16.4%), Chicago (+12.4%), Boise (+11.5%), and Akron (+9.3%) lead the list of biggest annual gainers, with Cleveland (+9.2%) just behind. On the other side, Aurora (-9.2%), San Antonio (-8.7%), Durham (-8.4%), Nashville (-7.0%), and Denver (-6.8%) posted the steepest annual declines, and no market in the report fell by double digits this month.
A first look at required monthly fees
This month, we’re adding a look at what rent costs once required monthly fees are included. Everything else in this report reflects base rent, the advertised monthly rent before fees. This section adds mandatory monthly charges, such as trash, amenity, or utility packages, to show closer to what renters are quoted to pay each month. Optional fees like parking and pets are not included.
In Zumper data from October, 8% of listings, counted as floorplans and standalone rentals, had required monthly fees. Where fees are charged, the typical amount is $55 a month, or 3.1% of base rent, with the middle half of fees falling between $30 and $111. Because many listings come from sources that don’t send fee data, these figures are a floor, not a ceiling.
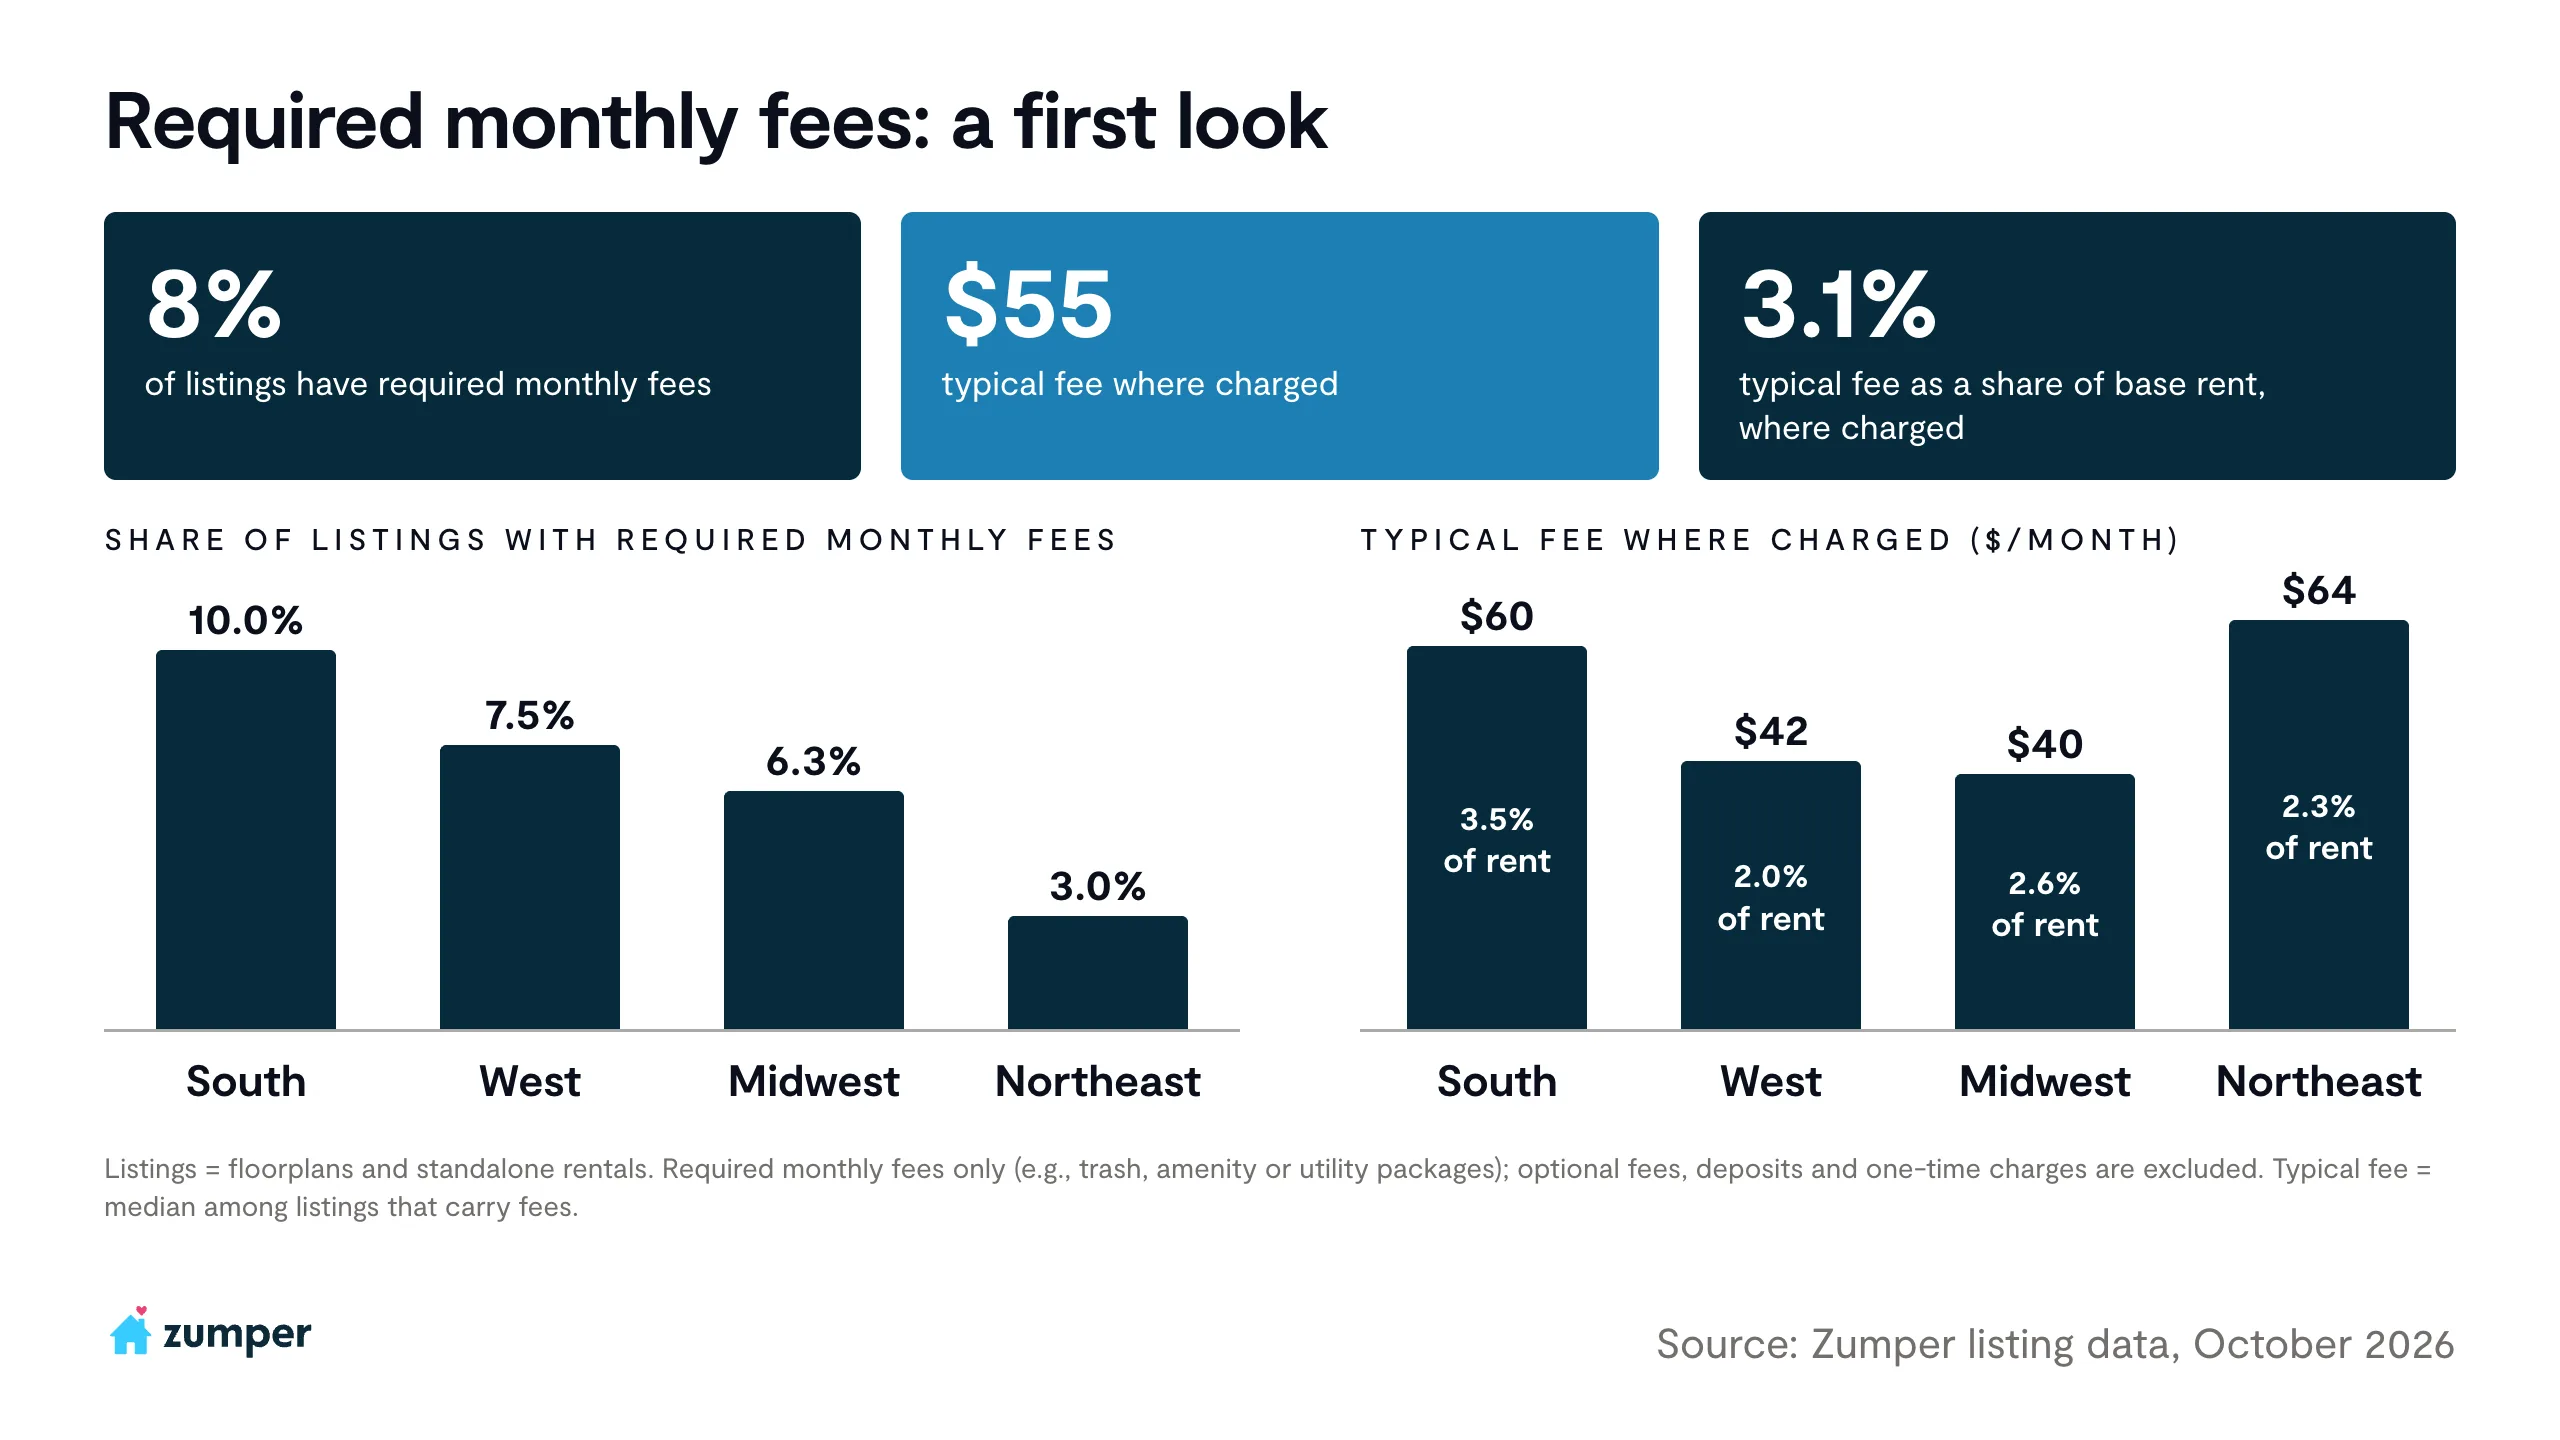
Fees are most common in the South, where 10% of listings include required monthly fees, at a typical $60 a month (3.5% of rent). The West and Midwest follow at 7.5% and 6.3% of listings, with typical fees of $42 and $40. The Northeast has the smallest share of listings with fees (3%) but the largest typical charge ($64) where they are listed.
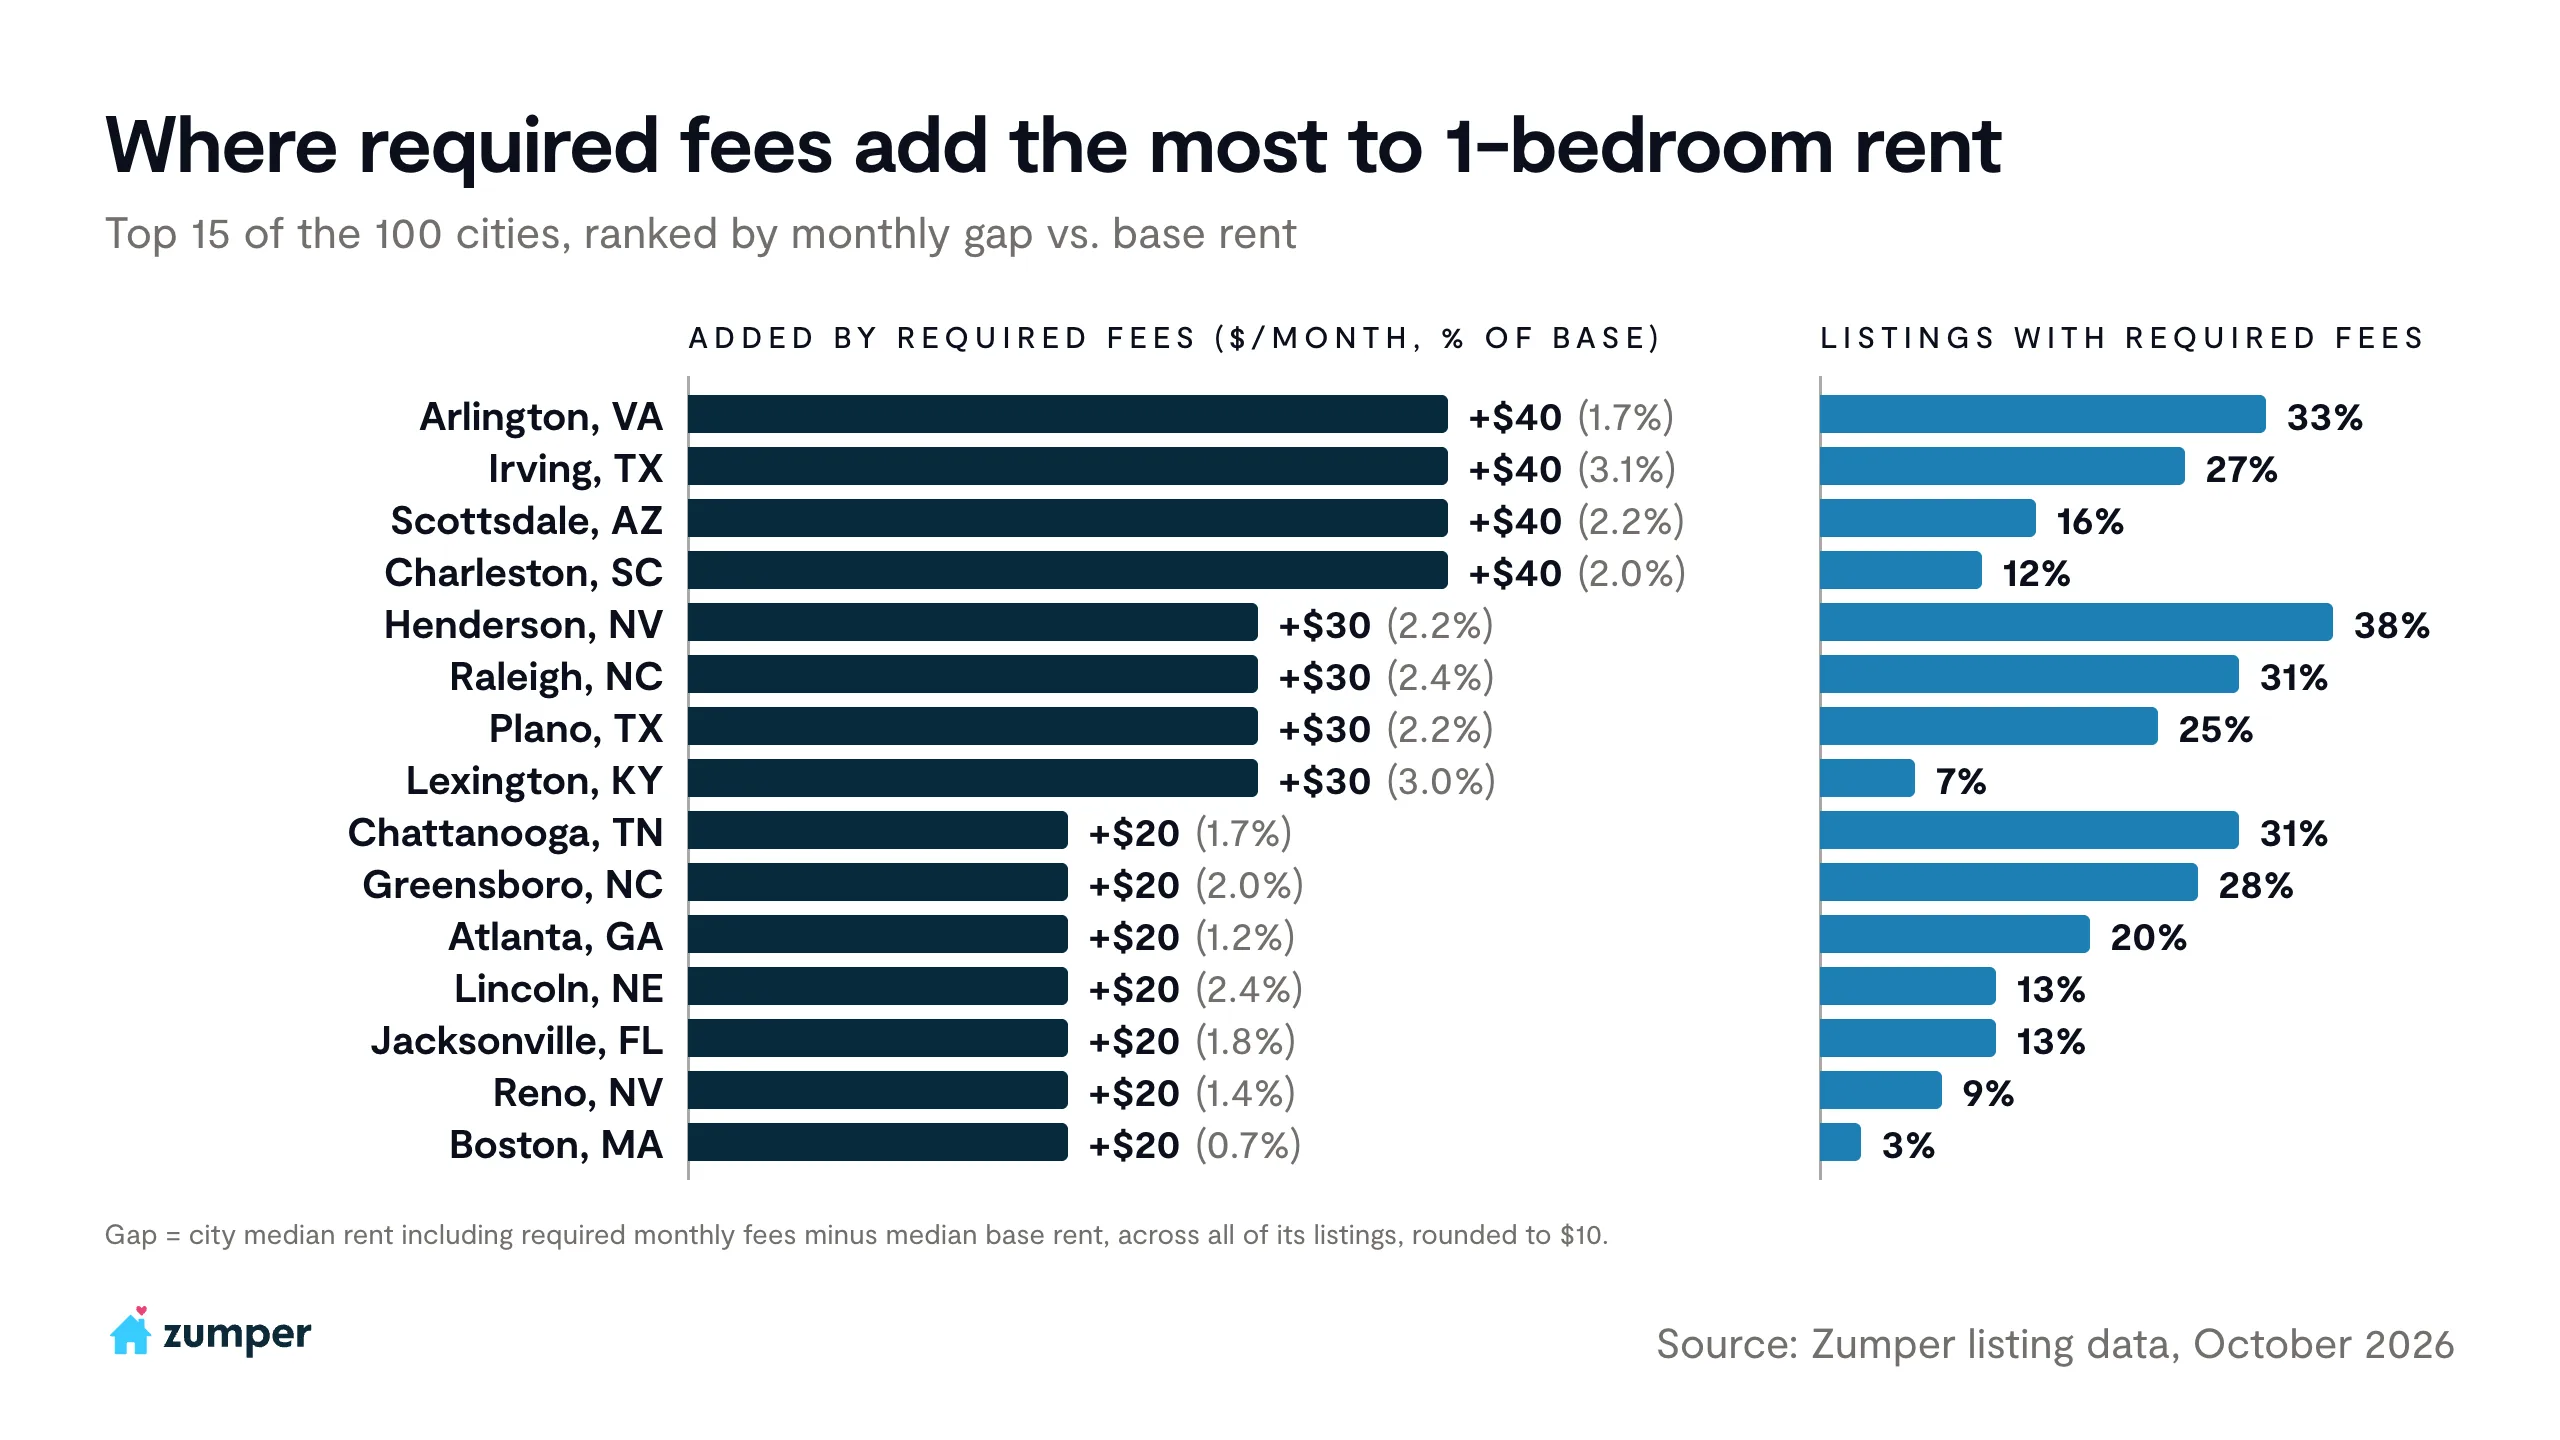
Among the top 100 cities, including required monthly fees raises median one-bedroom rent the most in a handful of markets, by about $30 to $40 a month: $40 in Arlington, VA; Irving, TX; Scottsdale, AZ; and Charleston, SC, and $30 in Henderson, NV; Raleigh, NC; Plano, TX; and Lexington, KY.
FAQ
What is the Zumper National Rent Index?
It’s Zumper’s monthly snapshot of what renters are paying across the country. We track the typical rents for the 100 largest U.S. cities.
What is the national median rent as of October 2026?
$1,519 for a one-bedroom and $1,901 for a two-bedroom.
Which city has the highest one-bedroom rent in the country?
New York City with rent at $4,610.
Is New York City’s rent freeze affecting rents?
It’s too early to tell, but the rent freeze is landing in an already tightening market.
Why is San Francisco rent rising so quickly?
AI-sector hiring has created a lot of new demand in a city with very little new supply.
Which cities are seeing the steepest rent declines?
Aurora (-9.2% year-over-year), San Antonio (-8.7%), and Durham (-8.4%) are October’s steepest annual decliners.
Which cities are seeing the biggest rent increases?
San Francisco (+26.2%), Virginia Beach (+16.4%), and Chicago (+12.4%) lead the country in annual rent growth this October.
How common are required monthly fees?
In Zumper listings from October, 8% of listings required monthly fees. However, since many listings come from sources that don’t send fee data, the actual share is likely higher.
How often is the Zumper National Rent Report updated?
Every month, using the latest listing data from that period.
Methodology
The Zumper National Rent Report tracks asking rents in the 100 largest U.S. cities by population, drawing on more than 1 million active listings on Zumper. Cities are ranked by one-bedroom rent.
We measure how rents change by following the same homes over time, using a method similar to the Case-Shiller Home Price Index. When a unit returns to the market, we compare its new asking rent with its previous listed rent. Because each home is compared only with itself, the results track market-level price changes and are not skewed by changes in the mix of listings. Each month’s rent starts from the previous month’s published figure and moves with the change observed across these repeat rentals.
Beyond the asking rent, we capture rich data on each listing, including any required monthly fees, such as amenity, trash, or utility packages, that renters must pay on top of rent. We use this data to show what rent costs once those fees are included, giving renters a clearer picture of what they’d actually pay each month.
For more on how and why we calculate our rent data, read our methodology post.