
Bedroom count
Property type
Last updated on July 31, 2026
Average rent in
South St. Paul, MN
Average rent in
Last updated on July 31, 2026
Bedroom count
Property type
Median rent
Median rent in South St Paul
$1,640/mo
vs previous year
The average rent in South St Paul is $1,640 per month as of July 2026. This is 15% below the national average rent, or $290 less per month.
average price per square foot
Total rentals
Available rentals in South St Paul
10
for rent on Zumper.com as of July 2026
Rent price distribution
Share of South St Paul rentals at each price point
This report has limited data.Due a shortage of data for this selected bedroom and/or property type in South St. Paul, MN, in the last 30 days, rent estimates may not represent the actual market.
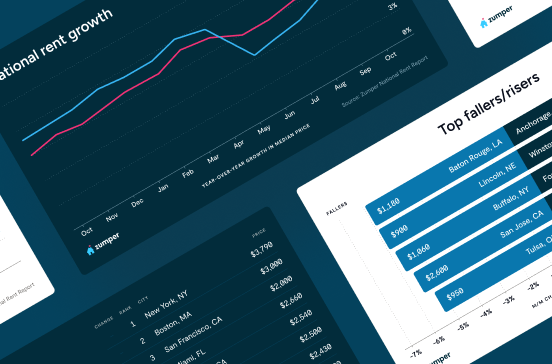
Rent trends in South St. Paul, MN
Average rent prices in South St Paul have increased by 1% over the last month and have increased by 17% since last year.
Rent trends
Rent prices on this page are calculated on a rolling 30-day basis and updated daily.
Compare rent prices in
South St. Paul, MN
Rent prices in South St Paul vary by bedroom size, rental type, and neighborhood. The average rent for an apartment in South St Paul is $1,640, whereas a house costs $2,200. 1-bedroom apartments in South St Paul run $1,695 on average, while 2-bedroom apartments are $2,295.
Listings | ||||
|---|---|---|---|---|
Studio | $1,025 |  2% |  10% | |
1 bedroom | $1,712 | No Change | 18% | |
2 bedroom | $1,599 | 5% | 3% | |
3 bedroom | $2,100 | 3% | 8% | |
4 bedroom | $2,199 | 32% | - |
Listings | ||
|---|---|---|
Hepburn Park | $1,402 | |
Mississippi Landing | $1,425 | |
Oak Park | $1,416 | |
Riverside Park | $1,545 | |
South Park | $1,565 | |
Spring Park | $1,745 |
Listings | ||||
|---|---|---|---|---|
Apartments | $1,640 | 1% | No Change | |
Condos | $1,372 | 3% | - | |
Houses | $2,200 | 7% | No Change |
Studio
Average rent
$1,025
Last 30 days
2%
Last year
10%
1 bedroom
Average rent
$1,712
Last 30 days
No Change
Last year
18%
2 bedroom
Average rent
$1,599
Last 30 days
5%
Last year
3%
3 bedroom
Average rent
$2,100
Last 30 days
3%
Last year
8%
4 bedroom
Average rent
$2,199
Last 30 days
32%
South Park
Average rent
$1,565
Hepburn Park
Average rent
$1,402
Riverside Park
Average rent
$1,545
Spring Park
Average rent
$1,745
Mississippi Landing
Average rent
$1,425
Oak Park
Average rent
$1,416
Apartments
Average rent
$1,640
Last 30 days
1%
Condos
Average rent
$1,372
Last 30 days
3%
Houses
Average rent
$2,200
Last 30 days
7%
The table above reflects average rent prices in South St. Paul, MN, broken down by the number of bedrooms, neighborhoods, and property types. The availability of data for each category is dependent on market inventory and will adjust depending on your selected filters.
How does rent in South St Paul, MN compare to other cities?
Compare median rent prices in South St Paul and Brooklyn Center by all bedroom counts and property types.
South St Paul
lower than the national median
lower than the national median
Takeaway
The median rent for all rentals in South St Paul, MN is 31% higher than the median rent in Brooklyn Center, MN.
Average rent in nearby cities
Explore rent trends in neighboring markets
$1,250
$1,445
$1,425
$1,500
$1,835
$1,435
$1,677
$2,175
$1,972
$1,712
$1,250
$1,400
Discover rentals in South St. Paul, MN

5d+ ago
930 Summit Ave, South St. Paul, MN 55075
2 beds
1 bath
$1,200
Apartment for rent

5d+ ago
South Park apartment for rent in South St. Paul
1120 Bryant Ave, South St. Paul, MN 55075
2 beds
1 bath
$1,315
Apartment for rent
Available Sep 11

5d+ ago
House for rent in South St Paul
4 beds
2 baths
$2,449
House for rent

5d+ ago
Verified
351 4th Ave S, South St. Paul, MN 55075
4 beds
2 baths
$2,485
House for rent
Available Jul 29

11h ago
Verified
205 Concord Exchange N, South St Paul, MN 55075
Studio–2 beds
1–2 baths
$1,375–$2,695
Apartment for rent

7h ago
920 Summit Ave, South St. Paul, MN 55075
1–2 beds
1 bath
$1,175–$1,315
Apartment for rent

4d ago
220 1st Ave S, South St. Paul, MN 55075
1 bed
1 bath
$1,125
Apartment for rent

5d+ ago
Condo for rent in South St Paul
1 bed
1 bath
$1,095
Condo for rent
Available Aug 3

11h ago
Verified
205 Concord Exchange N, South St Paul, MN 55075
Studio–2 beds
1–2 baths
$1,375–$2,695
Apartment for rent
5d+ ago
Verified
351 4th Ave S, South St. Paul, MN 55075
4 beds
2 baths
$2,485
House for rent
Available Jul 29
5d+ ago
South Park apartment for rent in South St. Paul
1120 Bryant Ave, South St. Paul, MN 55075
2 beds
1 bath
$1,315
Apartment for rent
Available Sep 11
7h ago
920 Summit Ave, South St. Paul, MN 55075
1–2 beds
1 bath
$1,175–$1,315
Apartment for rent

11h ago
Verified
205 Concord Exchange N, South St Paul, MN 55075
Studio–2 beds
1–2 baths
$1,375–$2,695
Apartment for rent
5d+ ago
Verified
351 4th Ave S, South St. Paul, MN 55075
4 beds
2 baths
$2,485
House for rent
Available Jul 29
5d+ ago
South Park apartment for rent in South St. Paul
1120 Bryant Ave, South St. Paul, MN 55075
2 beds
1 bath
$1,315
Apartment for rent
Available Sep 11
2d ago
House for rent in South St Paul
1 bed
1 bath
$895
House for rent
5d+ ago
930 Summit Ave, South St. Paul, MN 55075
2 beds
1 bath
$1,200
Apartment for rent
Stay up to date with rental market insights

Are you interested in licensing our current and historical rental real estate data, or do you have custom data requests? Contact datalicensing@zumper.com.
Frequently asked questions for South St. Paul, MN
Quick answers to common questions about the South St Paul rental market.
How much is rent in South St Paul?
The average rent in South St Paul is $1,640 per month as of July 25, 2026.
Is rent up or down in South St Paul?
Average rent prices in South St Paul have increased by 1% over the last month and have increased by 17% since last year.
How does South St Paul rent compare to the national average?
Rent in South St Paul is 15% below the national average, which means renters are paying approximately $290 less per month.
Which neighborhoods are most affordable in South St Paul?
The most affordable neighborhoods in South St Paul are Hepburn Park ($1,402/mo), Oak Park ($1,416/mo), and Mississippi Landing ($1,425/mo).
What salary do I need to afford rent in South St Paul?
To comfortably afford rent in South St Paul, you'd need to earn approximately $66,000/year, based on spending no more than 30% of your income on rent.
When is the best time of year to rent in South St Paul?
Based on our current listings data, Riverside Park, Hepburn Park, and South Park offer the strongest rental options with high walk scores and excellent transit access. These neighborhoods provide walkable communities with frequent transit connections to the broader metro area, making them ideal for renters who want to engage with their surroundings.
Methodology
Rent prices are based on Zumper's rental listings from the past 30 days. Median rent is calculated across all available listings and property types on the platform. If you filter the page by bedroom count or property type, the pricing throughout the page will update automatically to reflect that segment of the rental market.
Household and population data come from the U.S. Census Bureau. Cost-of-living data is sourced from the Council for Community and Economic Research's Cost of Living Index (COLI).