
Bedroom count
Property type
Last updated on May 14, 2026
Average rent in
Port of Oakland, Oakland, CA
Last updated on May 14, 2026
Last updated on May 14, 2026
Bedroom count
Property type
As of May 2026, the median rent for all bedroom counts and property types in Port of Oakland, Oakland, CA is $4,800. This is +146%, or $2,850, higher than the national average.
average price per square foot
Median rent
$4,800
As of May 2026, we do not have enough inventory to generate median rent for all bedroom counts and property types in Port of Oakland, Oakland, CA. Please check back soon.
Total rentals
17
for rent on Zumper.com
As of May 2026, the median rent for all bedroom counts and property types in Port of Oakland, Oakland, CA is $4,800. This is +146%, or $2,850, higher than the national average.
average price per square foot
Rent ranges
Households
At this time, we don't have information to generate a distribution. Please check back soon.
Median rent and rent ranges are based on Zumper inventory in the last 30 days. Household data are provided by the US Census Bureau.
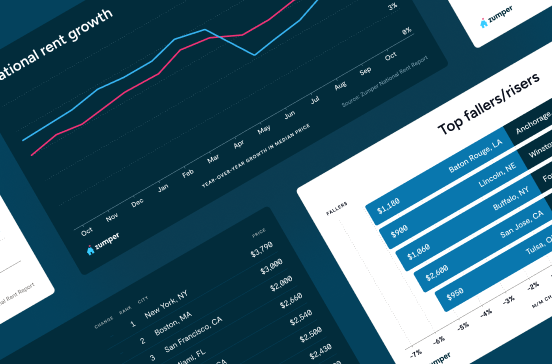
Rent price trends in
Port of Oakland, Oakland, CA
Rent price trends
At this time, we don't have enough information to generate yearly trends for all bedroom counts and property types in Port of Oakland, Oakland, CA. Please see below for more rent price details.
Rent prices on this page are calculated on a rolling 30-day basis and updated daily.
Rent comparables in
Port of Oakland, Oakland, CA
The monthly rent for an apartment in Port of Oakland, Oakland, CA is $4,911. A 1-bedroom apartment in Port of Oakland, Oakland, CA costs about $3,945 on average, while a 2-bedroom apartment is $5,595. Houses for rent in Port of Oakland, Oakland, CA are cheaper, with an average monthly cost of $3,450.
Comparables | ||||
|---|---|---|---|---|
1 bedroom | $4,607 | - | - | |
2 bedroom | $5,260 | - | - | |
3 bedroom | $2,900 | - | - | |
Studio | $3,775 | - | - |
Comparables | ||
|---|---|---|
Acorn | $1,799 | |
Acorn Industrial | $1,995 | |
Clawson | $2,562 | |
Golden Gate | $3,685 | |
Ocean View | $2,895 | |
South Prescott | $2,233 |
Comparables | ||||
|---|---|---|---|---|
Apartments | $4,911 | - | No Change | |
Condos | $4,500 | - | No Change | |
Houses | $3,450 | - | - |
Studio
Average rent
$3,775
1 bedroom
Average rent
$4,607
2 bedroom
Average rent
$5,260
3 bedroom
Average rent
$2,900
Ocean View
Average rent
$2,895
Acorn
Average rent
$1,799
Acorn Industrial
Average rent
$1,995
Clawson
Average rent
$2,562
Golden Gate
Average rent
$3,685
South Prescott
Average rent
$2,233
Apartments
Average rent
$4,911
Condos
Average rent
$4,500
Houses
Average rent
$3,450
The table above reflects average rent prices in Port of Oakland, Oakland, CA, broken down by the number of bedrooms, neighborhoods, and property types. The availability of data for each category is dependent on market inventory and will adjust depending on your selected filters.
Compare rent prices in Port Of Oakland, Oakland, CA to other neighborhoods
Median rent prices in Port Of Oakland, Oakland, CA for all bedroom counts and property types compared to Ocean View, Berkeley, CA.
Port Of Oakland
higher than the national median
higher than the national median
Takeaway
The median rent for all rentals in Port Of Oakland, Oakland, CA is 66% higher than the median rent in Ocean View, Berkeley, CA.
More data insights and reports

Are you interested in licensing our current and historical rental real estate data, or do you have custom data requests? Contact datalicensing@zumper.com.
Average rent in
Nearby neighborhoods
Explore rent trends in other markets