
Bedroom count
Property type
Last updated on July 30, 2026
Average rent in
Kitchener, ON
Average rent in
Last updated on July 30, 2026
Bedroom count
Property type
Key takeaways for renters
The bottom line
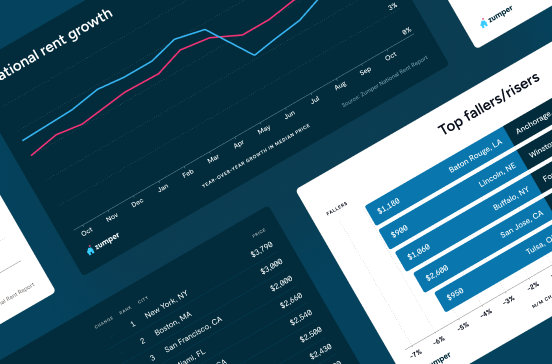
Kitchener, ON rent slipped 6.9% year over year, with a current median of $1,792/month. Renters today are paying $115 less per month on average than last year, continuing a downward trend since the 2024 peak of $2,106/month.
Compared to national trends
Kitchener sits 7.1% more affordable than the $1,930/month national median, with 178 total rentals offering a moderate market size for renters.
Rent ranges by bedroom
Studios in Kitchener run around $1,438/month, 1-bedrooms around $1,649/month, 2-bedrooms around $1,950/month, 3-bedrooms around $2,200/month, and 4+ bedrooms around $2,525/month. This spread offers renters a wide selection across unit sizes.
Median rent
Median rent in Kitchener
$1,792/mo
vs previous year
The average rent in Kitchener is $1,792 per month as of July 2026. This is 7% below the national average rent, or $137 less per month.
average price per square foot
Total rentals
Available rentals in Kitchener
178
for rent on Zumper.com as of July 2026
Rent price distribution
Share of Kitchener rentals at each price point
Rent trends in Kitchener, ON
Average rent prices in Kitchener have increased by 2% over the last month and have decreased by 7% since last year.
Rent trends
Rent prices on this page are calculated on a rolling 30-day basis and updated daily.
Compare rent prices in
Kitchener, ON
Rent prices in Kitchener vary by bedroom size, rental type, and neighborhood. The average rent for an apartment in Kitchener is $1,750, whereas a house costs $2,100. 1-bedroom apartments in Kitchener run $1,649 on average, while 2-bedroom apartments are $1,950.
Listings | ||||
|---|---|---|---|---|
Studio | $1,437 |  5% |  10% | |
1 bedroom | $1,649 | 1% | 8% | |
2 bedroom | $1,950 | 3% | 6% | |
3 bedroom | $2,200 | No Change | 12% | |
4 bedroom | $2,525 | 8% | 40% |
Listings | ||
|---|---|---|
Alpine | $1,780 | |
Cedar Hill | $1,722 | |
Centreville Chicopee | $1,750 | |
City Commercial Core | $1,660 | |
Country Hills East | $1,938 | |
Laurentian Hills | $1,764 | |
Pioneer Park | $1,730 | |
Rosemount | $1,872 | |
Vanier | $1,850 | |
Victoria Hills | $1,849 |
Listings | ||||
|---|---|---|---|---|
Apartments | $1,750 | 2% | No Change | |
Condos | $1,900 | 4% | No Change | |
Houses | $2,100 | 6% | No Change | |
Rooms | $850 | 1% | No Change |
Studio
Average rent
$1,437
Last 30 days
5%
Last year
10%
1 bedroom
Average rent
$1,649
Last 30 days
1%
Last year
8%
2 bedroom
Average rent
$1,950
Last 30 days
3%
Last year
6%
3 bedroom
Average rent
$2,200
Last 30 days
No Change
Last year
12%
4 bedroom
Average rent
$2,525
Last 30 days
8%
Last year
40%
Centreville Chicopee
Average rent
$1,750
City Commercial Core
Average rent
$1,660
Vanier
Average rent
$1,850
Victoria Hills
Average rent
$1,849
Country Hills East
Average rent
$1,938
Laurentian Hills
Average rent
$1,764
Pioneer Park
Average rent
$1,730
Rosemount
Average rent
$1,872
Alpine
Average rent
$1,780
Cedar Hill
Average rent
$1,722
Apartments
Average rent
$1,750
Last 30 days
2%
Condos
Average rent
$1,900
Last 30 days
4%
Houses
Average rent
$2,100
Last 30 days
6%
Rooms
Average rent
$850
Last 30 days
1%
The table above reflects average rent prices in Kitchener, ON, broken down by the number of bedrooms, neighborhoods, and property types. The availability of data for each category is dependent on market inventory and will adjust depending on your selected filters.
How does rent in Kitchener, ON compare to other cities?
Compare median rent prices in Kitchener and Brampton by all bedroom counts and property types.
Kitchener
lower than the national median
higher than the national median
Takeaway
The median rent for all rentals in Kitchener, ON is 19% lower than the median rent in Brampton, ON.
Average rent in nearby cities
Explore rent trends in neighboring markets
$2,200
$1,850
$2,300
$2,030
$1,755
$1,750
$2,099
$1,750
$1,870
$2,349
$2,400
$1,950
Discover rentals in Kitchener, ON

5d+ ago
Lower Doon house for rent in Kitchener
3 beds
4 baths
$850
House for rent
Available Mar 28

5d+ ago
Lower Doon house for rent in Kitchener
3 beds
3.5 baths
$850
House for rent
Available Mar 28

5d+ ago
80 Mcgee Ave, Kitchener, ON N2B 2T2
1–2 beds
1 bath
$1,349–$1,599
Apartment for rent

5d+ ago
236 Margaret Ave, Kitchener, ON N2H 4J5
1–2 beds
1 bath
$1,350–$1,549
Apartment for rent


5d+ ago
50 Otterbein Rd, Kitchener, ON N2B 0B3
1–3 beds
1–3 baths
$1,920–$3,576
Apartment for rent

4d ago
4286 King St E, Kitchener, ON N2P 2G5
1–2 beds
1–2 baths
$2,250–$2,950
Apartment for rent

3h ago
Verified
169 Borden Ave N, Kitchener, ON N2H 0E2
1–2 beds
1–2 baths
$1,730–$2,890
Apartment for rent

16h ago
475 King St E, Kitchener, ON N2G 0E6
1–2 beds
1–2 baths
$1,978–$2,750
Apartment for rent


3h ago
Verified
169 Borden Ave N, Kitchener, ON N2H 0E2
1–2 beds
1–2 baths
$1,730–$2,890
Apartment for rent

5h ago
239 Eden Oak Trail, Kitchener, ON N2A 0L5
1–2 beds
1–2 baths
$1,886–$2,313
Apartment for rent
5h ago
415 Duke St W, Kitchener, ON N2H None
1–3 beds
1–2 baths
$1,800–$2,700
Apartment for rent

7h ago
24 Brybeck Cres, Kitchener, ON N2M 2C7
1–2 beds
1 bath
$1,599–$1,849
Apartment for rent


5d+ ago
Verified
5 beds
5.5 baths
$4,600
House for rent
Available Sep 1
3h ago
Verified
169 Borden Ave N, Kitchener, ON N2H 0E2
1–2 beds
1–2 baths
$1,730–$2,890
Apartment for rent

1d ago
595 Strasburg Rd, Kitchener, ON N2E 0J7
2 beds
1 bath
$1,880–$1,970
Apartment for rent

2d ago
250 Frederick St, Kitchener, ON N2H 2N1
1–2 beds
1 bath
$1,275–$1,675
Apartment for rent


5h ago
239 Eden Oak Trail, Kitchener, ON N2A 0L5
1–2 beds
1–2 baths
$1,886–$2,313
Apartment for rent
7h ago
24 Brybeck Cres, Kitchener, ON N2M 2C7
1–2 beds
1 bath
$1,599–$1,849
Apartment for rent
8h ago
1673 Huron Rd, Kitchener, ON N2R 0T3
Studio–2 beds
1–2 baths
$1,510–$2,321
Apartment for rent
16h ago
475 King St E, Kitchener, ON N2G 0E6
1–2 beds
1–2 baths
$1,978–$2,750
Apartment for rent

Stay up to date with rental market insights

Are you interested in licensing our current and historical rental real estate data, or do you have custom data requests? Contact datalicensing@zumper.com.
Frequently asked questions for Kitchener, ON
Quick answers to common questions about the Kitchener rental market.
How much is rent in Kitchener?
The average rent in Kitchener is $1,792 per month as of July 25, 2026.
Is rent up or down in Kitchener?
Average rent prices in Kitchener have increased by 2% over the last month and have decreased by 7% since last year.
How does Kitchener rent compare to the national average?
Rent in Kitchener is 7% below the national average, which means renters are paying approximately $137 less per month.
Which neighborhoods are most affordable in Kitchener?
The most affordable neighborhoods in Kitchener are City Commercial Core ($1,660/mo), Cedar Hill ($1,722/mo), and Pioneer Park ($1,730/mo).
What salary do I need to afford rent in Kitchener?
To comfortably afford rent in Kitchener, you'd need to earn approximately $72,000/year, based on spending no more than 30% of your income on rent.
When is the best time of year to rent in Kitchener?
Based on Zumper's July 2026 data, one-bedroom apartments in Kitchener average around $1,730/month and two-bedrooms approximately $2,010/month.
Methodology
Rent prices are based on Zumper's rental listings from the past 30 days. Median rent is calculated across all available listings and property types on the platform. If you filter the page by bedroom count or property type, the pricing throughout the page will update automatically to reflect that segment of the rental market.
Household and population data come from the U.S. Census Bureau. Cost-of-living data is sourced from the Council for Community and Economic Research's Cost of Living Index (COLI).