
Bedroom count
Property type
Last updated on July 30, 2026
Average rent in
Coquitlam, BC
Average rent in
Last updated on July 30, 2026
Bedroom count
Property type
Key takeaways for renters
The bottom line
Coquitlam, BC rent slipped 6.7% year over year, with a current median of $2,295/month. Renters today are paying $239 less per month on average than last year, despite a 2.2% month-over-month increase in July 2026.
Compared to national trends
Coquitlam runs 18.9% more expensive than the $1,930/month national median, placing it in the higher price tier among Canadian metros with 145 total rentals available.
Rent ranges by bedroom
Studios in Coquitlam rent for about $1,850/month, 1-bedrooms around $2,088/month, and 2-bedrooms at $2,684/month, with 3-bedrooms at $3,500/month and 4+ bedrooms reaching $4,650/month. These bedroom tiers represent the range most renters target.
Price ranges
Houses rent for about $2,200/month while apartments are higher at $2,350/month. Apartments make up 58.4% of total rentals, reflecting the dominant property type in Coquitlam.
Median rent
Median rent in Coquitlam
$2,295/mo
vs previous year
The average rent in Coquitlam is $2,295 per month as of July 2026. This is 19% above the national average rent, or $365 more per month.
average price per square foot
Total rentals
Available rentals in Coquitlam
145
for rent on Zumper.com as of July 2026
Rent price distribution
Share of Coquitlam rentals at each price point
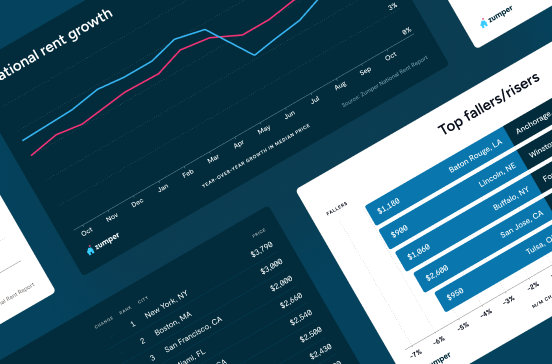
Rent trends in Coquitlam, BC
Average rent prices in Coquitlam have increased by 2% over the last month and have decreased by 7% since last year.
Rent trends
Rent prices on this page are calculated on a rolling 30-day basis and updated daily.
Compare rent prices in
Coquitlam, BC
Rent prices in Coquitlam vary by bedroom size, rental type, and neighborhood. The average rent for an apartment in Coquitlam is $2,350, whereas a house costs $2,200. 1-bedroom apartments in Coquitlam run $2,050 on average, while 2-bedroom apartments are $2,750.
Listings | ||||
|---|---|---|---|---|
Studio | $1,850 |  2% |  5% | |
1 bedroom | $2,088 | No Change | 9% | |
2 bedroom | $2,683 | 2% | 6% | |
3 bedroom | $3,500 | 3% | 3% | |
4 bedroom | $4,650 | 6% | 4% |
Listings | ||
|---|---|---|
Cape Horn | $2,150 | |
Central Coquitlam | $1,950 | |
Coquitlam West | $2,297 | |
Eagle Ridge | $2,400 | |
Hockaday Nestor | $2,425 | |
Maillardville | $2,150 | |
Ranch Park | $2,300 | |
Smilling Creek | $1,990 | |
Town Centre | $2,450 | |
Westwood Plateau | $2,100 |
Listings | ||||
|---|---|---|---|---|
Apartments | $2,350 | 2% | No Change | |
Condos | $2,250 | 2% | No Change | |
Houses | $2,200 | No Change | No Change | |
Rooms | $960 | 37% | No Change |
Studio
Average rent
$1,850
Last 30 days
2%
Last year
5%
1 bedroom
Average rent
$2,088
Last 30 days
No Change
Last year
9%
2 bedroom
Average rent
$2,683
Last 30 days
2%
Last year
6%
3 bedroom
Average rent
$3,500
Last 30 days
3%
Last year
3%
4 bedroom
Average rent
$4,650
Last 30 days
6%
Last year
4%
Coquitlam West
Average rent
$2,297
Central Coquitlam
Average rent
$1,950
Town Centre
Average rent
$2,450
Westwood Plateau
Average rent
$2,100
Eagle Ridge
Average rent
$2,400
Hockaday Nestor
Average rent
$2,425
Ranch Park
Average rent
$2,300
Maillardville
Average rent
$2,150
Cape Horn
Average rent
$2,150
Smilling Creek
Average rent
$1,990
Apartments
Average rent
$2,350
Last 30 days
2%
Condos
Average rent
$2,250
Last 30 days
2%
Houses
Average rent
$2,200
Last 30 days
No Change
Rooms
Average rent
$960
Last 30 days
37%
The table above reflects average rent prices in Coquitlam, BC, broken down by the number of bedrooms, neighborhoods, and property types. The availability of data for each category is dependent on market inventory and will adjust depending on your selected filters.
How does rent in Coquitlam, BC compare to other cities?
Compare median rent prices in Coquitlam and Burnaby by all bedroom counts and property types.
Coquitlam
higher than the national median
higher than the national median
Takeaway
The median rent for all rentals in Coquitlam, BC is equal to the median rent in Burnaby, BC.
Average rent in nearby cities
Explore rent trends in neighboring markets
$2,300
$2,295
$2,000
$1,700
$1,999
$2,995
$2,080
$2,620
$2,600
$2,000
$2,600
$5,525
Discover rentals in Coquitlam, BC

4d ago
Coquitlam West condo for rent in Coquitlam
1 bed
1 bath
$1,200
Condo for rent
Available Jun 1

3d ago
River Heights house for rent in Coquitlam
1 bed
1 bath
$1,250
House for rent
Available Aug 1

8h ago
Verified
2 beds
1 bath
$1,600
House for rent
Available Sep 1

4d ago
Cape Horn apartment for rent in Coquitlam
2 beds
1 bath
$1,750
Apartment for rent
Available Sep 1


5d+ ago
Apartment for rent in Coquitlam
4 beds
4 baths
$6,900
Apartment for rent
Available Sep 1

1d ago
537 Cottonwood Ave, Coquitlam, BC V3J 0S4
1–3 beds
1–2 baths
$2,395–$4,295
Apartment for rent

1d ago
608 Regan Ave, Coquitlam, BC V3J 0R3
1–3 beds
1–2 baths
$2,150–$3,800
Apartment for rent

5d+ ago
Coquitlam West apartment for rent in Coquitlam
2 beds
2 baths
$3,690
Apartment for rent
Available Dec 3


14m ago
Verified
641 Claremont St, Coquitlam, BC V3J 0N8
Studio–1 bed
1 bath
$1,875–$2,085
Apartment for rent
1d ago
750 Robinson St, Coquitlam, BC V3J 0P5
1–3 beds
1–2 baths
$2,015–$3,527
Apartment for rent

5d+ ago
1188 Johnson St, Coquitlam, BC V3B 0H7
2 beds
2 baths
$2,450
Apartment for rent

5d+ ago
Coquitlam West condo for rent in Coquitlam
1 bed
1 bath
$1,995
$1,895
Price drop
Condo for rent
Available Jul 30


14m ago
Verified
641 Claremont St, Coquitlam, BC V3J 0N8
Studio–1 bed
1 bath
$1,875–$2,085
Apartment for rent

2d ago
Verified
1 bed
1 bath
$2,100
Apartment for rent
Available Jul 28

5d+ ago
Verified
1 bed
1 bath
$2,000
Condo for rent
Available Sep 1

5d+ ago
Verified
Studio
1 bath
$1,244
Apartment for rent
Available Jun 1


4m ago
3100 Windsor Gate, Coquitlam, BC V3B 0P3
2 beds
2 baths
$2,800
Price drop
Apartment for rent
5d+ ago
1188 Johnson St, Coquitlam, BC V3B 0H7
2 beds
2 baths
$2,450
Apartment for rent

5d+ ago
3176 Plateau Blvd, Coquitlam, BC V3E 3J2
2 beds
2 baths
$2,380
Apartment for rent
5d+ ago
Eagle Ridge condo for rent in Coquitlam
2 beds
2 baths
$2,450
Condo for rent
Available Aug 17

Stay up to date with rental market insights

Are you interested in licensing our current and historical rental real estate data, or do you have custom data requests? Contact datalicensing@zumper.com.
Frequently asked questions for Coquitlam, BC
Quick answers to common questions about the Coquitlam rental market.
How much is rent in Coquitlam?
The average rent in Coquitlam is $2,295 per month as of July 25, 2026.
Is rent up or down in Coquitlam?
Average rent prices in Coquitlam have increased by 2% over the last month and have decreased by 7% since last year.
How does Coquitlam rent compare to the national average?
Rent in Coquitlam is 19% above the national average, which means renters are paying approximately $365 more per month.
Which neighborhoods are most affordable in Coquitlam?
The most affordable neighborhoods in Coquitlam are Central Coquitlam ($1,950/mo), Smilling Creek ($1,990/mo), and Westwood Plateau ($2,100/mo).
What salary do I need to afford rent in Coquitlam?
To comfortably afford rent in Coquitlam, you'd need to earn approximately $92,000/year, based on spending no more than 30% of your income on rent.
When is the best time of year to rent in Coquitlam?
Based on Zumper's July 2026 data, one-bedroom apartments in Coquitlam average around $2,140/month and two-bedrooms approximately $2,730/month.
Methodology
Rent prices are based on Zumper's rental listings from the past 30 days. Median rent is calculated across all available listings and property types on the platform. If you filter the page by bedroom count or property type, the pricing throughout the page will update automatically to reflect that segment of the rental market.
Household and population data come from the U.S. Census Bureau. Cost-of-living data is sourced from the Council for Community and Economic Research's Cost of Living Index (COLI).