
Bedroom count
Property type
Last updated on July 2, 2026
Average rent in
Bayonne, NJ
Average rent in
Last updated on July 2, 2026
Bedroom count
Property type
Key takeaways for renters
Where Bayonne rent stands today
Bayonne, NJ rent slipped 8.0% year over year, with a current median of $2,300/month. Renters today are paying $804 less per month on average than last year, despite a 2.2% increase month over month.
Compared to national trends
Bayonne rents are 17.9% more expensive than the $1,950/month national median, making it a pricier metro with 141 total rentals available for choice.
Rent ranges by bedroom
Studio rents in Bayonne are $2,000/month, 1-bedrooms are $1,875/month, 2-bedrooms are $2,200/month, 3-bedrooms are $2,588/month, and 4+ bedrooms reach $3,600/month. This range reflects the diversity of rental options by bedroom count.
Neighborhood spotlight
The 4+ bedroom segment in Bayonne fell 28.0% year over year, a larger decline than the overall market's 8.0% drop. This indicates a notable softening in the largest rental units compared to the citywide trend.
Median rent
Median rent in Bayonne
$2,300/mo
vs previous year
The average rent in Bayonne is $2,300 per month as of June 2026. This is 18% above the national average rent, or $350 more per month.
average price per square foot
Total rentals
Available rentals in Bayonne
141
for rent on Zumper.com as of June 2026
Rent price distribution
Share of Bayonne rentals at each price point
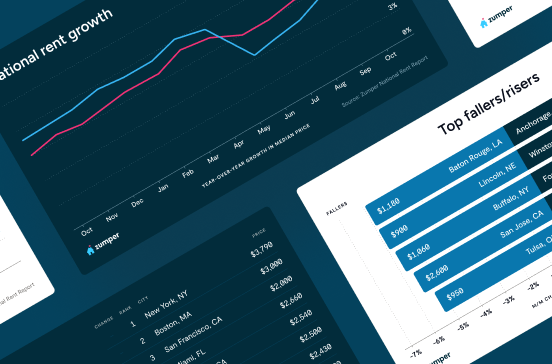
Rent trends in Bayonne, NJ
Average rent prices in Bayonne have increased by 2% over the last month and have decreased by 8% since last year.
Rent trends
Rent prices on this page are calculated on a rolling 30-day basis and updated daily.
Compare rent prices in
Bayonne, NJ
Rent prices in Bayonne vary by bedroom size, rental type, and neighborhood. The average rent for an apartment in Bayonne is $2,200, whereas a house costs $2,575. 1-bedroom apartments in Bayonne run $1,850 on average, while 2-bedroom apartments are $2,150.
Listings | ||||
|---|---|---|---|---|
Studio | $2,000 |  10% |  2% | |
1 bedroom | $1,875 | 5% | 2% | |
2 bedroom | $2,200 | 4% | 8% | |
3 bedroom | $2,587 | No Change | 20% | |
4 bedroom | $3,600 | 4% | 61% |
Listings | ||
|---|---|---|
Bayonne | $2,100 | |
Constable Hook | $2,250 |
Listings | ||||
|---|---|---|---|---|
Apartments | $2,200 | 4% | No Change | |
Condos | $2,475 | 9% | No Change | |
Houses | $2,575 | 3% | No Change |
Studio
Average rent
$2,000
Last 30 days
10%
Last year
2%
1 bedroom
Average rent
$1,875
Last 30 days
5%
Last year
2%
2 bedroom
Average rent
$2,200
Last 30 days
4%
Last year
8%
3 bedroom
Average rent
$2,587
Last 30 days
No Change
Last year
20%
4 bedroom
Average rent
$3,600
Last 30 days
4%
Last year
61%
Constable Hook
Average rent
$2,250
Bayonne
Average rent
$2,100
Apartments
Average rent
$2,200
Last 30 days
4%
Condos
Average rent
$2,475
Last 30 days
9%
Houses
Average rent
$2,575
Last 30 days
3%
The table above reflects average rent prices in Bayonne, NJ, broken down by the number of bedrooms, neighborhoods, and property types. The availability of data for each category is dependent on market inventory and will adjust depending on your selected filters.
How does rent in Bayonne, NJ compare to other cities?
Compare median rent prices in Bayonne and Bloomfield by all bedroom counts and property types.
Bayonne
higher than the national median
higher than the national median
Takeaway
The median rent for all rentals in Bayonne, NJ is 8% lower than the median rent in Bloomfield, NJ.
Average rent in nearby cities
Explore rent trends in neighboring markets
$2,500
$2,450
$1,961
$2,200
$4,007
$2,000
$2,830
$2,100
$4,500
$2,800
$2,100
$3,127
Discover rentals in Bayonne, NJ

10h ago
123 W 54th St, Bayonne, NJ 07002
2 beds
1 bath
$1,575
Apartment for rent

5d+ ago
Constable Hook apartment for rent in Bayonne
153 W 20th St, Bayonne, NJ 07002
2 beds
1 bath
$1,650
Apartment for rent

21h ago
Constable Hook apartment for rent in Bayonne
80 W 18th St #5, Bayonne, NJ 07002
2 beds
1 bath
$1,850
$1,700
Price drop
Apartment for rent

1d ago
Constable Hook apartment for rent in Bayonne
25 W 15th St #6, Bayonne, NJ 07002
2 beds
1 bath
$1,700
Apartment for rent


5d+ ago
Constable Hook apartment for rent in Bayonne
700 Avenue C #B, Bayonne, NJ 07002
2 beds
1 bath
$5,500
Apartment for rent
Available Jul 25

5d+ ago
Constable Hook townhouse for rent in Bayonne
18 Ward Street, Bayonne, NJ 07002
2 beds
3 baths
$5,000
House for rent

6h ago
Constable Hook condo for rent in Bayonne
175 Avenue F #2-2, Bayonne, NJ 07002
2 beds
2 baths
$3,850
Condo for rent
Available Jul 1

4d ago
Verified
302 Constitution Ave, Bayonne, NJ 07002
1–2 beds
1–2 baths
$2,688–$3,811
Apartment for rent


4d ago
Verified
302 Constitution Ave, Bayonne, NJ 07002
1–2 beds
1–2 baths
$2,688–$3,811
Apartment for rent

2h ago
68 W 25th St, Bayonne, NJ 07002
2 beds
1 bath
$2,375
Apartment for rent

6h ago
Constable Hook condo for rent in Bayonne
175 Avenue F #2-1, Bayonne, NJ 07002
1 bed
1 bath
$2,750
Condo for rent
Available Jul 1
6h ago
Constable Hook condo for rent in Bayonne
175 Avenue F #2-2, Bayonne, NJ 07002
2 beds
2 baths
$3,850
Condo for rent
Available Jul 1


5d+ ago
Verified
111 Avenue A #3, Bayonne, NJ 07002
2 beds
1 bath
$1,800
Apartment for rent
Available Jul 1

1d ago
514 Kennedy Blvd, Bayonne, NJ 07002
2 beds
1 bath
$2,100
Apartment for rent
4d ago
Verified
302 Constitution Ave, Bayonne, NJ 07002
1–2 beds
1–2 baths
$2,688–$3,811
Apartment for rent

5d+ ago
Constable Hook apartment for rent in Bayonne
1 bed
1 bath
$1,650
Apartment for rent
Available Jul 1


5d+ ago
Verified
111 Avenue A #3, Bayonne, NJ 07002
2 beds
1 bath
$1,800
Apartment for rent
Available Jul 1
4d ago
Verified
302 Constitution Ave, Bayonne, NJ 07002
1–2 beds
1–2 baths
$2,688–$3,811
Apartment for rent

5d+ ago
Verified
1 bed
1 bath
$1,699
Apartment for rent
Available Jun 13
5d+ ago
Constable Hook apartment for rent in Bayonne
1 bed
1 bath
$1,650
Apartment for rent
Available Jul 1


Stay up to date with rental market insights

Are you interested in licensing our current and historical rental real estate data, or do you have custom data requests? Contact datalicensing@zumper.com.
Frequently asked questions for Bayonne, NJ
Quick answers to common questions about the Bayonne rental market.
How much is rent in Bayonne?
The average rent in Bayonne is $2,300 per month as of June 27, 2026.
Is rent up or down in Bayonne?
Average rent prices in Bayonne have increased by 2% over the last month and have decreased by 8% since last year.
How does Bayonne rent compare to the national average?
Rent in Bayonne is 18% above the national average, which means renters are paying approximately $350 more per month.
What salary do I need to afford rent in Bayonne?
To comfortably afford rent in Bayonne, you'd need to earn approximately $92,000/year, based on spending no more than 30% of your income on rent.
When is the best time of year to rent in Bayonne?
Bayonne's 2025 rental market shows 1-bedroom apartments averaging around $2,200 per month, while 2-bedroom units average around $2,500 monthly. These figures represent the current market rates across the city's diverse rental inventory.
Methodology
Rent prices are based on Zumper's rental listings from the past 30 days. Median rent is calculated across all available listings and property types on the platform. If you filter the page by bedroom count or property type, the pricing throughout the page will update automatically to reflect that segment of the rental market.
Household and population data come from the U.S. Census Bureau. Cost-of-living data is sourced from the Council for Community and Economic Research's Cost of Living Index (COLI).