Price Decreases Slow in Expensive Markets
Price decreases slowed on average for the 3rd consecutive month in expensive markets, indicating that prices in these cities may be approaching a floor and stabilization could happen in the near future. Monthly growth rates in median 1-bedroom prices in the nation’s top 7 rental markets were on average 0.8 percentage points higher than the month prior, which is the highest average growth rate change in these markets all year. Notable outliers to this trend were San Francisco and New York City, the nation’s two most expensive rental markets, which both had lower growth rates last month than the month prior. Growth rates in most of these 7 markets remain negative, but not as low as they were throughout the summer months. The nation’s top 7 rental markets are the 7 most expensive cities by 1-bedroom median price: San Francisco; New York City; Boston; San Jose, Oakland; Los Angeles; and Washington DC.
Pandemic Destination Cities Grow Faster
Similar to the top 7 expensive markets that have undergone historic price drops since March, a group of 7 cities have emerged as high growth cities over the same time period: Providence, RI; Cleveland, OH; Indianapolis, IN; Durham, NC; Newark, NJ; St. Petersburg, FL; and St. Louis, MO. These 7 cities have all grown more than 18% in median 1-bedroom price since March of this year, and they appear to be growing at a faster rate- growth rates in these cities were on average 2 percentage points higher last month than the month prior. These historically cheaper cities have become desirable destinations for Americans that have migrated since March. Several of these cities like Newark and Providence serve as cheaper alternatives to a neighboring, more expensive market (New York City and Boston, respectively). Other cities in this group are historically cheaper markets in the Midwest where a renter’s dollar goes further in terms of square footage and bedroom number. These 7 cities have climbed quickly up the price rankings, and they will likely climb higher given their acceleration combined with sustained decreases in more expensive markets.
Nationally
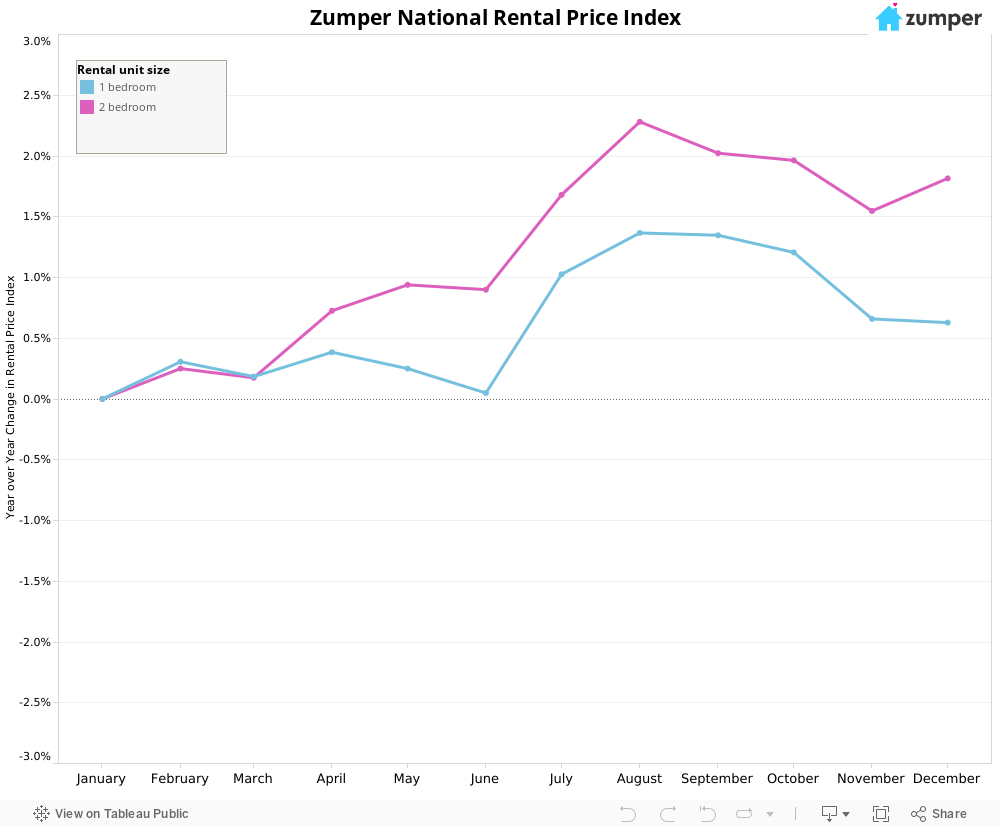
Overall, the national 1-bedroom median rent remained flat last month at $1224, while the 2-bedroom median increased 0.3% to $1487. In year-to-date terms, the 1-bedroom median was up 0.6% and the 2-bedroom median was up 1.8%.
Notable Changes this Past Month
Upward
1. Indianapolis, IN saw 1-bedroom median rent increase the most from the month prior, up 8.7% to $1000 and rank as the 61st most expensive rental market.
2. Cleveland, OH had the second highest monthly growth rate for 1-bedroom median rent at 8.4%. Cleveland ranked as the 40th most expensive market last month.
3. Tuscon, AZ saw median 1-bedroom rent climb 8.3% from the prior month, and ranked as the 89th most expensive rental market.
4. St. Louis, MO saw an increase of 8.2% to its 1-bedroom median rent from the prior month to $1050.
5. Newark, NJ had an increase of 8.1% in median 1-bedroom rent to $1600 and was the 13th most expensive rental market.
Downward
1. Laredo, TX had the largest decrease in 1-bedroom median rent from the prior month at -5.3% to $720.
2. Madison, WI had the second highest monthly decrease in 1-bedroom median rent at -5.1%. Madison ranked as the 46th most expensive market.
3. Chesapeake, VA and Lincoln, NE rents tied for having the 3rd highest monthly decrease at -4.8% in 1-bedroom median rent. Chesapeake and Lincoln ranked as the 39th and 88th most expensive markets.
4. Baltimore, MD had the 4th largest monthly decrease at -4.7% in 1-bedroom median rent.
5. Tulsa, OK had the 5th largest decrease in 1-bedroom median rent at -4.4% from the prior month to $650.

Full Data
| 1 Bedroom | 2 Bedrooms | ||||||
|---|---|---|---|---|---|---|---|
| Pos. | City | Price | M/M % | Y/Y % | Price | M/M % | Y/Y % |
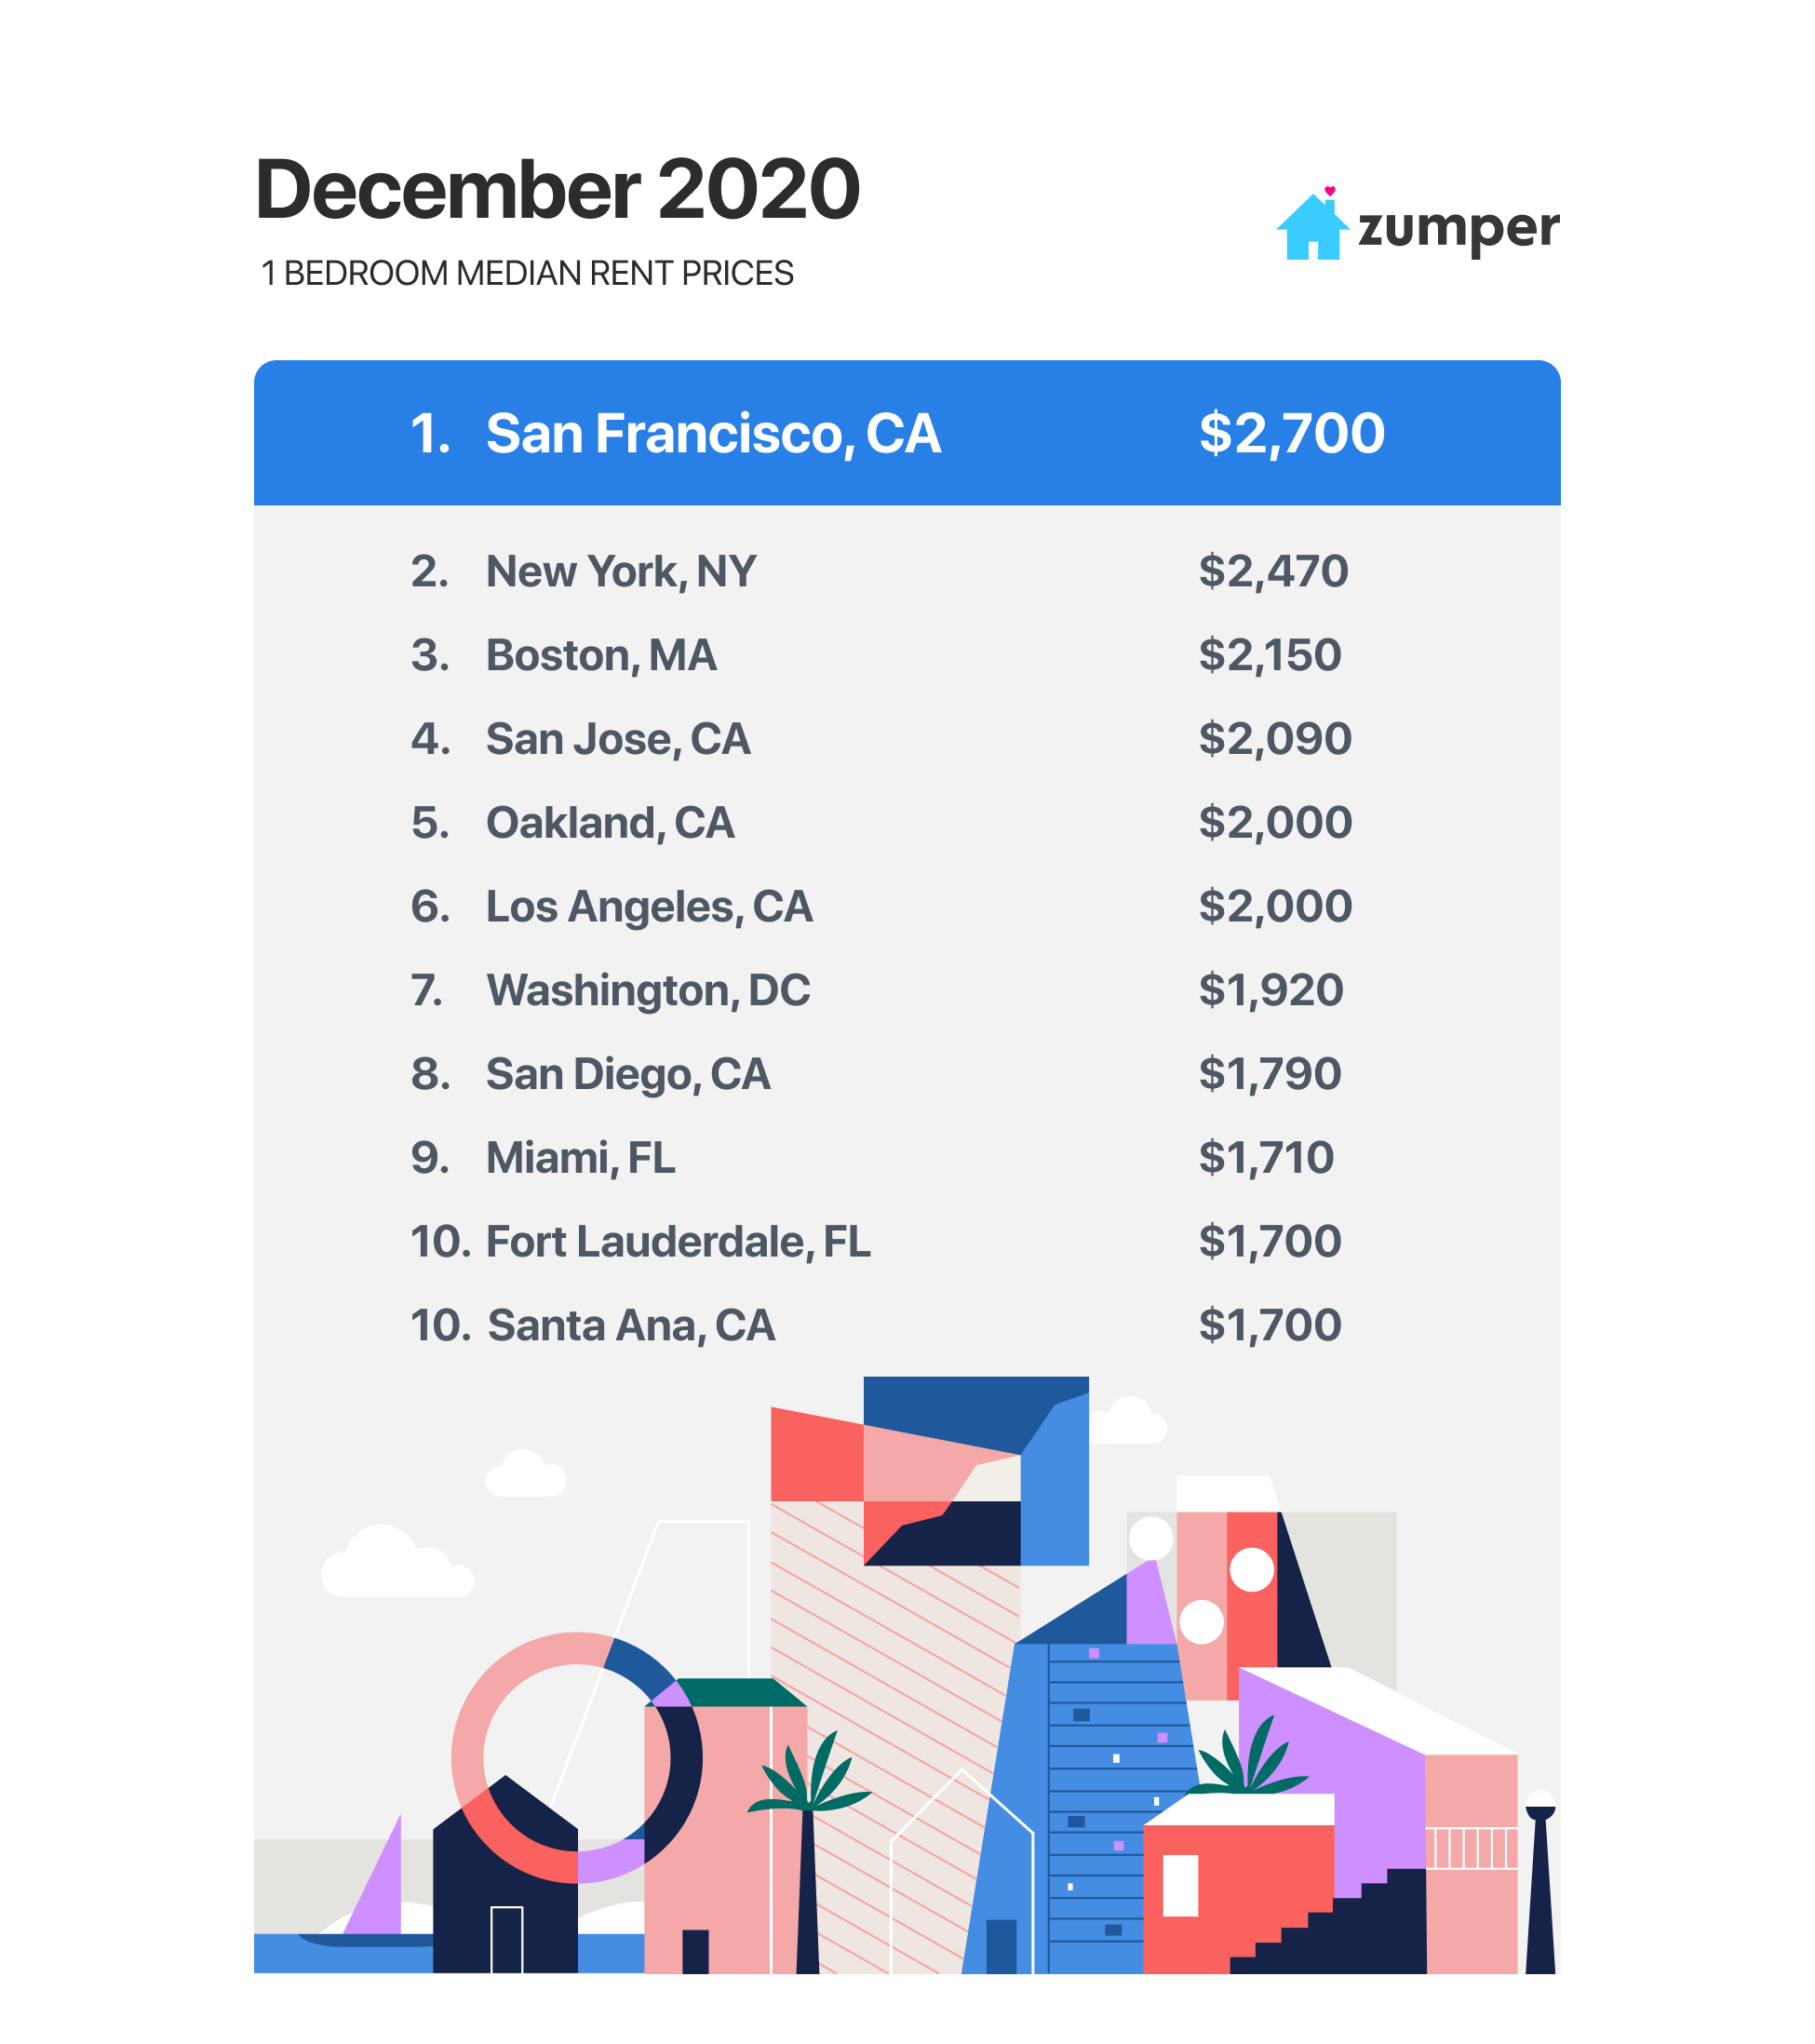
| 1 | San Francisco, Californie | $2,700 | -3.60% | -22.60% | $3,570 | -3.30% | -20.70% |
| 2 | New York, NY | $2,470 | -3.10% | -16.80% | $2,800 | -3.40% | -18.40% |
| 3 | Boston, Massachusetts | $2,150 | -2.70% | -14.00% | $2,600 | -3.00% | -11.90% |
| 4 | San Jose, CA | $2,090 | -1.40% | -14.70% | $2,650 | -1.10% | -8.60% |
| 5 | Oakland, CA | $2,000 | -1.00% | -19.00% | $2,600 | -1.10% | -13.00% |
| 5 | Los Angeles, Californie | $2,000 | 0.00% | -9.50% | $2,720 | -2.20% | -12.30% |
| 7 | Washington, D.C. | $1,920 | -2.00% | -12.70% | $2,700 | 0.70% | -10.00% |
| 8 | San Diego, CA | $1,790 | 0.00% | 0.60% | $2,340 | -1.30% | -0.40% |
| 9 | Miami, Floride | $1,710 | -2.30% | 0.00% | $2,280 | -1.30% | 3.60% |
| 10 | Fort Lauderdale, FL | $1,700 | 1.20% | 6.30% | $2,200 | 1.40% | 1.90% |
| 10 | Santa Ana, CA | $1,700 | 3.70% | 2.40% | $2,290 | 2.70% | 8.00% |
| 12 | Anaheim, CA | $1,660 | 2.50% | 2.50% | $1,990 | -0.50% | -2.50% |
| 13 | Newark, NJ | $1,600 | 8.10% | 21.20% | $1,800 | -1.10% | 16.10% |
| 14 | Providence, RI | $1,570 | -3.10% | 11.30% | $1,800 | 1.70% | 11.10% |
| 15 | Long Beach, CA | $1,550 | -1.30% | 0.00% | $2,100 | 2.90% | 5.00% |
| 15 | Scottsdale, AZ | $1,550 | 4.70% | 6.90% | $2,100 | 5.00% | 1.40% |
| 17 | Seattle, WA | $1,540 | -3.80% | -17.20% | $2,030 | -3.30% | -11.70% |
| 18 | Honolulu, HI | $1,500 | -1.30% | -6.30% | $2,100 | -2.80% | 0.00% |
| 19 | Chicago, Illinois | $1,470 | -2.00% | 2.10% | $1,790 | -0.60% | 5.30% |
| 19 | New Orleans, LA | $1,470 | 2.80% | 4.30% | $1,700 | 0.00% | 9.70% |
| 21 | Atlanta, Géorgie | $1,460 | -0.70% | 2.10% | $1,900 | 0.00% | 4.40% |
| 21 | Sacramento, CA | $1,460 | 0.70% | 15.90% | $1,800 | 4.00% | 24.10% |
| 23 | Philadelphie, Pennsylvanie | $1,440 | -3.40% | -4.00% | $1,700 | -2.90% | 3.70% |
| 24 | Denver, Colorado | $1,420 | 1.40% | -6.60% | $1,910 | -0.50% | 0.50% |
| 25 | Portland, Oregon | $1,400 | 0.00% | -2.10% | $1,750 | -2.80% | 2.90% |
| 26 | Gilbert, AZ | $1,300 | 0.00% | 5.70% | $1,570 | 0.00% | 9.80% |
| 26 | Chandler, AZ | $1,300 | 0.80% | 7.40% | $1,540 | 2.00% | 8.50% |
| 26 | Minneapolis, MN | $1,300 | 0.80% | -5.80% | $1,780 | -2.20% | -2.20% |
| 26 | St Petersburg, FL | $1,300 | 2.40% | 23.80% | $1,740 | 4.20% | 24.30% |
| 30 | Austin, Texas | $1,290 | 0.80% | 4.90% | $1,600 | 0.60% | 3.20% |
| 31 | Nashville, TN | $1,260 | -0.80% | -11.30% | $1,430 | 0.70% | -2.70% |
| 32 | Dallas, Texas | $1,250 | 1.60% | 5.00% | $1,680 | 1.80% | 5.00% |
| 33 | Henderson, NV | $1,240 | 2.50% | 9.70% | $1,370 | 0.70% | 3.00% |
| 34 | Baltimore, MD | $1,220 | -4.70% | 6.10% | $1,530 | -5.00% | 9.30% |
| 35 | Orlando, Floride | $1,210 | 0.80% | -3.20% | $1,400 | 0.70% | 0.00% |
| 36 | Charlotte, Caroline du Nord | $1,200 | -1.60% | 0.00% | $1,410 | -1.40% | 8.50% |
| 36 | Richmond, VA | $1,200 | 0.80% | 12.10% | $1,380 | -2.10% | 3.00% |
| 38 | Tampa, Floride | $1,190 | 0.00% | 6.30% | $1,410 | 0.70% | 6.00% |
| 39 | Chesapeake, VA | $1,180 | -4.80% | 3.50% | $1,250 | -3.10% | 1.60% |
| 40 | Cleveland, OH | $1,160 | 8.40% | 23.40% | $1,240 | 6.90% | 24.00% |
| 41 | Durham, NC | $1,150 | 0.90% | 7.50% | $1,280 | 3.20% | 7.60% |
| 42 | Pittsburgh, PA | $1,140 | 2.70% | -2.60% | $1,340 | 3.10% | -0.70% |
| 42 | Plano, TX | $1,140 | 4.60% | -3.40% | $1,510 | 2.70% | -5.00% |
| 44 | Fresno, CA | $1,130 | 3.70% | 18.90% | $1,360 | 3.00% | 15.30% |
| 44 | Virginia Beach, VA | $1,130 | 4.60% | 7.60% | $1,280 | 0.00% | 4.90% |
| 46 | Madison, WI | $1,120 | -5.10% | -6.70% | $1,400 | -0.70% | 5.30% |
| 46 | Houston, Texas | $1,120 | 0.00% | 7.70% | $1,380 | 0.70% | 7.80% |
| 48 | Boise, ID | $1,110 | 2.80% | 12.10% | $1,210 | 2.50% | 0.80% |
| 48 | Raleigh, NC | $1,110 | 4.70% | 11.00% | $1,290 | 4.90% | 9.30% |
| 50 | Aurora, CO | $1,100 | 0.00% | 0.00% | $1,460 | 1.40% | 5.00% |
| 51 | Milwaukee, WI | $1,090 | 4.80% | -2.70% | $1,260 | 5.00% | 3.30% |
| 52 | Reno, NV | $1,060 | 1.00% | 1.00% | $1,380 | -1.40% | 6.20% |
| 52 | Fort Worth, TX | $1,060 | 2.90% | 1.00% | $1,380 | 5.30% | 11.30% |
| 54 | Las Vegas, Nevada | $1,050 | 1.00% | 9.40% | $1,210 | -3.20% | 4.30% |
| 54 | St Louis, MO | $1,050 | 8.20% | 22.10% | $1,260 | -0.80% | 11.50% |
| 56 | Chattanooga, TN | $1,040 | 2.00% | 15.60% | $1,200 | 1.70% | 17.60% |
| 56 | Salt Lake City, UT | $1,040 | 2.00% | -5.50% | $1,340 | 3.10% | 0.80% |
| 58 | Phoenix, Arizona | $1,020 | -1.90% | 3.00% | $1,280 | 0.00% | 2.40% |
| 58 | Kansas City, MO | $1,020 | 3.00% | 7.40% | $1,170 | 0.00% | 12.50% |
| 60 | Irving, TX | $1,010 | 1.00% | -8.20% | $1,340 | -1.50% | -3.60% |
| 61 | Buffalo, NY | $1,000 | -2.90% | -12.30% | $1,140 | -5.80% | -20.30% |
| 61 | Rochester, NY | $1,000 | 2.00% | 8.70% | $1,200 | 0.80% | 10.10% |
| 61 | Jacksonville, FL | $1,000 | 4.20% | 12.40% | $1,200 | 3.40% | 18.80% |
| 61 | Indianapolis, IN | $1,000 | 8.70% | 22.00% | $1,050 | 5.00% | 16.70% |
| 65 | Mesa, AZ | $990 | 3.10% | 7.60% | $1,240 | 3.30% | 8.80% |
| 65 | Colorado Springs, CO | $990 | 5.30% | -1.00% | $1,290 | 4.90% | 7.50% |
| 67 | Norfolk, VA | $970 | 0.00% | 5.40% | $1,030 | 1.00% | 7.30% |
| 68 | Anchorage, AK | $950 | 0.00% | 5.60% | $1,200 | 0.00% | 4.30% |
| 68 | Cincinnati, OH | $950 | 0.00% | 5.60% | $1,160 | 3.60% | -5.70% |
| 70 | Glendale, AZ | $930 | 1.10% | 2.20% | $1,170 | 0.00% | 10.40% |
| 70 | San Antonio, TX | $930 | 3.30% | 3.30% | $1,140 | 0.90% | 3.60% |
| 72 | Des Moines, IA | $910 | 2.20% | 11.00% | $960 | 1.10% | 6.70% |
| 73 | Arlington, TX | $900 | 1.10% | 3.40% | $1,180 | 0.00% | 6.30% |
| 73 | Louisville, KY | $900 | 4.70% | 4.70% | $970 | 1.00% | 2.10% |
| 75 | Spokane, WA | $860 | -3.40% | 10.30% | $1,120 | 0.00% | 14.30% |
| 76 | Columbus, Ohio | $850 | 0.00% | 1.20% | $1,100 | -2.70% | 3.80% |
| 76 | Memphis, TN | $850 | 1.20% | 4.90% | $900 | 1.10% | 5.90% |
| 78 | Bakersfield, CA | $840 | 1.20% | 3.70% | $1,050 | 1.00% | 12.90% |
| 78 | Corpus Christi, TX | $840 | 2.40% | -2.30% | $1,110 | 4.70% | 5.70% |
| 80 | Omaha, NE | $830 | 0.00% | 3.80% | $1,090 | 3.80% | 11.20% |
| 80 | Augusta, GA | $830 | 2.50% | 10.70% | $920 | 4.50% | 10.80% |
| 82 | Baton Rouge, LA | $820 | 2.50% | 3.80% | $940 | 3.30% | 8.00% |
| 82 | Knoxville, TN | $820 | 2.50% | 1.20% | $950 | 0.00% | 1.10% |
| 82 | Detroit, MI | $820 | 7.90% | 18.80% | $980 | 8.90% | 21.00% |
| 85 | Syracuse, NY | $800 | 0.00% | -5.90% | $1,010 | 1.00% | 0.00% |
| 85 | Tallahassee, FL | $800 | 1.30% | 0.00% | $950 | 0.00% | 5.60% |
| 85 | Winston Salem, NC | $800 | 5.30% | 1.30% | $870 | 2.40% | 4.80% |
| 88 | Lincoln, NE | $790 | -4.80% | -2.50% | $920 | -2.10% | 0.00% |
| 89 | Albuquerque, NM | $780 | 4.00% | 13.00% | $970 | 3.20% | 19.80% |
| 89 | Tucson, AZ | $780 | 8.30% | 18.20% | $1,020 | 8.50% | 18.60% |
| 91 | Greensboro, NC | $770 | 2.70% | 6.90% | $900 | 4.70% | 8.40% |
| 92 | Oklahoma City, OK | $760 | 0.00% | 4.10% | $920 | 1.10% | 5.70% |
| 93 | Lexington, KY | $740 | 1.40% | 4.20% | $900 | 1.10% | -2.20% |
| 94 | Laredo, TX | $720 | -5.30% | -4.00% | $950 | 4.40% | 0.00% |
| 95 | El Paso, TX | $700 | 1.40% | 4.50% | $850 | 1.20% | 7.60% |
| 96 | Tulsa, OK | $650 | -4.40% | -3.00% | $820 | -1.20% | -2.40% |
| 96 | Lubbock, TX | $650 | 0.00% | 0.00% | $810 | 3.80% | 2.50% |
| 96 | Shreveport, LA | $650 | 0.00% | 1.60% | $750 | 0.00% | 7.10% |
| 99 | Wichita, KS | $630 | 5.00% | -6.00% | $770 | 5.50% | 6.90% |
| 100 | Akron, OH | $570 | 0.00% | -9.50% | $730 | 1.40% | 4.30% |
About
The Zumper National Rent Report analyzes rental data from over 1 million active listings across the United States. Data is aggregated on a monthly basis to calculate median asking rents for the top 100 metro areas by population, providing a comprehensive view of the current state of the market. The report is based on all data available in the month prior to publication.
If you’re interested in a more in-depth explanation of how and why we calculate our rent data, view our methodology post.
To keep up to date with rent changes across the country, like or follow Zumper on Facebook, Gazouillement, and Instagram. In the market for a new place? Search apartments for rent on Zumper.
Contenu associé