
Bedroom count
Property type
Last updated on July 29, 2026
Average rent in
Pleasanton, TX
Average rent in
Last updated on July 29, 2026
Bedroom count
Property type
Median rent
Median rent in Pleasanton
$1,200/mo
vs previous year
The average rent in Pleasanton is $1,200 per month as of July 2026. This is 38% below the national average rent, or $730 less per month.
average price per square foot
Total rentals
Available rentals in Pleasanton
21
for rent on Zumper.com as of July 2026
Rent price distribution
Share of Pleasanton rentals at each price point
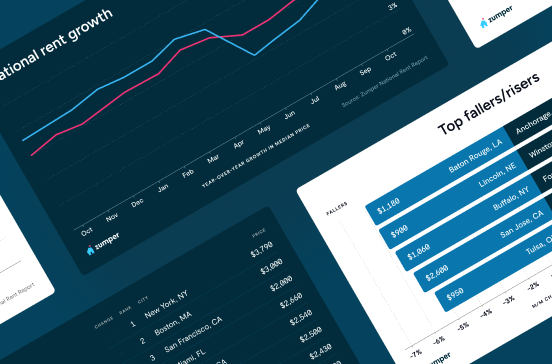
Rent trends in Pleasanton, TX
Average rent prices in Pleasanton have decreased by 8% over the last month and have increased by 9% since last year.
Rent trends
Rent prices on this page are calculated on a rolling 30-day basis and updated daily.
Compare rent prices in
Pleasanton, TX
Rent prices in Pleasanton vary by bedroom size, rental type, and neighborhood. The average rent for an apartment in Pleasanton is $1,085, whereas a house costs $1,447. 1-bedroom apartments in Pleasanton run $995 on average, while 2-bedroom apartments are $950.
Listings | ||||
|---|---|---|---|---|
Studio | $485 |  10% | 39% | |
1 bedroom | $925 | 1% |  6% | |
2 bedroom | $895 | 5% | 9% | |
3 bedroom | $1,642 | 3% | 5% | |
4 bedroom | $1,813 | 5% | 28% |
At this time, we don't have enough active inventory for all rentals to generate data. Please check back soon to see neighborhood rent prices in Pleasanton, TX.
Listings | ||||
|---|---|---|---|---|
Apartments | $1,085 | 2% | No Change | |
Condos | $895 | 3% | - | |
Houses | $1,447 | 2% | No Change | |
Rooms | $765 | No Change | - |
Studio
Average rent
$485
Last 30 days
10%
Last year
39%
1 bedroom
Average rent
$925
Last 30 days
1%
Last year
6%
2 bedroom
Average rent
$895
Last 30 days
5%
Last year
9%
3 bedroom
Average rent
$1,642
Last 30 days
3%
Last year
5%
4 bedroom
Average rent
$1,813
Last 30 days
5%
Last year
28%
At this time, we don't have enough active inventory for all rentals to generate data. Please check back soon to see neighborhood rent prices in Pleasanton, TX.
Apartments
Average rent
$1,085
Last 30 days
2%
Condos
Average rent
$895
Last 30 days
3%
Houses
Average rent
$1,447
Last 30 days
2%
Rooms
Average rent
$765
The table above reflects average rent prices in Pleasanton, TX, broken down by the number of bedrooms, neighborhoods, and property types. The availability of data for each category is dependent on market inventory and will adjust depending on your selected filters.
How does rent in Pleasanton, TX compare to other cities?
Compare median rent prices in Pleasanton and Boerne by all bedroom counts and property types.
Pleasanton
lower than the national median
higher than the national median
Takeaway
The median rent for all rentals in Pleasanton, TX is 44% lower than the median rent in Boerne, TX.
Average rent in nearby cities
Explore rent trends in neighboring markets
$2,149
$2,350
$925
$1,550
$1,195
$1,240
$1,795
$1,747
$1,598
$1,302
$1,600
$1,352
Discover rentals in Pleasanton, TX

5d+ ago
Apartment for rent in Pleasanton
2 beds
1 bath
$950
Apartment for rent

2d ago
House for rent in Pleasanton
401 W Adams St, Pleasanton, TX 78064
2 beds
1 bath
$1,025
House for rent

2d ago
Condo for rent in Pleasanton
821 Nancy Ln #A, Pleasanton, TX 78064
2 beds
1.5 baths
$1,050
Condo for rent
Available Sep 18

5d+ ago
House for rent in Pleasanton
215 & 213 COUGHRAN RD, Pleasanton, TX 78064
3 beds
1 bath
$1,300
House for rent


5d+ ago
Apartment for rent in Pleasanton
10471 U.S. 281 - 1 #1, Pleasanton, TX 78064
Studio
0 baths
$3,500
Apartment for rent
Available Apr 6

5d+ ago
1270 W Oaklawn Rd, Pleasanton, TX 78064
1 bed
1 bath
$1,105
Apartment for rent

1d ago
128 Winship Rd, Pleasanton, TX 78064
Studio–2 beds
1 bath
$895–$1,100
Apartment for rent

5d+ ago
Apartment for rent in Pleasanton
1407 5th St #A, Pleasanton, TX 78064
1 bed
1 bath
$1,085
Apartment for rent
Available Jul 1


2d ago
Apartment for rent in Pleasanton
119 Circle Ct #129, Pleasanton, TX 78064
1 bed
1 bath
$995
Apartment for rent
Available Dec 26
2d ago
House for rent in Pleasanton
401 W Adams St, Pleasanton, TX 78064
2 beds
1 bath
$1,025
House for rent
5d+ ago
1270 W Oaklawn Rd, Pleasanton, TX 78064
1 bed
1 bath
$1,105
Apartment for rent
5d+ ago
House for rent in Pleasanton
133 Bronco Rdg, Pleasanton, TX 78064
3 beds
2 baths
$1,445
House for rent

5d+ ago
House for rent in Pleasanton
3 beds
1.5 baths
$1,450
House for rent
5d+ ago
House for rent in Pleasanton
733 Commerce St, Pleasanton, TX 78064
4 beds
1 bath
$1,685
House for rent
5d+ ago
House for rent in Pleasanton
133 Bronco Rdg, Pleasanton, TX 78064
3 beds
2 baths
$1,445
House for rent
5d+ ago
Apartment for rent in Pleasanton
737 Commerce St #2A, Pleasanton, TX 78064
1 bed
1 bath
$965
Apartment for rent
Available Jul 1
1d ago
128 Winship Rd, Pleasanton, TX 78064
2 beds
1 bath
$895
Apartment for rent
2d ago
Condo for rent in Pleasanton
821 Nancy Ln #A, Pleasanton, TX 78064
2 beds
1.5 baths
$1,050
Condo for rent
Available Sep 18
5d+ ago
Apartment for rent in Pleasanton
2 beds
1 bath
$950
Apartment for rent
5d+ ago
House for rent in Pleasanton
733 Commerce St, Pleasanton, TX 78064
4 beds
1 bath
$1,685
House for rent
Stay up to date with rental market insights

Are you interested in licensing our current and historical rental real estate data, or do you have custom data requests? Contact datalicensing@zumper.com.
Frequently asked questions for Pleasanton, TX
Quick answers to common questions about the Pleasanton rental market.
How much is rent in Pleasanton?
The average rent in Pleasanton is $1,200 per month as of July 25, 2026.
Is rent up or down in Pleasanton?
Average rent prices in Pleasanton have decreased by 8% over the last month and have increased by 9% since last year.
How does Pleasanton rent compare to the national average?
Rent in Pleasanton is 38% below the national average, which means renters are paying approximately $730 less per month.
What salary do I need to afford rent in Pleasanton?
To comfortably afford rent in Pleasanton, you'd need to earn approximately $48,000/year, based on spending no more than 30% of your income on rent.
When is the best time of year to rent in Pleasanton?
Based on our current listings, 26% of Pleasanton apartments are pet-friendly, which works out to about 11 pet-welcoming units each month across the city's average of 43 available rentals.
Methodology
Rent prices are based on Zumper's rental listings from the past 30 days. Median rent is calculated across all available listings and property types on the platform. If you filter the page by bedroom count or property type, the pricing throughout the page will update automatically to reflect that segment of the rental market.
Household and population data come from the U.S. Census Bureau. Cost-of-living data is sourced from the Council for Community and Economic Research's Cost of Living Index (COLI).