
Bedroom count
Property type
Last updated on July 2, 2026
Average rent in
Layton, UT
Average rent in
Last updated on July 2, 2026
Bedroom count
Property type
Key takeaways for renters
The bottom line
Layton, UT rent slipped 4.4% year over year, with a current median of $1,649/month. Renters today are paying $112 less per month on average than last year, despite a 3.1% increase month over month.
Compared to national trends
Layton sits 15.4% more affordable than the $1,950/month national median, offering a moderately priced market with 72 total rentals available.
Price ranges
Studios in Layton rent for $699/month, 1-bedrooms for $1,256/month, and 2-bedrooms for $1,475/month, with 3-bedrooms at $2,050/month and 4+ bedrooms at $2,525/month. Houses carry a median rent of $2,149/month, while apartments are more affordable at $1,395/month.
Median rent
Median rent in Layton
$1,649/mo
vs previous year
The average rent in Layton is $1,649 per month as of June 2026. This is 15% below the national average rent, or $301 less per month.
average price per square foot
Total rentals
Available rentals in Layton
72
for rent on Zumper.com as of June 2026
Rent price distribution
Share of Layton rentals at each price point
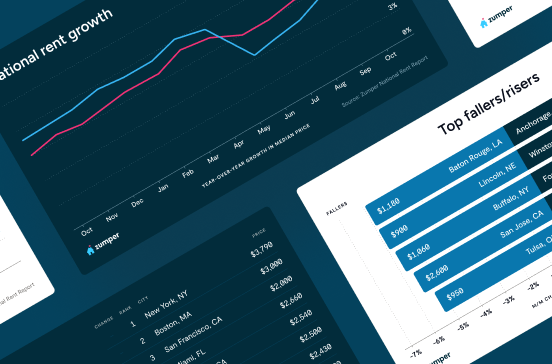
Rent trends in Layton, UT
Average rent prices in Layton have increased by 3% over the last month and have decreased by 4% since last year.
Rent trends
Rent prices on this page are calculated on a rolling 30-day basis and updated daily.
Compare rent prices in
Layton, UT
Rent prices in Layton vary by bedroom size, rental type, and neighborhood. The average rent for an apartment in Layton is $1,395, whereas a house costs $2,149. 1-bedroom apartments in Layton run $1,275 on average, while 2-bedroom apartments are $1,445.
Listings | ||||
|---|---|---|---|---|
Studio | $699 |  1% |  7% | |
1 bedroom | $1,256 | 3% | 8% | |
2 bedroom | $1,475 | No Change | 6% | |
3 bedroom | $2,050 | 1% | 7% | |
4 bedroom | $2,525 | 2% | 5% |
At this time, we don't have enough active inventory for all rentals to generate data. Please check back soon to see neighborhood rent prices in Layton, UT.
Listings | ||||
|---|---|---|---|---|
Apartments | $1,395 | 4% | No Change | |
Condos | $1,650 | 28% | No Change | |
Houses | $2,149 | 3% | No Change | |
Rooms | $750 | 9% | - |
Studio
Average rent
$699
Last 30 days
1%
Last year
7%
1 bedroom
Average rent
$1,256
Last 30 days
3%
Last year
8%
2 bedroom
Average rent
$1,475
Last 30 days
No Change
Last year
6%
3 bedroom
Average rent
$2,050
Last 30 days
1%
Last year
7%
4 bedroom
Average rent
$2,525
Last 30 days
2%
Last year
5%
At this time, we don't have enough active inventory for all rentals to generate data. Please check back soon to see neighborhood rent prices in Layton, UT.
Apartments
Average rent
$1,395
Last 30 days
4%
Condos
Average rent
$1,650
Last 30 days
28%
Houses
Average rent
$2,149
Last 30 days
3%
Rooms
Average rent
$750
Last 30 days
9%
The table above reflects average rent prices in Layton, UT, broken down by the number of bedrooms, neighborhoods, and property types. The availability of data for each category is dependent on market inventory and will adjust depending on your selected filters.
How does rent in Layton, UT compare to other cities?
Compare median rent prices in Layton and Bountiful by all bedroom counts and property types.
Layton
lower than the national median
lower than the national median
Takeaway
The median rent for all rentals in Layton, UT is 6% lower than the median rent in Bountiful, UT.
Average rent in nearby cities
Explore rent trends in neighboring markets
$1,750
$1,995
$1,662
$2,287
$1,790
$1,725
$2,225
$1,267
$1,800
$1,550
$2,500
$1,200
Discover rentals in Layton, UT

5d+ ago
Condo for rent in Layton
861 S Main St #C, Layton, UT 84041
2 beds
2 baths
$850
Condo for rent
Available Jul 1

2d ago
Apartment for rent in Layton
1448 W 1650 N #3, Layton, UT 84041
2 beds
1 bath
$1,050
$995
Price drop
Apartment for rent
Available May 29

5d+ ago
Apartment for rent in Layton
1731 N 1575 W #4, Layton, UT 84041
2 beds
1 bath
$1,075
Apartment for rent
Available Aug 21

5d+ ago
House for rent in Layton
1443 Westnorth #3, Layton, UT 84041
2 beds
1 bath
$1,125
House for rent
Available Dec 7


3h ago
Verified
5 beds
3 baths
$7,234
$7,083
Price drop
Apartment for rent

1h ago
Townhouse for rent in Layton
2516 N Knights Ln, Layton, UT 84041
2 beds
2.5 baths
$1,795
House for rent

2d ago
2525 N Hill Field Rd, Layton, UT 84041
1–2 beds
1 bath
$1,256–$1,659
Apartment for rent

2d ago
Apartment for rent in Layton
241 Freemont Way #241, Layton, UT 84041
1 bed
1 bath
$1,649
Apartment for rent
Available Aug 21


2d ago
60 S Main St, Layton, UT 84041
1–2 beds
1–2 baths
$1,250–$1,550
Apartment for rent

5d+ ago
1505 N Angel St, Layton, UT 84041
2 beds
1 bath
$1,435
Apartment for rent

4h ago
Verified
3 beds
2 baths
$3,080
$2,395
Price drop
House for rent
Available Jul 21
3h ago
Verified
5 beds
3 baths
$7,234
$7,083
Price drop
Apartment for rent


2d ago
Verified
2779 N Hobbs Creek Dr #NA, Layton, UT 84040
1 bed
1 bath
$1,295
House for rent
Available Jun 20
5d+ ago
1505 N Angel St, Layton, UT 84041
2 beds
1 bath
$1,435
Apartment for rent

16h ago
1469 Ash Dr, Layton, UT 84040
1 bed
1 bath
$850
House for rent
Available Jul 2
1d ago
2955 N 400 W, Layton, UT 84041
Studio–2 beds
1 bath
$730–$2,905
Price drop
Apartment for rent


4h ago
Verified
3 beds
2 baths
$3,080
$2,395
Price drop
House for rent
Available Jul 21
3h ago
Verified
5 beds
3 baths
$7,234
$7,083
Price drop
Apartment for rent
10h ago
Townhouse for rent in Layton
3130 Ne, Layton, UT 84040
3 beds
2.5 baths
$2,400
$2,300
Price drop
House for rent
Available Jul 3
16h ago
1469 Ash Dr, Layton, UT 84040
1 bed
1 bath
$850
House for rent
Available Jul 2


Stay up to date with rental market insights

Are you interested in licensing our current and historical rental real estate data, or do you have custom data requests? Contact datalicensing@zumper.com.
Frequently asked questions for Layton, UT
Quick answers to common questions about the Layton rental market.
How much is rent in Layton?
The average rent in Layton is $1,649 per month as of June 27, 2026.
Is rent up or down in Layton?
Average rent prices in Layton have increased by 3% over the last month and have decreased by 4% since last year.
How does Layton rent compare to the national average?
Rent in Layton is 15% below the national average, which means renters are paying approximately $301 less per month.
What salary do I need to afford rent in Layton?
To comfortably afford rent in Layton, you'd need to earn approximately $66,000/year, based on spending no more than 30% of your income on rent.
When is the best time of year to rent in Layton?
Layton's 2025 rental market shows one-bedroom apartments averaging around $1,200 per month, while two-bedroom units rent for around $1,500 monthly. These figures reflect current market conditions across the city's rental inventory.
Methodology
Rent prices are based on Zumper's rental listings from the past 30 days. Median rent is calculated across all available listings and property types on the platform. If you filter the page by bedroom count or property type, the pricing throughout the page will update automatically to reflect that segment of the rental market.
Household and population data come from the U.S. Census Bureau. Cost-of-living data is sourced from the Council for Community and Economic Research's Cost of Living Index (COLI).