
Bedroom count
Property type
Last updated on June 24, 2026
Average rent in
SIA, Decatur, IL
Average rent in
Last updated on June 24, 2026
Bedroom count
Property type
Median rent
Median rent in Sia
$917/mo
vs previous year
The average rent in Sia is $917 per month as of June 2026. This is 53% below the national average rent, or $1,033 less per month.
average price per square foot
Total rentals
Available rentals in Sia
14
for rent on Zumper.com as of June 2026
Rent price distribution
Share of Sia rentals at each price point
This report has limited data.Due a shortage of data for this selected bedroom and/or property type in SIA, Decatur, IL, in the last 30 days, rent estimates may not represent the actual market.
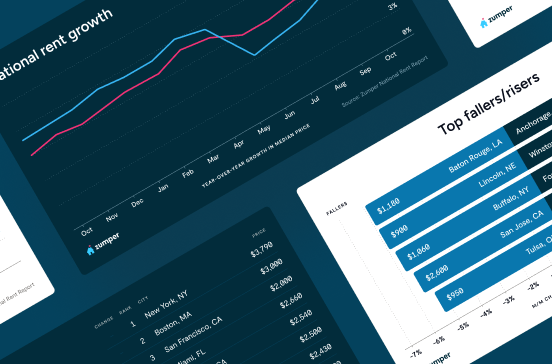
Rent trends in SIA, Decatur, IL
Average rent prices in Sia have decreased by 3% over the last month and have increased by 3% since last year.
Rent trends
Rent prices on this page are calculated on a rolling 30-day basis and updated daily.
Compare rent prices in
SIA, Decatur, IL
Rent prices in Sia vary by bedroom size, rental type, and neighborhood. The average rent for an apartment in Sia is $862, whereas a house costs $917. 1-bedroom apartments in Sia run $700 on average, while 2-bedroom apartments are $950.
Listings | ||||
|---|---|---|---|---|
Studio | $1,200 | - | - | |
1 bedroom | $725 | No Change | - | |
2 bedroom | $895 |  1% | No Change | |
3 bedroom | $995 | 13% |  15% | |
4 bedroom | $950 | 19% | - |
Listings | ||
|---|---|---|
Enos Park | $1,072 | |
Jefferson Park | $1,100 | |
Lincoln Park | $1,114 | |
Nua | $915 | |
Pillsbury | $1,100 | |
Westchester | $1,037 |
Listings | ||||
|---|---|---|---|---|
Apartments | $862 | No Change | No Change | |
Houses | $917 | 2% | No Change |
Studio
Average rent
$1,200
1 bedroom
Average rent
$725
2 bedroom
Average rent
$895
Last 30 days
1%
3 bedroom
Average rent
$995
Last 30 days
13%
Last year
15%
4 bedroom
Average rent
$950
Last 30 days
19%
Nua
Average rent
$915
Enos Park
Average rent
$1,072
Jefferson Park
Average rent
$1,100
Lincoln Park
Average rent
$1,114
Pillsbury
Average rent
$1,100
Westchester
Average rent
$1,037
Apartments
Average rent
$862
Houses
Average rent
$917
Last 30 days
2%
The table above reflects average rent prices in SIA, Decatur, IL, broken down by the number of bedrooms, neighborhoods, and property types. The availability of data for each category is dependent on market inventory and will adjust depending on your selected filters.
How does rent in Sia, Decatur, IL compare to other neighborhoods?
Compare median rent prices in Sia and Nua by all bedroom counts and property types.
Sia
lower than the national median
lower than the national median
Takeaway
The median rent for all rentals in Sia, Decatur, IL is equal to the median rent in Nua, Decatur, IL.
Average rent in nearby neighborhoods
Explore rent trends in neighboring markets
Discover rentals in SIA, Decatur, IL

15h ago
1363 E Johns Ave, Decatur, IL 62521
2 beds
1 bath
$575
House for rent
Available Jun 24

5d+ ago
SIA house for rent in Decatur
759 E Lawrence St #1, Decatur, IL 62521
3 beds
1 bath
$625
House for rent
Available Jan 8

5d+ ago
290 S Maffit St, Decatur, IL 62521
2 beds
1 bath
$700
House for rent
Available Jun 24
1d ago
SIA house for rent in Decatur
830 E Rogers Ave, Decatur, IL 62521
3 beds
1 bath
$725
House for rent
Available Mar 26


5d+ ago
SIA house for rent in Decatur
3 beds
1 bath
$1,275
House for rent

5d+ ago
SIA house for rent in Decatur
813 E Lawrence St #NA, Decatur, IL 62521
2 beds
1 bath
$1,050
House for rent
Available Jun 8

5d+ ago
SIA house for rent in Decatur
1329 E Riverside Ave, Decatur, IL 62521
2 beds
1 bath
$975
House for rent
Available May 31

5d+ ago
SIA house for rent in Decatur
1105 S Jasper St, Decatur, IL 62521
2 beds
1 bath
$950
House for rent
Available Jun 5


15h ago
SIA house for rent in Decatur
1286 E Vanderhoof St, Decatur, IL 62521
3 beds
1 bath
$895
House for rent
Available Jun 23
5d+ ago
SIA house for rent in Decatur
1259 E Whitmer St, Decatur, IL 62521
2 beds
1 bath
$800
House for rent
Available Jun 16

5d+ ago
SIA house for rent in Decatur
956 E Cantrell St, Decatur, IL 62521
4 beds
3 baths
$1,500
House for rent
Available Jun 8
5d+ ago
SIA house for rent in Decatur
803 E Whitmer St #NA, Decatur, IL 62521
3 beds
1 bath
$935
House for rent
Available Jun 12
5d+ ago
SIA house for rent in Decatur
956 E Cantrell St, Decatur, IL 62521
4 beds
3 baths
$1,500
House for rent
Available Jun 8
5d+ ago
SIA house for rent in Decatur
2 beds
1 bath
$895
House for rent
Available Apr 30
5d+ ago
SIA house for rent in Decatur
1259 E Whitmer St, Decatur, IL 62521
2 beds
1 bath
$800
House for rent
Available Jun 16
5d+ ago
SIA house for rent in Decatur
803 E Whitmer St #NA, Decatur, IL 62521
3 beds
1 bath
$935
House for rent
Available Jun 12
Stay up to date with rental market insights

Are you interested in licensing our current and historical rental real estate data, or do you have custom data requests? Contact datalicensing@zumper.com.
Frequently asked questions for SIA, Decatur, IL
Quick answers to common questions about the Sia rental market.
How much is rent in Sia?
The average rent in Sia is $917 per month as of June 20, 2026.
Is rent up or down in Sia?
Average rent prices in Sia have decreased by 3% over the last month and have increased by 3% since last year.
How does Sia rent compare to the national average?
Rent in Sia is 53% below the national average, which means renters are paying approximately $1,033 less per month.
What salary do I need to afford rent in Sia?
To comfortably afford rent in Sia, you'd need to earn approximately $37,000/year, based on spending no more than 30% of your income on rent.
Methodology
Rent prices are based on Zumper's rental listings from the past 30 days. Median rent is calculated across all available listings and property types on the platform. If you filter the page by bedroom count or property type, the pricing throughout the page will update automatically to reflect that segment of the rental market.
Household and population data come from the U.S. Census Bureau. Cost-of-living data is sourced from the Council for Community and Economic Research's Cost of Living Index (COLI).