
Bedroom count
Property type
Last updated on July 16, 2026
Average rent in
Goodrich - Kirtland Park, Cleveland, OH
Average rent in
Last updated on July 16, 2026
Bedroom count
Property type
Median rent
Median rent in Goodrich Kirtland Park
$1,817/mo
vs previous year
The average rent in Goodrich Kirtland Park is $1,817 per month as of July 2026. This is 7% below the national average rent, or $133 less per month.
average price per square foot
Total rentals
Available rentals in Goodrich Kirtland Park
23
for rent on Zumper.com as of July 2026
Rent price distribution
Share of Goodrich Kirtland Park rentals at each price point
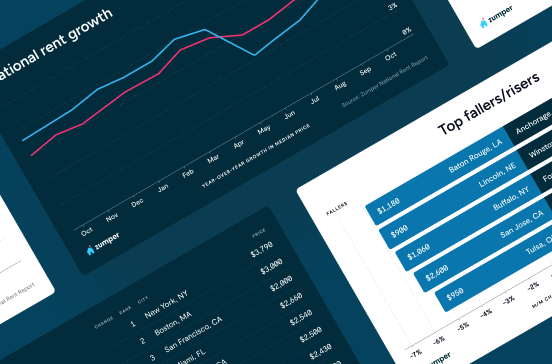
Rent trends in Goodrich - Kirtland Park, Cleveland, OH
Average rent prices in Goodrich Kirtland Park have increased by 24% over the last month and have increased by 40% since last year.
Rent trends
Rent prices on this page are calculated on a rolling 30-day basis and updated daily.
Compare rent prices in
Goodrich - Kirtland Park, Cleveland, OH
Rent prices in Goodrich Kirtland Park vary by bedroom size, rental type, and neighborhood. The average rent for an apartment in Goodrich Kirtland Park is $1,850, whereas a house costs $1,375. 1-bedroom apartments in Goodrich Kirtland Park run $1,525 on average, while 2-bedroom apartments are $2,180.
Listings | ||||
|---|---|---|---|---|
Studio | $1,080 |  6% | 45% | |
1 bedroom | $1,612 | 4% | 29% | |
2 bedroom | $2,300 | 11% | 30% | |
3 bedroom | $3,299 | 24% | 142% | |
4 bedroom | $2,300 | 10% | - |
Listings | ||
|---|---|---|
Brooklyn | $1,150 | |
Euclid Green | $1,100 | |
Independence | $1,525 | |
Industrial Valley | $1,150 | |
North Randall | $1,350 | |
St Clair Superior | $1,000 |
Listings | ||||
|---|---|---|---|---|
Apartments | $1,850 | 10% | No Change | |
Condos | $1,750 | 142% | - | |
Houses | $1,375 | 3% | - |
Studio
Average rent
$1,080
Last 30 days
6%
Last year
45%
1 bedroom
Average rent
$1,612
Last 30 days
4%
Last year
29%
2 bedroom
Average rent
$2,300
Last 30 days
11%
Last year
30%
3 bedroom
Average rent
$3,299
Last 30 days
24%
Last year
142%
4 bedroom
Average rent
$2,300
Last 30 days
10%
Brooklyn
Average rent
$1,150
Euclid Green
Average rent
$1,100
Industrial Valley
Average rent
$1,150
St Clair Superior
Average rent
$1,000
Independence
Average rent
$1,525
North Randall
Average rent
$1,350
Apartments
Average rent
$1,850
Last 30 days
10%
Condos
Average rent
$1,750
Last 30 days
142%
Houses
Average rent
$1,375
Last 30 days
3%
The table above reflects average rent prices in Goodrich - Kirtland Park, Cleveland, OH, broken down by the number of bedrooms, neighborhoods, and property types. The availability of data for each category is dependent on market inventory and will adjust depending on your selected filters.
How does rent in Goodrich Kirtland Park, Cleveland, OH compare to other neighborhoods?
Compare median rent prices in Goodrich Kirtland Park and Brooklyn by all bedroom counts and property types.
Goodrich Kirtland Park
lower than the national median
lower than the national median
Takeaway
The median rent for all rentals in Goodrich Kirtland Park, Cleveland, OH is 58% higher than the median rent in Brooklyn, Brooklyn, OH.
Average rent in nearby neighborhoods
Explore rent trends in neighboring markets
Discover rentals in Goodrich - Kirtland Park, Cleveland, OH

1d ago
1361 E 45th St #A, Cleveland, OH 44103
3 beds
1 bath
$1,100
House for rent
Available Jul 16

5d+ ago
Goodrich - Kirtland Park townhouse for rent in Cleveland
1427 E 51st St, Cleveland, OH 44103
4 beds
1 bath
$1,450
House for rent

1d ago
5455 N Marginal Rd, Cleveland, OH 44114
1–3 beds
1–2 baths
$1,784–$4,793
Apartment for rent
Available Mar 25

1d ago
3101 Euclid Ave, Cleveland, OH 44115
1 bed
1 bath
$1,400–$1,590
Apartment for rent

2d ago
Goodrich - Kirtland Park apartment for rent in Cleveland
1633 E 49th St Rear #REAR, Cleveland, OH 44103
1 bed
1 bath
$1,005
Apartment for rent
Available Jul 31
1d ago
3101 Euclid Ave, Cleveland, OH 44115
1 bed
1 bath
$1,400–$1,590
Apartment for rent
1d ago
5455 N Marginal Rd, Cleveland, OH 44114
1–3 beds
1–2 baths
$1,784–$4,793
Apartment for rent
Available Mar 25

1d ago
1692 E 55th St, Cleveland, OH 44103
1–2 beds
1 bath
$899–$1,049
Apartment for rent
1d ago
3101 Euclid Ave, Cleveland, OH 44115
1 bed
1 bath
$1,400–$1,590
Apartment for rent
1d ago
5455 N Marginal Rd, Cleveland, OH 44114
1–3 beds
1–2 baths
$1,784–$4,793
Apartment for rent
Available Mar 25

5d+ ago
Goodrich - Kirtland Park condo for rent in Cleveland
3395 Euclid Ave #2, Cleveland, OH 44115
4 beds
1.5 baths
$2,300
Condo for rent
Available Jul 1

5d+ ago
1692 E 55th St, Cleveland, OH 44103
1 bed
1 bath
$899
Apartment for rent
1d ago
1361 E 45th St #A, Cleveland, OH 44103
3 beds
1 bath
$1,100
House for rent
Available Jul 16
Stay up to date with rental market insights

Are you interested in licensing our current and historical rental real estate data, or do you have custom data requests? Contact datalicensing@zumper.com.
Frequently asked questions for Goodrich - Kirtland Park, Cleveland, OH
Quick answers to common questions about the Goodrich Kirtland Park rental market.
How much is rent in Goodrich Kirtland Park?
The average rent in Goodrich Kirtland Park is $1,817 per month as of July 11, 2026.
Is rent up or down in Goodrich Kirtland Park?
Average rent prices in Goodrich Kirtland Park have increased by 24% over the last month and have increased by 40% since last year.
How does Goodrich Kirtland Park rent compare to the national average?
Rent in Goodrich Kirtland Park is 7% below the national average, which means renters are paying approximately $133 less per month.
What salary do I need to afford rent in Goodrich Kirtland Park?
To comfortably afford rent in Goodrich Kirtland Park, you'd need to earn approximately $73,000/year, based on spending no more than 30% of your income on rent.
Methodology
Rent prices are based on Zumper's rental listings from the past 30 days. Median rent is calculated across all available listings and property types on the platform. If you filter the page by bedroom count or property type, the pricing throughout the page will update automatically to reflect that segment of the rental market.
Household and population data come from the U.S. Census Bureau. Cost-of-living data is sourced from the Council for Community and Economic Research's Cost of Living Index (COLI).