
Bedroom count
Property type
Last updated on July 29, 2026
Average rent in
Burleson, TX
Average rent in
Last updated on July 29, 2026
Bedroom count
Property type
Key takeaways for renters
The bottom line
Burleson, TX rent slipped 5.4% year over year, with a current median of $1,797/month. Renters today are paying $62 less per month on average than last year, continuing a downward trend since the peak of $1,900/month in January 2026.
Compared to national trends
Burleson is 6.9% more affordable than the $1,930/month national median. This positions the city as a moderately priced market for renters seeking value below the national median.
Rent ranges by bedroom
Studio rents in Burleson run around $650/month, 1-bedrooms around $1,318/month, and 2-bedrooms around $1,650/month. Larger units like 3-bedrooms and 4+ bedrooms command higher rents, with 3-bedrooms at $1,950/month and 4+ bedrooms at $2,350/month.
Neighborhood spotlight
The Studio bedroom segment in Burleson saw a YoY decline of 56.5%, contrasting with the overall citywide rent slip of 5.4%. This sharp drop shows a distinct trend for smaller units compared to the broader market.
Median rent
Median rent in Burleson
$1,797/mo
vs previous year
The average rent in Burleson is $1,797 per month as of July 2026. This is 7% below the national average rent, or $133 less per month.
average price per square foot
Total rentals
Available rentals in Burleson
122
for rent on Zumper.com as of July 2026
Rent price distribution
Share of Burleson rentals at each price point
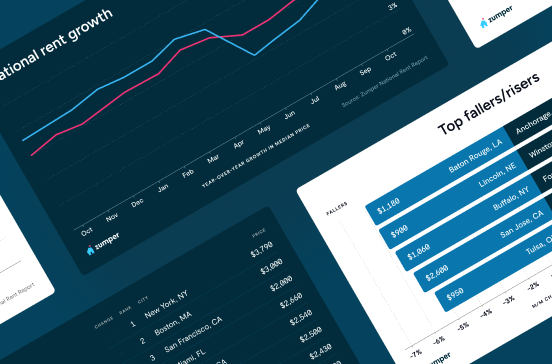
Rent trends in Burleson, TX
Average rent prices in Burleson have decreased by 5% over the last month and have decreased by 5% since last year.
Rent trends
Rent prices on this page are calculated on a rolling 30-day basis and updated daily.
Compare rent prices in
Burleson, TX
Rent prices in Burleson vary by bedroom size, rental type, and neighborhood. The average rent for an apartment in Burleson is $1,490, whereas a house costs $1,995. 1-bedroom apartments in Burleson run $1,315 on average, while 2-bedroom apartments are $1,625.
Listings | ||||
|---|---|---|---|---|
Studio | $650 |  5% |  57% | |
1 bedroom | $1,317 | 1% | No Change | |
2 bedroom | $1,650 | 2% | 5% | |
3 bedroom | $1,950 | 2% | 5% | |
4 bedroom | $2,350 | 14% | 7% |
Listings | ||
|---|---|---|
Mistletoe Hill | $1,887 | |
Wakefield | $1,792 |
Listings | ||||
|---|---|---|---|---|
Apartments | $1,490 | 5% | No Change | |
Condos | $1,800 | 17% | - | |
Houses | $1,995 | 4% | No Change |
Studio
Average rent
$650
Last 30 days
5%
Last year
57%
1 bedroom
Average rent
$1,317
Last 30 days
1%
Last year
No Change
2 bedroom
Average rent
$1,650
Last 30 days
2%
Last year
5%
3 bedroom
Average rent
$1,950
Last 30 days
2%
Last year
5%
4 bedroom
Average rent
$2,350
Last 30 days
14%
Last year
7%
Wakefield
Average rent
$1,792
Mistletoe Hill
Average rent
$1,887
Apartments
Average rent
$1,490
Last 30 days
5%
Condos
Average rent
$1,800
Last 30 days
17%
Houses
Average rent
$1,995
Last 30 days
4%
The table above reflects average rent prices in Burleson, TX, broken down by the number of bedrooms, neighborhoods, and property types. The availability of data for each category is dependent on market inventory and will adjust depending on your selected filters.
How does rent in Burleson, TX compare to other cities?
Compare median rent prices in Burleson and Arlington by all bedroom counts and property types.
Burleson
lower than the national median
lower than the national median
Takeaway
The median rent for all rentals in Burleson, TX is 20% higher than the median rent in Arlington, TX.
Average rent in nearby cities
Explore rent trends in neighboring markets
$1,499
$1,472
$2,000
$1,795
$1,719
$1,722
$1,589
$1,997
$1,899
$2,095
$1,800
$1,325
Discover rentals in Burleson, TX

5d+ ago
House for rent in Burleson
2113 Rustling Elm St, Burleson, TX 76028
2 beds
1 bath
$780
House for rent
Available Jul 1

5d+ ago
Apartment for rent in Burleson
429 Sw Thomas St #D, Burleson, TX 76028
2 beds
1 bath
$1,250
Apartment for rent

5d+ ago
Apartment for rent in Burleson
125 Ne Johnson Ave #26, Burleson, TX 76028
2 beds
2 baths
$1,275
Apartment for rent

5d+ ago
Apartment for rent in Burleson
2 beds
1.5 baths
$1,325
Apartment for rent


5d+ ago
House for rent in Burleson
2516 Castle Pines Dr #NA, Burleson, TX 76028
5 beds
3 baths
$8,950
House for rent
Available Aug 22

3d ago
Mistletoe Hill house for rent in Burleson
783 Peach Ln, Burleson, TX 76028
4 beds
2 baths
$7,500
House for rent
Available Jul 31

5d+ ago
House for rent in Burleson
4 beds
4 baths
$3,900
House for rent

5d+ ago
House for rent in Burleson
540 Ramon St, Burleson, TX 76028
4 beds
2 baths
$3,900
House for rent


1d ago
Verified
200 Village Creek Pkwy, Burleson, TX 76028
1–2 beds
1–2 baths
$1,270–$5,231
Apartment for rent

3d ago
Verified
1320 Nw Summercrest Blvd, Burleson, TX 76028
1–3 beds
1–2 baths
$1,228–$6,907
Apartment for rent

2d ago
Verified
4 beds
2 baths
$2,355
House for rent
Available Aug 17

5d+ ago
Verified
4 beds
2 baths
$2,215
House for rent
Available Aug 10


3d ago
Verified
1320 Nw Summercrest Blvd, Burleson, TX 76028
1–3 beds
1–2 baths
$1,228–$6,907
Apartment for rent
2d ago
Verified
4 beds
2 baths
$2,355
House for rent
Available Aug 17
5d+ ago
Verified
4 beds
2 baths
$2,215
House for rent
Available Aug 10
5d+ ago
Verified
4 beds
2 baths
$2,295
House for rent
Available Jul 10


1d ago
Verified
200 Village Creek Pkwy, Burleson, TX 76028
1–2 beds
1–2 baths
$1,270–$5,231
Apartment for rent
3d ago
Verified
1320 Nw Summercrest Blvd, Burleson, TX 76028
1–3 beds
1–2 baths
$1,228–$6,907
Apartment for rent
5d+ ago
1017 Nw Summercrest Blvd, Burleson, TX 76028
3 beds
1 bath
$1,450
Apartment for rent
5d+ ago
Verified
4 beds
2 baths
$2,215
House for rent
Available Aug 10


Stay up to date with rental market insights

Are you interested in licensing our current and historical rental real estate data, or do you have custom data requests? Contact datalicensing@zumper.com.
Frequently asked questions for Burleson, TX
Quick answers to common questions about the Burleson rental market.
How much is rent in Burleson?
The average rent in Burleson is $1,797 per month as of July 25, 2026.
Is rent up or down in Burleson?
Average rent prices in Burleson have decreased by 5% over the last month and have decreased by 5% since last year.
How does Burleson rent compare to the national average?
Rent in Burleson is 7% below the national average, which means renters are paying approximately $133 less per month.
What salary do I need to afford rent in Burleson?
To comfortably afford rent in Burleson, you'd need to earn approximately $72,000/year, based on spending no more than 30% of your income on rent.
When is the best time of year to rent in Burleson?
Based on Zumper's July 2026 data, one-bedroom apartments in Burleson average approximately $1,290/month and two-bedrooms around $1,610/month.
Methodology
Rent prices are based on Zumper's rental listings from the past 30 days. Median rent is calculated across all available listings and property types on the platform. If you filter the page by bedroom count or property type, the pricing throughout the page will update automatically to reflect that segment of the rental market.
Household and population data come from the U.S. Census Bureau. Cost-of-living data is sourced from the Council for Community and Economic Research's Cost of Living Index (COLI).