The Zumper Seattle Metro Report analyzed active listings in June across 18 metro cities to show the most and least expensive cities and cities with the fastest growing rents.
Cities Ranked By Rent
Le plus cher
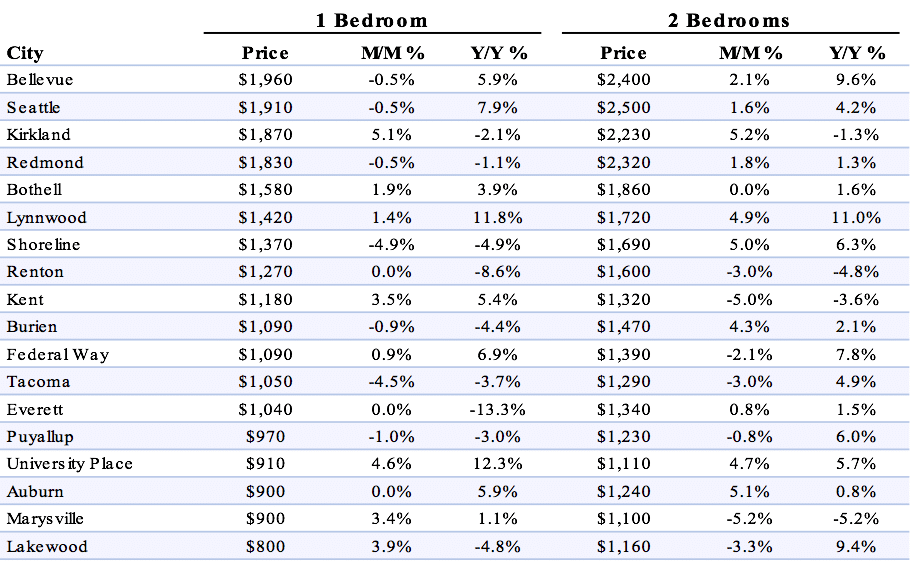
–Bellevue, WA rent dropped $10 since last month but held onto its position as the most expensive in the metro.
–Seattle, WA prices, similar to Bellevue, saw a $10 decrease but maintained its ranking as the 2nd most expensive.
–Kirkland, WA outpaced Redmond to become the 3rd priciest city with rent at $1,870.
Le moins cher
–Lakewood, WA rent grew $30 but continued to rank as the most affordable in the metro.
–Marysville & Auburn, WA tied for second with one bedrooms priced at $900.
–University Place, WA followed closely behind as third with rent at $910.
Growth Rate
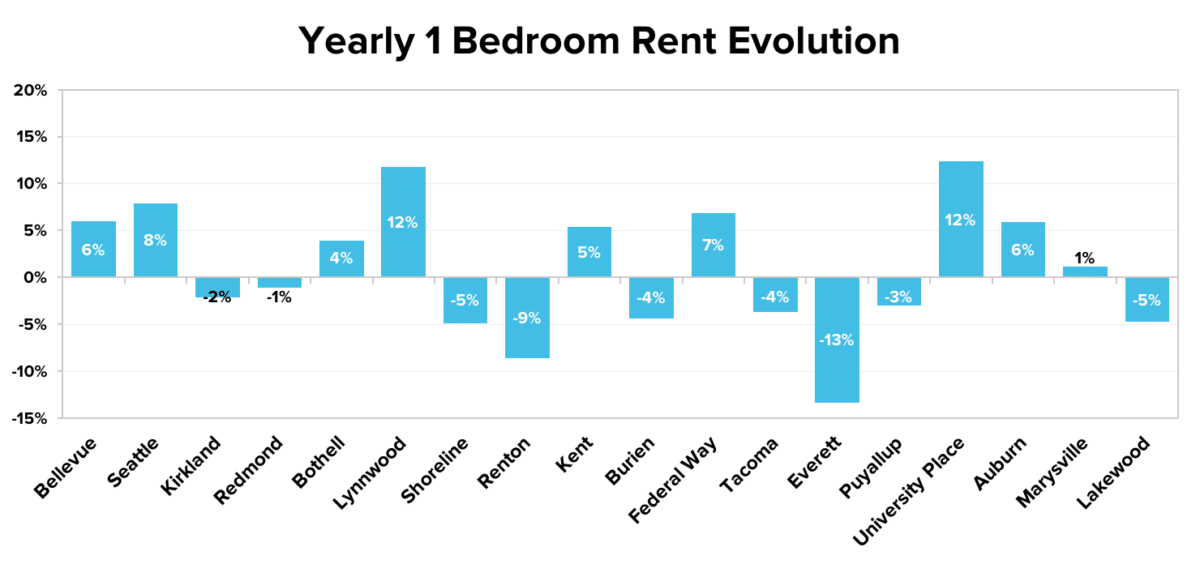
La croissance la plus rapide (Y/Y%)
–University Place, WA rent had the largest yearly growth rate, up 12.3%.
–Lynwood, WA rent was the second fastest growing, climbing 11.8% since this time last year.
–Seattle, WA was third with rent up 7.9%.
La croissance la plus rapide (M/M%)
–Kirkland, WA rent jumped 5.1% since last month, making it the fastest growing.
–University Place, WA rent, along with a big yearly bump, also had a large monthly growth rate of 4.6%.
–Lakewood, WA was third with prices growing 3.9% since last month.
Full Data
| One Bedroom | Two Bedrooms | ||||||
|---|---|---|---|---|---|---|---|
| Pos. | City | Price | M/M % | Y/Y % | Price | M/M % | Y/Y % |
| 1 | Scottsdale | $1,150 | -4.20% | 4.50% | $2,000 | 0.00% | 5.30% |
| 2 | Gilbert | $1,040 | 5.10% | 7.20% | $1,340 | 0.00% | 6.30% |
| 3 | Chandler | $970 | 1.00% | 3.20% | $1,180 | 1.70% | 5.40% |
| 4 | Peoria | $950 | -2.10% | 6.70% | $1,210 | -0.80% | 14.20% |
| 4 | Tempe | $950 | 1.10% | 8.00% | $1,160 | -1.70% | 5.50% |
| 5 | Goodyear | $910 | -2.20% | 3.40% | $1,430 | -4.70% | -15.90% |
| 5 | Surprise | $910 | 1.10% | 1.10% | $1,550 | 0.00% | 14.80% |
| 6 | Phoenix | $870 | -1.10% | 4.80% | $1,100 | 1.90% | 10.00% |
| 7 | Avondale | $830 | 0.00% | 3.80% | $970 | -2.00% | 2.10% |
| 8 | Mesa | $810 | 1.30% | 9.50% | $950 | -3.10% | 0.00% |
| 9 | Glendale | $680 | -1.40% | 4.60% | $900 | 0.00% | -2.20% |
| 10 | Casa Grande | $540 | 5.90% | 1.90% | $630 | -1.60% | 3.30% |
| 11 | Florence | $490 | 0.00% | -5.80% | $790 | 5.30% | -1.30% |
À propos
The Zumper Seattle Metro Report analyzed active listings that hit the market in June 2017. Listings are aggregated by city to calculate median asking rents.
In the market for a new place? Search all Seattle apartments for rent on Zumper now.
Stay up to date with Zumper by following us on Facebook, Gazouillement, Instagram, & Pinterest.
Contenu associé


